

Abstract
Background
In the UK, dementia affects 5% of the population aged over 65 years and 25% of those over 85 years. Frontotemporal dementia (FTD) represents one subtype and is thought to account for up to 16% of all degenerative dementias. Although the core of the diagnostic process in dementia rests firmly on clinical and cognitive assessments, a wide range of investigations are available to aid diagnosis.
Regional cerebral blood flow (rCBF) single‐photon emission computed tomography (SPECT) is an established clinical tool that uses an intravenously injected radiolabelled tracer to map blood flow in the brain. In FTD the characteristic pattern seen is hypoperfusion of the frontal and anterior temporal lobes. This pattern of blood flow is different to patterns seen in other subtypes of dementia and so can be used to differentiate FTD.
It has been proposed that a diagnosis of FTD, (particularly early stage), should be made not only on the basis of clinical criteria but using a combination of other diagnostic findings, including rCBF SPECT. However, more extensive testing comes at a financial cost, and with a potential risk to patient safety and comfort.
Objectives
To determine the diagnostic accuracy of rCBF SPECT for diagnosing FTD in populations with suspected dementia in secondary/tertiary healthcare settings and in the differential diagnosis of FTD from other dementia subtypes.
Search methods
Our search strategy used two concepts: (a) the index test and (b) the condition of interest. We searched citation databases, including MEDLINE (Ovid SP), EMBASE (Ovid SP), BIOSIS (Ovid SP), Web of Science Core Collection (ISI Web of Science), PsycINFO (Ovid SP), CINAHL (EBSCOhost) and LILACS (Bireme), using structured search strategies appropriate for each database. In addition we searched specialised sources of diagnostic test accuracy studies and reviews including: MEDION (Universities of Maastricht and Leuven), DARE (Database of Abstracts of Reviews of Effects) and HTA (Health Technology Assessment) database.
We requested a search of the Cochrane Register of Diagnostic Test Accuracy Studies and used the related articles feature in PubMed to search for additional studies. We tracked key studies in citation databases such as Science Citation Index and Scopus to ascertain any further relevant studies. We identified ‘grey’ literature, mainly in the form of conference abstracts, through the Web of Science Core Collection, including Conference Proceedings Citation Index and Embase. The most recent search for this review was run on the 1 June 2013.
Following title and abstract screening of the search results, full‐text papers were obtained for each potentially eligible study. These papers were then independently evaluated for inclusion or exclusion.
Selection criteria
We included both case‐control and cohort (delayed verification of diagnosis) studies. Where studies used a case‐control design we included all participants who had a clinical diagnosis of FTD or other dementia subtype using standard clinical diagnostic criteria. For cohort studies, we included studies where all participants with suspected dementia were administered rCBF SPECT at baseline. We excluded studies of participants from selected populations (e.g. post‐stroke) and studies of participants with a secondary cause of cognitive impairment.
Data collection and analysis
Two review authors extracted information on study characteristics and data for the assessment of methodological quality and the investigation of heterogeneity. We assessed the methodological quality of each study using the QUADAS‐2 (Quality Assessment of Diagnostic Accuracy Studies) tool. We produced a narrative summary describing numbers of studies that were found to have high/low/unclear risk of bias as well as concerns regarding applicability. To produce 2 x 2 tables, we dichotomised the rCBF SPECT results (scan positive or negative for FTD) and cross‐tabulated them against the results for the reference standard. These tables were then used to calculate the sensitivity and specificity of the index test. Meta‐analysis was not performed due to the considerable between‐study variation in clinical and methodological characteristics.
Main results
Eleven studies (1117 participants) met our inclusion criteria. These consisted of six case‐control studies, two retrospective cohort studies and three prospective cohort studies. Three studies used single‐headed camera SPECT while the remaining eight used multiple‐headed camera SPECT. Study design and methods varied widely. Overall, participant selection was not well described and the studies were judged as having either high or unclear risk of bias. Often the threshold used to define a positive SPECT result was not predefined and the results were reported with knowledge of the reference standard. Concerns regarding applicability of the studies to the review question were generally low across all three domains (participant selection, index test and reference standard).
Sensitivities and specificities for differentiating FTD from non‐FTD ranged from 0.73 to 1.00 and from 0.80 to 1.00, respectively, for the three multiple‐headed camera studies. Sensitivities were lower for the two single‐headed camera studies; one reported a sensitivity and specificity of 0.40 (95% confidence interval (CI) 0.05 to 0.85) and 0.95 (95% CI 0.90 to 0.98), respectively, and the other a sensitivity and specificity of 0.36 (95% CI 0.24 to 0.50) and 0.92 (95% CI 0.88 to 0.95), respectively.
Eight of the 11 studies which used SPECT to differentiate FTD from Alzheimer's disease used multiple‐headed camera SPECT. Of these studies, five used a case‐control design and reported sensitivities of between 0.52 and 1.00, and specificities of between 0.41 and 0.86. The remaining three studies used a cohort design and reported sensitivities of between 0.73 and 1.00, and specificities of between 0.94 and 1.00. The three studies that used single‐headed camera SPECT reported sensitivities of between 0.40 and 0.80, and specificities of between 0.61 and 0.97.
Authors' conclusions
At present, we would not recommend the routine use of rCBF SPECT in clinical practice because there is insufficient evidence from the available literature to support this.
Further research into the use of rCBF SPECT for differentiating FTD from other dementias is required. In particular, protocols should be standardised, study populations should be well described, the threshold for 'abnormal' scans predefined and clear details given on how scans are analysed. More prospective cohort studies that verify the presence or absence of FTD during a period of follow up should be undertaken.
Keywords: Humans; Cerebrovascular Circulation; Case‐Control Studies; Cohort Studies; Dementia; Dementia/diagnostic imaging; Diagnosis, Differential; Frontal Lobe; Frontal Lobe/blood supply; Frontotemporal Dementia; Frontotemporal Dementia/diagnostic imaging; Frontotemporal Dementia/physiopathology; Sensitivity and Specificity; Temporal Lobe; Temporal Lobe/blood supply; Tomography, Emission‐Computed, Single‐Photon; Tomography, Emission‐Computed, Single‐Photon/methods
Plain language summary
Regional Cerebral Blood Flow SPECT for detection of Frontotemporal dementia in people with suspected dementia
Background
This review focused on one type of dementia, frontotemporal dementia (FTD). This neurodegenerative disease affects the frontal and temporal lobes of the brain and accounts for up to 16% of all degenerative dementias. People who have this disease may develop changes in their behaviour, speech or ability to plan. It is important to identify people with FTD correctly as the disease course and response to treatment differs from other dementias such as Alzheimer’s disease.
One test used by healthcare professionals to help make a diagnosis of FTD, is regional cerebral blood flow single photon emission computed tomography (rCBF SPECT). This investigation allows visualisation of blood flow within the brain. In FTD it is thought that the pattern of blood flow to the brain can be used to tell the difference between FTD and other dementias. However, it is not clear whether using rCBF SPECT in this way improves our ability to make an accurate diagnosis of FTD. As all investigations come with a financial cost, it is important that their benefit is known.
Aim: This review assessed the evidence regarding the accuracy of rCBF SPECT in detecting FTD in people with suspected dementia.
Study characteristics
We searched many databases for all papers with FTD and rCBF SPECT as their focus. These papers were reviewed independently by several researchers. After application of inclusion and exclusion criteria, eleven studies including 299 individuals with FTD were available for this review. The studies were published over a 21‐year period, with a study size ranging from 27 to 363 participants, mainly recruited from University clinics, tertiary referral centres or memory clinics. Of the 11 studies, three used single‐headed (single detector) gamma cameras, a method no longer used in clinical practice today. Evidence is current to June 2013.
Quality of the evidence
The majority of studies were at high risk of bias due to insufficient details on how participants were selected and how the rCBF SPECT scans were conducted and analysed. The main limitations of the review were poor reporting, variability of study design and a lack of standardisation of image interpretation between centres.
Key findings
Due to small study numbers and large variation in how the studies were carried out, we are unable at present to recommend the routine use of rCBF SPECT for diagnosing FTD in clinical practice.
Summary of findings
Summary of findings'. 'Performance of rCBF SPECT for detection of frontotemporal dementia.
| Is the SPECT FTD pattern indicative of developing FTD over time in populations with suspected dementia? What is the diagnostic accuracy of rCBF SPECT biomarker for discriminating FTD from non‐FTD, and FTD from Alzheimer's disease dementia and other dementia subtypes? | |||||||
| Population | Participants with suspected dementia and rCBF SPECT administered at baseline (prospective cohort design) (n = 3) Participants with suspected dementia and rCBF SPECT administered at baseline with histopathological confirmation (retrospective cohort design) (n = 2) Participants clinically diagnosed with FTD or other dementia subtypes using standard clinical diagnostic criteria (case‐control design) (n = 6) |
||||||
| Setting | Outpatients from University centres or University memory clinics (n = 7) Outpatients from General Hospital memory clinics (n = 1) Tertiary referral centre (n = 1) Multicentre (different French hospitals) (n = 1) Not reported (n = 1) |
||||||
| Sampling procedure | Consecutive or random (n = 3) Not consecutive or random (n = 4) Not reported (n = 4) |
||||||
| Prior testing | Prior to performing rCBF SPECT scans, diagnostic criteria for identifying dementia subtypes were applied in studies that used a case‐control study design | ||||||
| Index tests | 99mTc‐HMPAO SPECT; 99mTc‐ECD SPECT; Xenon SPECT | ||||||
| Threshold prespecified at baseline | Yes (n = 6) No (n = 3) Unclear (n = 2) |
||||||
| Threshold | Included studies used a range of thresholds | ||||||
| SPECT scan interpretation | Combined visual and semiquantitative interpretation (n = 6) Visual interpretation only (n = 5) |
||||||
| rCBF hypoperfusion region | Authors used brain regions that were expected to be affected by FTD and so frontal and/or temporal lobes were involved in all studies. Two studies also included parietal and occipital lobes in their evaluations. One study used a range of Broadmann areas (BAs) | ||||||
| Target condition | Frontotemporal dementia (FTD): ante‐mortem clinical diagnosis of FTD (n = 7) or neuropathological diagnosis of FTD (n = 4) | ||||||
| Reference standard | For ante‐mortem clinical diagnosis: Neary 1998 criteria (n = 4); Brun 1994 criteria (n = 1); not specified (n = 2) For neuropathological diagnosis: Shi 2005 (n = 1); Cairns 2007 (n = 1); not specified (n = 2) |
||||||
| Diagnostic criteria for dementia subtypes | For AD dementia: NINCDS‐ADRDA criteria (n = 6); not specified (n = 1); histopathological criteria (n = 4) For vascular dementia: NINDS‐AIREN criteria (n = 2); histopathological (n = 1) |
||||||
| Included studies | Eleven studies (n = 1077 participants) assessed rCBF SPECT for differentiating between FTD and AD. Five of these studies (n = 609) also assessed rCBF SPECT for differentiating between FTD and non‐FTD | ||||||
| Reference standard: neuropathological diagnosis. Objective A: rCBF SPECT FTD type pattern (at baseline) indicative of FTD (at follow up) in participants with suspected FTD at baseline; Objective B: The accuracy of rCBF SPECT pattern in differentiating FTD from AD | |||||||
| Objective | Study | N | Confirmed FTD |
Sensitivity (95% CI) |
Specificity (95% CI) |
Quality | Comment |
| A | Read 1995 | 27 | 7 | 100% (0.59, 1.00) |
100% (0.83, 1.00) |
Unclear risk of bias was seen in the patient selection QUADAS‐2 domain. The remaining three domains considered to be at low risk of bias. There were no concerns about applicability (Read 1995; Rollin‐Sillaire 2012). High risk of bias was seen in patient selection, index test, and flow and timing QUADAS‐2 domains. The reference standard was strength of the study. There were no concerns about applicability (Lipton 2004) High risk of bias was seen in participant selection and index test domain. The reference standard was strength of the study. There were no concerns about applicability (McNeill 2007) |
Objective A: These papers used the gold standard of histopathological diagnosis; however. the methods used in participant selection and image analysis have led to the introduction of a degree of bias Objective B: These papers used the gold standard of histopathological diagnosis. Although the diagnosis is robust, case‐control design, small study numbers, different methodologies with a wide range of sensitivities and specificities mean that it is difficult to make recommendations on the basis of these results |
| A | Rollin‐Sillaire 2012 | 48 | 9 | 75% (0.43, 0.95) |
97% (0.85. 1.00) |
||
| B | Read 1995 | 20 | 7 | 100% (0.59, 1.00) |
100% (0.75, 1.00) |
||
| B | Rollin‐Sillaire 2012 | 35 | 9 | 75% (0.43, 0.95) |
100% (0.85, 1.00) |
||
| B | Lipton 2004 | 23 | 6 | 100% (0.54, 1.00) |
41% (0.18, 0.67) |
||
| B | McNeill 2007 | 56 | 20 | 80% (0.59, 0.93) | 61 % (0.42, 0.78) | ||
|
Investigation of heterogeneity |
We were not able to formally assess the effect of potential sources of heterogeneity because meta‐analyses were not performed | ||||||
| Conclusion | Further research on the use of rCBF SPECT for differentiating FTD from other dementias is required. In particular, protocols should be standardised, study populations well described, threshold for 'abnormal' scans predefined and clear details given on how scans are analysed | ||||||
rCBF=regional cerebral blood flow; SPECT=single‐photon emission computerised tomography; FTD=frontotemporal dementia; 99mTc‐HMPAO=Technetium exametazime hexamethylpropyleneamine oxime; 99mTc‐ECD=Technetium exametazime ethyl cysteinate diethylester; AD=Alzheimer's disease; NINCDS‐ADRDA=National Institute of Neurological and Communicative Disorders and Stroke and the Alzheimer's Disease and Related Disorders Association; NINDS‐AIREN=National Institute of Neurological and Communicative Disorders and Stroke and Association Internationale pour la Recherche et l'Enseignement en Neurosciences; QUADAS‐2=Quality Assessment of Diagnostic Accuracy Studies
Background
Target condition being diagnosed
Dementia is a progressive syndrome of global cognitive impairment. In the UK, it affects 5% of the population over 65 years and 25% of those over 85 years (Alzheimer's Society 2007). In 2010, there were approximately 36 million people living with dementia worldwide (Alzheimer's Disease International 2010). The greatest increases in prevalence will be seen in developing regions. By 2040, China and its western‐Pacific neighbours are predicted to have 26 million people living with dementia (Ferri 2005).
Dementia encompasses a group of neurodegenerative disorders that are characterised by a progressive loss in cognitive function and the ability to perform activities of daily living; these losses can be accompanied by neuropsychiatric symptoms and challenging behaviours of varying type and severity. The underlying pathology is usually degenerative and subtypes of dementia include Alzheimer's disease (AD), vascular dementia (VaD), dementia with Lewy bodies (DLB) and frontotemporal dementia (FTD) (previously known as Pick's disease). There may be considerable overlap in clinical and pathological presentations between subtypes (MRC CFAS 2001) and there is often co‐existence of AD and VaD (Matthews 2009; Savva 2009).
FTD is a neurodegenerative disease that affects the anterior temporal and frontal lobes. It is thought to account for up to 16% of all degenerative dementias (Miller 1997; Ratnavalli 2002) and is the second most common young‐onset dementia (Seelaar 2011). It is characterised clinically by progressive behavioural change, executive dysfunction and language difficulties, and comprises three main clinical syndromes: behavioural variant FTD (bvFTD), semantic dementia (SD) and progressive non‐fluent aphasia (PNFA). Although the core of the diagnostic process in dementia rests firmly on clinical and cognitive assessments, a wide range of investigations are available to further aid diagnosis. These include blood and cerebrospinal fluid tests, as well as neuroimaging modalities such as magnetic resonance imaging (MRI), regional cerebral blood flow (rCBF) single‐photon emission computed tomography (SPECT) and regional cerebral metabolism 18F‐fluorodeoxyglucose positron emission tomography (FDG‐PET). Structural imaging in individuals with FTD using MRI shows frontal and temporal atrophy, which can be asymmetrical; rCBF SPECT imaging shows anterior frontal or temporal hypoperfusion.
The management of individuals with dementia requires an accurate diagnosis of the underlying neurodegenerative process in order to guide prognosis, early therapeutic intervention, and advice regarding heritability and social and environmental management. This is particularly important in FTD, which has a wide range of presentations that often overlap significantly with those of other dementias, especially AD and VaD. Accurate diagnosis of FTD as the underlying aetiology of the dementing illness is important as treatment with cholinesterase inhibitors (used in AD) may have adverse effects in individuals with FTD.
The clinical criteria used to diagnose FTD have evolved over time. In 1994, the Lund‐Manchester group produced a set of research criteria for a diagnosis of FTD(Lund and Manchester Groups 1994). These emphasised the importance of core behavioural and affective symptoms, progressive reduction in speech, and profound failure on ‘frontal lobe’ tests in the absence of severe amnesia, aphasia or perceptuospatial disorder. In 1998, Neary and colleagues further refined the Lund‐Manchester criteria and renamed the condition frontotemporal lobar degeneration (FTLD) (Neary 1998). They provided clinical descriptions of bvFTD, PNFA and SD. These criteria recognised the clinical heterogeneity within the FTLD spectrum and provided diagnostic guidelines for all three syndromes. They also made a distinction between core and supportive diagnostic features. Limitations of these criteria were the ambiguity of behavioural descriptors and inflexibility in the application of criteria (i.e. the requirement that all five core features be manifest). In 2001, McKhann and colleagues developed criteria to enable clinicians to identify individuals with FTD and expedite their referral for evaluation (McKhann 2001). The overall clinical spectrum was renamed FTD and the clinical criteria were simplified into two distinct presentations depending on whether progressive changes were apparent in behaviour or language. It is thought that, although useful clinically, these criteria lack sufficient specificity to be applicable for research purposes, particularly in the case of progressive aphasia syndromes (Rascovsky 2007). More recently, the International Behavioural Variant FTD Consortium (FTDC) developed revised guidelines for the diagnosis of bvFTD. It is thought that these revised criteria improve diagnostic accuracy compared with previously established criteria (Rascovsky 2011).
A number of studies have established that the currently accepted clinical criteria for FTD are relatively insensitive, particularly in the early stages of the disease process where the sensitivity of clinical criteria decreases to 37% (Seelaar 2011). In autopsy‐proven studies, the current clinical criteria correctly classify approximately 80% to 90% of bvFTD (Seelaar 2011).
It has been proposed that a diagnosis of FTD, particularly in the early stages, should be made not only on clinical criteria but using a combination of other diagnostic findings, including rCBF SPECT. However, more extensive testing comes at a financial cost and with a potential risk to patient safety and comfort. Thus it is important that additional diagnostic tests are of proven benefit. rCBF SPECT is a neuroimaging tool that has been found by some to improve our ability to differentiate FTD from other dementias (Miller 1997; Rascovsky 2011), although its use is controversial (Knopman 2001).
Index test(s)
rCBF SPECT is an established non‐invasive clinical tool that maps blood flow to different areas of the brain. rCBF is thought to indirectly reflect neural activity in each brain region at rest. In order to depict the patterns of blood flow within the brain, a radiopharmaceutical is injected into the body, which is rapidly removed from the blood by brain tissue. The radiotracers most commonly used are 99mtechnetium‐hexamethyl‐propylenamine oxime (99mTc‐HMPAO) or 99mtechnetium‐ethyl‐cysteinate dimer (99mTc‐ECD). The radiotracer enters the brain at first pass, with its incorporation proportional to the rCBF in the first few minutes after injection. Modifications in rCBF after injection do not change the initial distribution of the tracer because of intracellular trapping.
Shortly after injection, the person is scanned using a gamma camera that images the radioactive emissions from the individual at multiple angles around the head. These individual images are reconstructed to create a three‐dimensional map of cerebral blood flow. According to relevant guidelines (Juni 2009; Kapucu 2009), at least 5 million counts should be acquired; this is rarely practical with single‐headed cameras as the total acquisition time will approach one hour, and most systems now use multiple‐headed cameras. The amount of clinically significant hypoperfusion is generally determined by visual inspection, although computerised analysis, commonly achieved by comparing the scan being taken to a database of scans from healthy individuals, is increasingly popular. There are potential challenges with study interpretation due to the differing methods used in analysis, pre‐ or post‐processing of images and the advances seen in rCBF SPECT technology over time. These factors are discussed in more detail below.
Individuals with different dementias are thought to have different patterns of abnormal blood flow. In FTD, perfusion tends to be reduced in the frontal and anterior temporal lobes (Miller 1997), whereas individuals with AD demonstrate reduced flow in the medial temporal, superior temporal, parietal, posterior cingulate cortex and precuneus. These patterns have been used to differentiate FTD from AD (Catafau 2001) with a sensitivity of 71% and specificity of 78.2% (Miller 1997).
rCBF SPECT is usually used clinically when the presence or type of dementia is uncertain after clinical assessment, neuropsychological testing and structural imaging. This imaging modality has an advantage over structural neuroimaging techniques as rCBF changes may precede structural changes. Compared with FDG‐PET, which depicts cerebral metabolism, rCBF SPECT is more widely available.
Clinical pathway
Presentation
In the UK, people with suspected dementia usually present first to their general practitioner who may administer basic screening tests (blood tests and simple tests of cognitive function) and may potentially refer them to a hospital memory clinic. At this stage, other physical or mental disorders, for example depression or hypothyroidism, which might be contributing to the cognitive impairment, are typically excluded or treated. Unlike dementias, such as AD, which usually have memory loss as their first symptom, FTD more commonly presents with personality changes, disinhibited behaviour, mood disorder and even psychosis. As a result, this diagnosis may be missed initially, with the individual referred for specialist assessment only when a diagnosis of FTD is suspected.
Standard diagnostic practice
The standard assessment of dementia includes taking a history, a clinical examination (including neurological, mental state and cognitive examinations) and an interview with a relative or other informant. A neuroradiological examination (computed tomography (CT) or MRI of the brain) is also recommended in most recent guidelines (McKhann 2011; NICE 2006). Individuals may also receive a full neuropsychological assessment, if appropriate, before a diagnosis of dementia is made. Diagnostic assessment pathways may vary between countries and diagnoses may be made by a variety of specialists including neurologists and geriatricians.
A diagnosis of dementia is defined as a deficit in more than two cognitive domains of sufficient degree to impair functional activities. These symptoms are usually progressive over a period of at least several months and should not be attributable to any other brain disease. The World Health Organization International Classification of Diseases 10th revision (ICD‐10) diagnostic criteria for dementia are detailed in Appendix 1.
The FTD subtype of dementia is usually diagnosed on the basis of clinical presentation, according to currently accepted clinical criteria (Neary 1998; Rascovsky 2007a). rCBF SPECT is sometimes used to help establish the diagnosis of FTD, but is usually carried out only in secondary or tertiary referral centres.
Role of index test(s)
How might the index test improve diagnoses, treatments and outcomes?
If FTD can be diagnosed at an early stage, this will help people with dementia, their families and potential carers to make timely plans for the future. In the early stages of the disease, and particularly in young‐onset bvFTD, FTD can be misdiagnosed as another subtype of dementia (often AD). Coupled with appropriate contingency planning, proper recognition of the disease may also help to avoid costly admissions to hospital or institutional care (NAO 2007). In addition, the accurate early identification of FTD may improve opportunities for the use of newly evolving interventions designed to delay or prevent the progression to more debilitating stages of dementia.
Alternative test(s)
Alternative tests used in the diagnosis of FTD include CT, MRI and PET. These modalities were not included in this review as there are currently no standard practice tests available for the diagnosis of FTD.
Rationale
The public health burden of dementia is of growing concern. With the changing age structure of populations in both high‐ and low‐income countries, the prevalence of dementia is increasing (Ferri 2005). At the population level, there are major implications for service provision and planning, given that this condition leads to progressive functional dependence over several years. In the UK, it is estimated that the annual expenditure on dementia care is GBP17 billion (Alzheimer's Society 2007), and the worldwide cost of dementia in 2010 was USD604 billion (Alzheimer's Disease International 2010). Accurate early diagnosis of dementia and the subtype of FTD may help in planning appropriate care and reducing costs.
It is important that expensive and invasive diagnostic tests are of proven benefit over more established clinical and imaging assessments. The clinical use of SPECT in differentiating AD, VaD and FTD has been recognised in certain diagnostic guidelines. NICE 2006 recommend that rCBF SPECT should be used to differentiate AD, VaD and FTD if the diagnosis is in doubt. Rascovsky 2011 state that the additional use of SPECT could give greater certainty to a diagnosis of FTD. However, other guidelines such as Knopman 2001 do not recommend SPECT for routine use in either initial or differential diagnosis. Thus, a systematic review of the diagnostic accuracy of rCBF SPECT in FTD is needed.
Objectives
Primary objectives
To determine the diagnostic accuracy of rCBF SPECT in diagnosing FTD in populations with suspected dementia in secondary/tertiary healthcare settings
To determine the accuracy of rCBF SPECT in the differential diagnosis of FTD from other dementia subtypes
Secondary objectives
To highlight the quality and quantity of research evidence available regarding the diagnostic accuracy of rCBF SPECT in diagnosing FTD in the target population
To identify gaps in the evidence and where further research is required
Methods
Criteria for considering studies for this review
Types of studies
Two main study designs are used when evaluating rCBF SPECT in the diagnosis of FTD: cross‐sectional studies with a case‐control design and longitudinal or cohort studies with delayed verification of diagnosis (i.e. verification of FTD during a period of follow up). We expected that most of the study designs identified in this review would be case‐control studies in which rCBF SPECT was administered to a sample of people with a diagnosis of FTD and to a sample of people without FTD (most likely with AD). We expected also to find some studies in which a cohort of people with unspecified dementia (i.e. dementia of unknown subtype) were administered rCBF SPECT and then followed up for confirmation of the presence or absence of FTD, either by clinical course or by neuropathological confirmation. Study participants were also likely to have undergone other imaging investigations (e.g. CT or MRI) to help exclude other subtypes of dementia prior to study recruitment. The reason for our expectation was that SPECT is an expensive and invasive test which uses a radiotracer.
Case‐control studies are subject to considerable spectrum bias (Davis 2013). Prior to carrying out this work, we agreed that if most of the studies identified were in this category, we would present the findings of these studies as the current best evidence of the diagnostic accuracy of rCBF SPECT for FTD in a narrative review, with no meta‐analysis in order to avoid a biased summary estimate of accuracy. We would also highlight the limitations of the clinical implications of these findings. If we identified any cohort studies of participants with unspecified dementia that received rCBF SPECT at baseline, we planned to present the findings separately, with a meta‐analysis if pooling was appropriate.
Settings
Due to the expense and technological expertise required, we expected the studies to be limited to secondary and tertiary healthcare settings. Specialist memory clinics provide the most common source of participant recruitment to rCBF SPECT studies. We expected such individuals to have been likely to have undergone neuropsychological testing and imaging investigations prior to recruitment.
Participants
For case‐control studies, we included all participants who had been recruited and clinically diagnosed with FTD (bvFTD, PNFA or SD) or other dementia subtypes using standard clinical diagnostic criteria (see the Reference standards section). For cohort studies, we included studies in which all participants with suspected dementia were administered rCBF SPECT at baseline. We excluded studies with selected populations (e.g. post‐stroke or those with Parkinson's disease) and studies of participants with a secondary cause of cognitive impairment, namely current or a history of alcohol/drug abuse, central nervous system trauma (e.g. subdural haematoma), tumour or infection.
Index tests
The use of rCBF SPECT in the characterisation of FTD is dependent on a chain of actions, all of which have the potential to affect the quality of the data used for clinical reporting. A radiotracer is injected into an individual, followed by image acquisition and reconstruction to produce a blood flow map. The blood flow map is interpreted by one or more clinicians with the aim of identifying patterns representative of FTD (i.e. bilateral frontal hypoperfusion). Further computerised analysis may then be carried out, typically the comparison of the blood flow map obtained with those in a database of control scans.
European Association of Nuclear Medicine (EANM) (Kapucu 2009) and Society of Nuclear Medicine (SNM) (Juni 2009) guidelines for brain perfusion SPECT using 99mTc‐labelled radiopharmaceuticals in the USA and Europe make detailed recommendations which are summarised below.
Patient preparation: place the individuals in a quiet, dimly lit room, insert an intravenous cannula 10 to 15 minutes prior to injection (no patient interaction within 5 minutes of injection)
Radiopharmaceutical preparation: use 99mTc‐ECD or stabilised 99mTc‐HMPAO
Data acquisition: detailed recommendations are made, notably concerning the use of multiple detector gamma cameras, collimation and acquired counts
Image processing: general recommendations are made regarding reconstruction, corrections, reformatting of slice data and semiquantitative evaluation
Interpretation criteria: relevant structural information from CT and MRI must be considered to help interpret the SPECT scans. It is possible to standardise and analyse SPECT images by focusing on a particular region of interest, comparing them to a normal database, or both.
Both the EANM and SNM guidelines state that single‐detector systems (single‐headed) should be used only if the scan time is such that at least 5 million counts are detected. We did not exclude studies that used a single‐headed system, but evaluated them separately from studies that used a multiple‐detector (multi‐headed) system.
These guidelines provide a framework for the assessment of most of the technical aspects of published studies evaluating the use of rCBF SPECT in the characterisation of FTD, with two important provisos. First, published reports do not generally specify how they carried out the study in sufficient detail to allow a complete and impartial judgement of quality to be made. Second, both sets of guidelines tentatively recommend that patient images are compared with those in control databases in order to aid interpretation, but list "database issues" under "issues requiring further clarification". Furthermore, limited specific recommendations are made regarding the demographic and technical aspects of control database comparisons. These recommendations concern the need for age matching and use of the same type of camera and processing methods for both controls and patients. We did not plan to discuss the relative advantages and disadvantages of different analysis methods. No recommendations are made regarding how thresholds for a 'positive' rCBF SPECT scan should be set. It is probably the case that more modern analysis methods utilising multivariate statistics, computationally intensive registration methods and large multicentre control databases are likely to be more accurate than older methods. As both sets of guidelines are recent and make no specific recommendations, we were cautious in making judgements in these areas.
Target conditions
The target condition was FTD, also referred to as frontotemporal lobar degeneration (FTLD). This included bvFTD, PNFA and SD.
Reference standards
We considered a diagnosis of FTD based on any of the following recognised diagnostic criteria as acceptable.
Lund‐Manchester (Lund and Manchester Groups 1994)
Neary criteria (Neary 1998; Appendix 1)
National Institute of Neurological Disorders and Stroke (NINDS) criteria for FTD (McKhann 2001)
Histopathological diagnosis (Mackenzie 2010; Mackenzie 2011)
Presence of a genetic mutation known to be associated with FTD, including the microtubule‐associated protein tau (MAPT), progranulin (GRN), transactive response DNA‐binding protein (TARDBP), valosin‐containing protein (VCP), chromosome 9 open‐reading frame 72 (c9orf72) and charged multivesicular body protein 2B genes (Mahoney 2012).
We considered the diagnosis of 'controls' (i.e. non‐FTD individuals) in case‐control studies as acceptable if standardised definitions of dementia subtypes (usually AD) were used. These included NINCDS‐ADRDA (National Institute of Neurological and Communicative Disorders and Stroke and the Alzheimer's Disease and Related Disorders Association) (McKhann 1984); Consortium to Establish a Registry for Alzheimer's Disease (CERAD) (Mirra 1991); NINDS‐Association Internationale pour la Recherche et l'Enseignement en Neurosciences (AIREN) (Román 1993), Alzheimer's Disease Diagnostic and Treatment Centers (ADDTC) (Chui 1992) and Cambridge Mental Disorders of the Elderly Examination (CAMDEX) criteria (Hendrie 1988). In cohort studies, we accepted all‐cause (unspecified) dementia diagnosed using Diagnostic and Statistical Manual of Mental Disorders, Fourth Edition (DSM‐IV) and ICD‐10 criteria (American Psychiatric Association 2013; WHO 2010).
Search methods for identification of studies
The search strategies detailed in Appendix 2 utilised only two search concepts, keeping the search sensitive. The concepts were (a) the index test and (b) in general and specific terms, the condition of interest.
Electronic searches
The most recent search for this review was performed on 1 June 2013. We searched MEDLINE (Ovid SP) (1950‐01June 2013), EMBASE (Ovid SP) (1980‐31 May 2013), BIOSIS (Ovid SP) (1926‐31 May 2013), PsycINFO (Ovid SP) (1806‐Week 4 May 2013), CINAHL (EBSCO) (1950‐May 2013) and LILACS (Bireme) and the Web of Science Core Collection (ISI Web of Science) (1945‐31 May 2013), including Conference Proceedings Citation Index (Thomson Reuters Web of Science). See Appendix 2 for the search strategies. We used standardised database subject headings such as MeSH (Medical subject heading) terms (in MEDLINE) and Emtree (in EMBASE) and other standardised headings (controlled vocabulary) in other databases, as appropriate. We did not use search filters designed to retrieve diagnostic test accuracy studies (collections of terms aimed at reducing the number needed to screen by filtering out irrelevant records and retaining only those that are relevant) as a method to restrict the search because available filters have not yet proved sensitive enough for systematic review searches (Whiting 2011). We also requested a search of the Cochrane Register of Diagnostic Test Accuracy Studies. A single researcher with extensive experience of systematic reviewing performed the searches. We did not restrict studies based on setting or language.
Searching other resources
We checked the reference lists of all relevant papers for additional studies.
We also searched:
The MEDION Database (Universities of Maastricht and Leuven, www.mediondatabase.nl);
DARE (Database of Abstracts of Reviews of Effects, via the Cochrane Library);
HTA (Health Technology Assessments) database (via the Cochrane Library);
ARIF (Aggressive Research Intelligence Facility, www.arif.bham.ac.uk).
We used the related articles feature in PubMed to search for additional studies. We tracked key studies in citation databases such as Science Citation Index and Scopus to ascertain any further relevant studies. We identified ‘grey’ literature, mainly in the form of conference abstracts, through the Web of Science Core Collection, including Conference Proceedings Citation Index and EMBASE. We aimed to access theses or dissertations from institutions known to be involved in prospective dementia studies. We also attempted to contact researchers involved in relevant studies who might have applicable but unpublished data. We did not perform handsearching as evidence of the benefits of handsearching is uncertain. The findings of a recent study investigating handsearching as a method for identifying diagnostic test accuracy studies suggested little additional benefit for handsearching above a robust initial search strategy in a well‐indexed and clearly defined subject area (Glanville 2010).
We did not search ALOIS for this review as the DTA register in ALOIS is geared towards neuropsychological tests rather than biomarkers or imaging, and therefore was not thought to be applicable to this study.
Data collection and analysis
Selection of studies
Study authors (ANS, EJC, NS, SC, HAA) screened the titles and abstracts of identified studies. Subsequently, we located the full text for each potentially eligible study identified by the search. At least two of three study authors (CJ, EJC, HAA) independently evaluated these papers for inclusion or exclusion, after assessment of the sampling frame of each study. We resolved disagreements by discussion with a third author (SC, NS). We then created a Preferred Reporting Items for Systematic Reviews and Meta‐Analyses (PRISMA) flow diagram (Moher 2009) showing details of the study selection process.
Data extraction and management
We extracted data on study characteristics into a study‐specific form, including data for the assessment of methodological quality and data for the investigation of heterogeneity, as described in Appendix 3. We piloted the form using two of the included studies.
Two review authors (HAA, NS) extracted data from the form. We created 2 x 2 tables by dichotomising the results of rCBF SPECT ('FTD pattern present' or 'FTD pattern absent') and cross‐tabulating them against the results of the reference standard ('FTD present' (disease positive) or 'FTD absent' (disease negative)) used in each study (Table 2). We entered the 2 x 2 tables directly into Review Manager 2013.
1. Cross classification (2 x 2) table of rCBF SPECT results agisting disease status (based on reference standard results).
| rCBF SPECT |
Reference standard (Lund‐Manchester; NINDS; histopathological criteria) |
|
|
FTD present (disease positive) |
FTD absent (disease negative) |
|
|
'FTD pattern' present (test positive) |
True positive | False positive |
|
'FTD pattern' absent (test negative) |
False negative | True negative |
Assessment of methodological quality
We assessed the methodological quality of each study using the QUADAS‐2 (Quality Assessment of Diagnostic Accuracy Studies) tool (Whiting 2011). The tool is made up of four domains: participant selection; index test; reference standard; patient flow (Appendix 4). We assessed each domain in terms of risk of bias, with the first three domains also assessed in terms of applicability concerns. Operational definitions describing our application of the QUADAS‐2 tool are detailed in Appendix 5. We produced a narrative summary describing numbers of studies that were found to have high/low/unclear risk of bias as well as concerns regarding applicability.
In addition to the QUADAS‐2 tool, we assessed the index test using the following broad criteria with regard to study quality.
Visual rating
Was rating carried out by multiple experts blinded to the clinical and/or pathological status of the patient?
Did the raters use well‐defined criteria for assessing scans? Are these criteria explained in sufficient detail to reproduce independently?
Semiquantitative evaluation
If quantitative maps were visually assessed then the two criteria above are applicable
Ideally, scans should be assessed with and without quantitative analysis
Ideally there should be an explanation of the methods used to derive any thresholds used in the computation of quantitative results and the effects of threshold setting on sensitivity and specificity
If normal database comparisons are used, details should be given of normal screening procedures and to what extent demographic matching (e.g. age, sex, education) was achieved
Statistical analysis and data synthesis
We evaluated test accuracy according to target condition and SPECT technology (single‐detector and multiple‐detector camera SPECT). We also considered case‐control and cohort studies separately. We performed exploratory analyses by plotting estimates of sensitivity and specificity from each study on forest plots and in receiver operating characteristic (ROC) space. We planned to perform meta‐analyses by using the bivariate model to obtain average estimates of sensitivity and specificity. However, we were unable to perform meta‐analyses due to heterogeneity in study design, participant selection, the nature of the data available for analyses, reference standard and SPECT methodology.
Investigations of heterogeneity
We planned to investigate the effect of the following factors.
Index test: different image analysis techniques and thresholds; technical features of scanning (e.g. camera resolution, scatter correction, total counts acquired); operator characteristics (e.g. training)
Target disorder: reference standard used; operationalisation of these classifications (e.g. individual clinician/algorithm/consensus group); stage and severity of dementia
Target population: sociodemographic characteristics (age, sex, education); clinical settings; other characteristics (e.g. family history of motor neurone disease)
Study quality: blinding; time between performing rCBF SPECT and reference standard. For cohort (delayed‐verification) studies we also planned to investigate duration of follow up and loss of participants due to withdrawals and those lost to follow up
We investigated heterogeneity through visual examination of forest plots of sensitivities and specificities and summary receiver operating characteristic (SROC) plots. The main sources of heterogeneity were likely to be the criteria used to define the positivity of rCBF SPECT, reference standards, patient sampling and aspects of study quality (particularly inadequate blinding). We were not able to formally assess the effect of each potential source of heterogeneity by using meta‐regression as planned because we did not perform meta‐analyses.
Sensitivity analyses
We did not conduct sensitivity analyses as planned due to insufficient data and because we did not perform meta‐analyses.
Assessment of reporting bias
We did not investigate reporting bias because of current uncertainty about how it operates in test accuracy studies and the inadequacy of existing analytical tools such as funnel plots.
Results
Results of the search
We identified a total of 11,846 records through database searches. After de‐duplication, a small team of assessors (HAA, EJC, CJ) performed a first assessment of the remaining records. The flow diagram (Figure 1 ) shows the flow of studies through the screening and selection process. In total, we assessed 116 studies (92 full‐text papers and 24 abstracts) for eligibility. We included 11 studies and excluded 105 studies. We were unable to extract data for creating 2 x 2 tables from 31 studies (see Characteristics of excluded studies table), three studies were multiple publications and, for ten studies, published abstracts/posters only were available. We excluded the remaining 61 studies because they did not meet the inclusion criteria: i) participants: not those with suspected dementia or not those clinically diagnosed with FTD and other forms of dementia (n = 18); ii) type of study: a review, a book chapter or an editorial letter, exploratory or pathological study (n = 24); iii) index test: not rCBF SPECT using 99mTc‐HMPAO or 99mTc‐ECD tracers (n = 15); iv) papers evaluating rCBF SPECT scan technique (n = 4). We found no additional studies through reference checking, though we obtained usable data for three studies by contacting the authors of the studies (Boutoleau‐Bretonniere 2012; Nagao 2004; Rollin‐Sillaire 2012).
1.
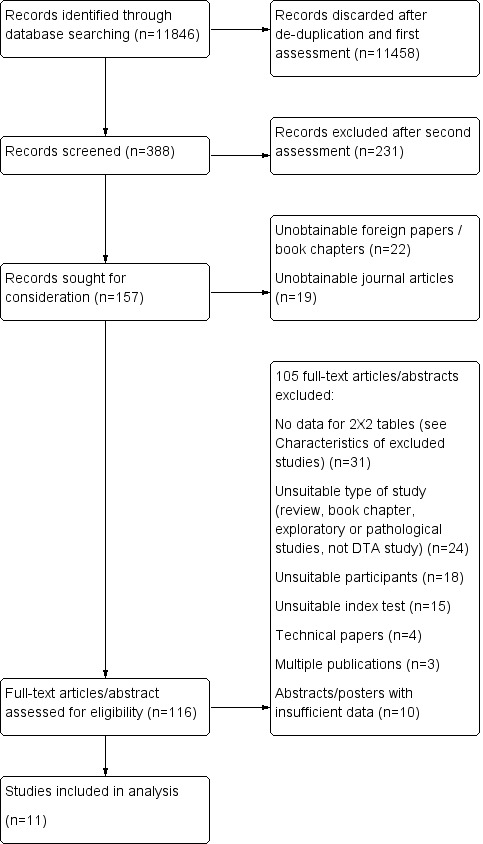
Flow diagram.
Characteristics of included studies
We provide details of the 11 included studies, including 1117 participants (including 299 FTD cases) in the Characteristics of included studies table; we summarise key characteristics of the 11 studies in Table 3. All the studies assessed rCBF SPECT for differentiating FTD from AD, and five of the studies also assessed rCBF SPECT for differentiating FTD from non‐FTD. Four studies (Launes 1991; Pickut 1997; Read 1995; Talbot 1998) were published more than 15 years ago. The remaining seven studies were published in the last 10 years (2004 to 2012). Eight of the studies were conducted in Europe (three in France, two in the UK, one in Finland, one in Belgium and one in Greece), two in the USA and one in Japan.
2. Summary of characteristics of included studies.
|
Author year (country) |
Target population | Study size (number analysed in review) | Sampling procedure | Number of cases (FTD) identified by reference standard | Index test/camera/interpretation/brain hypoperfusion | Reference standard/target condition | Sensitivity | Specificity |
| Prospective cohort studies | ||||||||
| Boutoleau‐ Bretonniere 2012 (France) |
Neurological Memory Center attendees with clinically ambiguous dementias | 69 (19, 29 or 60) | Not reported | 11/60 |
99mTc‐HMPAO SPECT/multiple camera visual/frontal ± temporal |
Clinical diagnosis FTD vs non‐FTD |
8/11 0.73 [0.39.0.94] |
39/49 0.80 [0.66‐0.90] |
| FTD vs AD | 8/11 0.73 [0.39, 0.94] |
17/18 0.94 [0.73, 1.00] |
||||||
| FTD vs VD | 8/11 0.73 [0.39, 0.94] |
6/8 0.75 [0.35, 0.97] |
||||||
| Talbot 1998* (UK) |
Memory clinic attendees with suspected dementia | 363 (158, 212 or 314) | Consecutive | 58 (FTD)/363 80 (FTD & PPA)/363 |
99mTc‐HMPAO SPECT*/single camera/visual/bilateral anterior+ and bilateral anterior & unilateral posterior++ | Clinical diagnosis FTD vs non‐FTD |
21/58 0.36+ [0.24,0.50] |
235/256 0.92+ [0.88, 0.95] |
| FTD vs AD | 37/80 0.46++ [0.35; 0.58] |
127/132 0.96++ [0.91; 0.99] |
||||||
| FTD vs VD | 37/80 0.46++ [0.35, 0.58] |
57/78 0.73++ [0.73, 0.62] |
||||||
| Launes 1991* (Finland) |
Memory clinic attendees with suspected dementia | 160 (41 or 160) | Consecutive | 5/160 | 99mTc‐HMPAO* SPECT/single camera/visual/frontal bilateral or frontal‐temporal | Clinical diagnosis FTD vs non‐FTD |
2/5 0.40 [0.05,0.85] |
147/155 0.95 [0.90, 0.98] |
| FTD vs AD | 2/5 0.40 [0.05, 0.85] |
35/36 0.97 [0.85, 1.00] |
||||||
| FTD vs VD | 2/5 0.40 [0.05, 0.58] |
31/33 0.94 [0.80, 0.99] |
||||||
| Retrospective cohort studies with post‐mortem diagnosis | ||||||||
| Read 1995** (USA) |
AD/FTD/JCD/MID/LBD/hydrocephalus recruited from a chart review of the University‐based speciality dementia clinic | 27 (20 or 27) | Not reported | 7/27 | 99mTc‐HMPAO SPECT/double camera/visual/bilateral frontal | Pathological diagnosis FTD vs non‐FTD |
7/7 1.0 [0.59, 1.00] |
20/20 1.0 [0.83, 1.00] |
| FTD vs AD | 7/7 1.0 [0.59, 1.00] |
13/13 1.0 [0.75, 1.00] |
||||||
| Rollin‐Sillaire 2012 (France) |
AD/DLB/FTD/VD/FTLD/bvFTD/SD/PPA/PSP/ CBD recruited from the caseload database of the University memory clinic | 48 (35 or 48) | Selected from initially consecutive sample | 12/48 |
99mTc‐HMPAO SPECT/multiple camera combined visual and semi‐quantitative/frontal |
Pathological diagnosis FTD vs non‐FTD |
9/12 0.75 0.43, 0.95] |
35/36 0.97 [0.85,1.00] |
| FTD vs AD | 9/12 0.75 [0.43, 0.95] |
23/23 1.0 [0.85, 1.00] |
||||||
| Case‐control studies | ||||||||
| Horn 2007 (France) |
FTD/AD recruited from a number of hospitals | 173 (173) | Not consecutive or random | 91/173 | Tc‐99m ECD SPECT/multiple camera/visual/automatic classifier for whole brain | Clinical diagnosis FTD vs AD |
77/91 0.85 [0.76, 0.91] |
67/82 0.82 [0.72, 0.89] |
| Lipton 2004 (USA) |
FTD/AD. Sources of recruitment not reported | 27 (23) | Not consecutive or random | 6/23 | Xenon or 99mTc‐HMPAO SPECT/multiple camera/combined visual and semiquantitative/global lateralisation | Pathological diagnosis FTD vs AD |
6/6 1.00 [0.54, 1.00] |
7/17 0.41 [0.18, 0.67] |
| McNeill 2007* (UK) |
AD /FTD recruited from a tertiary care centre | 56 (56) | Not consecutive or random | 25/56 | 99mTc‐HMPAO SPECT*/single camera/combined visual and semiquantitative/bifrontal | Pathological diagnosis FTD vs AD |
20/25 0.80 [0.59, 0.93] |
19/31 0.61 [0.42, 0.78] |
| Nagao 2003 (Japan) |
FTD/AD recruited from the Higher Brain Function Clinic for outpatients of the University Hospital + healthy controls (not included in the analysis) | 42 (42) | From data file of initially consecutive sample | 21/42 |
99mTc‐HMPAO SPECT multiple camera semiquantitative/Bifrontal+++ or bifrontal & posterior++++ |
Clinical diagnosis FTD vs AD |
11/21 0.52+++ [0.30; 0.74] |
18/21 0.86+++ [0.64, 0.97] |
| FTD vs AD | 11/21 0.52++++ [0.30, 0.74] |
21/21 1.0++++ [0.62, 0.82] |
||||||
| Pickut 1996 (Belgium) |
FTD/AD recruited from a memory clinic | 40 (40) | Not consecutive or random | 21/40 |
99mTc‐HMPAO SPECT multiple camera combined visual and semiquantitative/frontal and temporal |
Clinical diagnosis FTD vs AD |
17/21 0.81 [0.58, 0.95] |
14/19 0.74 [0.49, 0.91] |
| Valotassiou 2012 (Greece) |
FTLD (bvFTD; lvFTD; PNFA; CBD+PSP)/AD recruited from an outpatient memory clinic of the General Hospital 21 CBD+PSP participants not included in the analysis; they are not the patients with the target condition considered in the review |
112 (59 or 60 or 50) | Consecutive | 20 (bvFTLD)/59 21 (SD)/60 11 (PNFA)/50 |
99mTc‐HMPAO SPECT/multiple camera semiquantitative/brain Broadmann areas |
Clinical diagnosis bvFTD vs AD |
15/20 0.75 [0.51, 0.91] |
31/39 0.79 0.64, 0.91] |
| SD vs AD | 17/21 0.81 [0.58, 0.95] |
20/39 0.51 [0.35, 0.68] |
||||||
| PNFA vs AD | 8/11 0.73 [0.39, 0.94] |
25/39 0.64 0.47, 0.79] |
||||||
N = number of participants in the study; n = number of participants included in the analysis in the review; *Study used a single‐headed camera with no extended acquisition and did not use image analysis; **Study used two cameras but details of total counts can only realistically apply to the brain‐dedicated camera; + bilateral anterior brain hypoperfusion; ++ bilateral anterior & unilateral posterior brain hypoperfusion; +++bifrontal brain hypoperfusion; ++++ bifrontal & posterior brain hypoperfusion; bvFTD = behavioural variant frontotemporal degeneration; CBD = corticobasal degeneration; FTLD = frontotemporal degeneration; JCD = Jakob‐Creutzfeldt Disease; lvFTD = language variant frontotemporal degeneration; MID = mixed dementia; PM = post‐mortem; PPA = primary progressiva aphasia; PNFA = progressive non‐fluent aphasia, PSP = progressive supranuclear palsy; SD = semantic dementia; SPECT = Single photon emission computed tomography; 99mTc‐HMPAO = 99mTc‐hexamethylpropyleneamineoxime
Study sizes ranged from 27 to 363 participants. A range of populations was assessed, with the youngest study population aged between 42 and 69 years (Read 1995), and the oldest study population aged 70.0 ± 9.0 years (mean±standard deviation) (Pickut 1997). APOE e4 (apolipoprotein) carrier status and years of education were poorly reported. Participants were mainly outpatients recruited from University clinics (n = 7) or from a General Hospital memory clinic (n = 1). One study recruited participants from a tertiary referral centre (McNeill 2007). Horn 2007 was a multicentre study and recruited inpatients from a number of hospitals. Lipton 2004 did not report source of recruitment.
Two studies did not specify the criteria used for clinical diagnosis (Horn 2007; Pickut 1997), four used the Neary criteria (Boutoleau‐Bretonniere 2012; Launes 1991; Nagao 2004; Valotassiou 2012), one used the Lund‐Manchester Criteria (Talbot 1998), and four used histopathological confirmation (Lipton 2004; McNeill 2007; Read 1995; Rollin‐Sillaire 2012). Interpretation of SPECT images varied between studies (Table 3): six studies used combined visual and semiquantitative evaluation whereas the remaining five studies used only visual inspection.
Eight studies visually assessed SPECT images but details of the process were poorly reported. Three studies (McNeill 2007; Read 1995; Talbot 1998) used one rater, with one (McNeill 2007) using a second rater to validate the assessment. Three studies (Boutoleau‐Bretonniere 2012; Pickut 1997; Rollin‐Sillaire 2012) used two experts, and one (Horn 2007) used four. One study (Launes 1991) stated that images were "assessed visually" and one (Lipton 2004) used information from past reports. Only one study reported inter‐rater reliability (McNeill 2007).
All 11 studies evaluated brain regions that were expected to be affected by FTD. In these terms, all studies involved frontal and/or temporal lobes. Two studies (Lipton 2004; McNeill 2007) also involved parietal and occipital lobes in their evaluations. One study (Valotassiou 2012) used a range of Broadmann areas (BAs).
Methodological quality of included studies
We present our judgements about each methodological quality item for each included study in the Characteristics of included studies table and Figure 2. We summarise the overall methodological quality of the studies in Figure 3.
2.
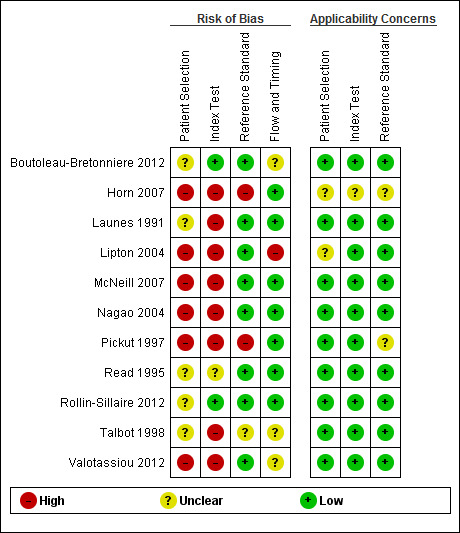
'Risk of bias' and applicability concerns summary: review authors' judgements about each domain for each included study
3.
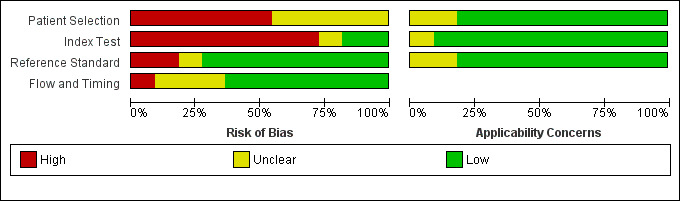
'Risk of bias' and applicability concerns graph: review authors' judgements about each domain presented as percentages across included studies
In the participant selection domain, we considered six studies to be at high risk of bias (Horn 2007; Lipton 2004; McNeill 2007; Nagao 2004; Pickut 1997; Valotassiou 2012), and five studies to be at unclear risk of bias because of poor reporting (Boutoleau‐Bretonniere 2012; Launes 1991; Read 1995; Rollin‐Sillaire 2012; Talbot 1998).
In the index test domain, we considered eight studies to be at high risk of bias because the threshold used was not prespecified and the index test results were interpreted with knowledge of the results of the reference standard, or a single‐headed camera was used (see the Technological considerations section below), or it was poorly reported (Horn 2007; Launes 1991; Lipton 2004; McNeill 2007; Nagao 2004; Pickut 1997; Talbot 1998; Valotassiou 2012). We judged Read 1995 to be at unclear risk of bias because the SPECT methodology was unclear. We judged the remaining two studies (Boutoleau‐Bretonniere 2012; Rollin‐Sillaire 2012) to be at low risk of bias.
In the reference standard domain, we judged the majority of studies (8/11) to be at low risk of bias. We considered Horn 2007 and Pickut 1997 to be at high risk of bias because the reference standard was not specified and it was not clear whether the reference standard results were interpreted without the knowledge of the index test. We judged Talbot 1998 to be at unclear risk of bias because it was not clear whether the assessor who interpreted the results of the reference standard was blind to the results of the index test.
In the flow and timing domain, we considered Lipton 2004 to be at high risk of bias because the index test was not performed in 4 of 10 participants with FTD. We considered three studies (Boutoleau‐Bretonniere 2012; Talbot 1998; Valotassiou 2012) to be at unclear risk of bias because not all participants were included in the analysis. We considered the remaining seven studies to be at low risk of bias.
Regarding the assessment of applicability concerns, our concern that the included participants and setting, the conduct and interpretation of the index test, and the target condition (as defined by the reference standard) did not match the review question was low for the majority of the studies (8/11). We considered concerns regarding applicability to be unclear for Horn 2007 in all three domains, for Pickut 1997 in the reference standard domain and for Lipton 2004 in the participant selection domain.
It should be noted that our low concern about the applicability of the three domains mentioned above was based on the inclusion criteria set in the review. Considering the wide variation in study characteristics, we consider that these judgements about applicability may be overstated. In particular, we consider that the findings from the case‐control studies are unlikely to be directly applicable to our target population of memory clinic attendees, despite recruitment from secondary and tertiary settings. Three of the studies were carried out in memory clinic cohorts but two of these used single‐headed camera SPECT which is no longer used, and therefore not applicable to current practice.
Technological considerations
After technological review of the methods, we found three studies (Launes 1991; McNeill 2007; Talbot 1998) to have used a single‐headed system. From the acquisition details described in the studies by McNeill 2007 and Talbot 1998, we estimated that 2 million counts were acquired for each participant. Launes 1991 did not provide sufficient details for the direct estimation of acquired counts; however, we estimated that a total acquisition time of around 45 minutes would be required to collect the minimum of 5 million counts recommended by the EANM (Kapucu 2009) and SNM (Juni 2009) guidelines. None of these studies used any form of quantitative image analysis. Read 1995 described the use of two SPECT cameras and the protocol followed is unlikely to represent that seen in standard clinical practice.
In our original protocol we described both the EANM and SNM guidelines but felt that, as these guidelines make only general recommendations, we should exercise caution in making judgements about which camera type to use. As such we have not excluded papers that used a single‐headed system from the review but report their findings separately.
Findings
We did not perform meta‐analyses because of substantial differences between studies as outlined above. We therefore present a narrative summary of the studies.
rCBF SPECT for differentiating FTD from non‐FTD
Five studies reported the accuracy of rCBF SPECT for distinguishing FTD from non‐FTD (Figure 4; Figure 5). All the studies used a cohort design; three were prospective (Boutoleau‐Bretonniere 2012; Launes 1991; Talbot 1998) and two were retrospective (with histopathological confirmation) (Read 1995; Rollin‐Sillaire 2012). Read 1995 and Rollin‐Sillaire 2012 both required a SPECT scan at baseline as part of the inclusion criteria and so we consider that there is potential for selection bias.
4.
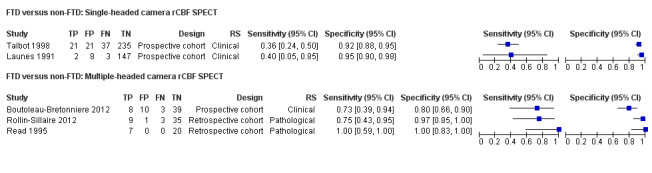
Forest plot of single‐headed and multiple‐headed camera rCBF SPECT for differentiating frontotemporal dementia (FTD) from non‐FTD. The studies are ordered according to study design, reference standard (RS) and sensitivity. TP: true positive; FP: false positive; FN: false negative; TN: true negative; CI: confidence interval.
5.

Summary ROC plot of single‐headed and multiple‐headed camera rCBF SPECT for differentiating frontotemporal dementia (FTD) from non‐FTD. Each symbol represents the sensitivity and specificity of a study. Different colours are used to indicate the two camera types and different symbols are used to indicate study design.
Two of the three prospective studies used single‐headed camera SPECT and reported similar findings. Launes 1991 reported a sensitivity of 0.40 (95% CI 0.05 to 0.85) and a specificity of 0.95 (95% CI 0.90 to 0.98). The sensitivity and specificity reported by Talbot 1998 were 0.36 (95% CI 0.24 to 0.50) and 0.92 (95% CI 0.88 to 0.95), respectively. The remaining three studies used multiple‐headed camera SPECT and reported sensitivities of between 0.73 and 1.00, and specificities of between 0.80 and 1.00.
rCBF SPECT for differential diagnosis of FTD from AD
Six case‐control studies and five cohort studies reported the accuracy of rCBF SPECT for distinguishing FTD from AD (Figure 6; Figure 7). Of the 11 studies, six did not predefine a threshold for determining whether the SPECT image suggested a diagnosis of FTD or AD. Three of the six studies (Pickut 1997; Lipton 2004; Talbot 1998) compared the ability of different combinations of perfusion patterns to correctly assign participants into either an FTD or AD group (based on clinical diagnosis or histopathology). The remaining three studies (Horn 2007; Nagao 2004; Valotassiou 2012) evaluated computer‐defined quantitative imaging to differentiate FTD from other participants with dementia. Of the five studies that predefined thresholds (Boutoleau‐Bretonniere 2012; Launes 1991; McNeill 2007; Read 1995; Rollin‐Sillaire 2012), three (McNeill 2007; Read 1995; Rollin‐Sillaire 2012) compared SPECT image reporting to histopathologically confirmed diagnoses.
6.

Forest plot of single‐headed and multiple‐headed camera rCBF SPECT for differentiating frontotemporal dementia (FTD) from Alzheimer's disease dementia (AD). The studies are ordered according to study design, reference standard (RS) and sensitivity. TP: true positive; FP: false positive; FN: false negative; TN: true negative; CI: confidence interval.
7.

Summary ROC plot of single‐headed and multiple‐headed camera rCBF SPECT for differentiating frontotemporal dementia (FTD) from Alzheimer's disease dementia (AD). Each symbol represents the sensitivity and specificity of a study. Different colours are used to indicate the two camera types and different symbols are used to indicate study design.
Three studies (Launes 1991; McNeill 2007; Talbot 1998) used single‐headed camera SPECT. Two of the studies (Launes 1991; Talbot 1998) were prospective cohort studies in people with dementia attending a memory clinic. Both studies reported much lower sensitivity (0.40 and 0.46, respectively) and higher specificity (0.97 and 0.96, respectively) than the third study (McNeill 2007) which was a case‐control study that reported a sensitivity of 0.80 and specificity of 0.61. Eight studies used multiple‐headed camera SPECT. Of these, five studies used a case‐control design and reported sensitivities of between 0.52 and 1.00, and specificities of between 0.41 and 0.86. The remaining three studies used a cohort design; one was a prospective study (Boutoleau‐Bretonniere 2012) in a selected memory clinic population of 'clinically ambiguous' dementias (i.e. dementias that had not been diagnosed by other means (this is the most common use of SPECT in a clinical setting)), and two were retrospective (Read 1995; Rollin‐Sillaire 2012). The three studies reported sensitivities of between 0.73 and 1.00, and specificities of between 0.94 and 1.00.
rCBF SPECT for differential diagnosis of FTD from VaD
One prospective study evaluated the differentiation of FTD from VaD, with a resultant sensitivity of 73% and specificity of 94% (Boutoleau‐Bretonniere 2012). Two single‐headed camera rCBF SPECT studies (Launes 1991; Talbot 1998) evaluated whether rCBF SPECT could discriminate between FTD and VaD, and reported sensitivities of 40% to 46% and specificities of 73% to 94%.
Investigation of heterogeneity
We were unable to formally investigate heterogeneity because we did not perform meta‐analyses. As can be seen from above, the studies differed widely in design, with several potential sources of heterogeneity. In the Methods section (Investigations of heterogeneity) we outlined four sources: index test, target condition, population and study quality.
The application and interpretation of rCBF SPECT is most likely to represent the largest source of variability between the studies. Studies differed in how rCBF SPECT images were assessed and classified as 'positive' or 'negative' for the presence of FTD. Diagnoses were made based on a prespecified pattern of cerebral hypoperfusion (threshold) (e.g. frontal with or without temporal hypoperfusion), regional scores of severity or through evaluation of historical reports. In some studies no 'threshold' for a positive scan was prespecified. rCBF SPECT images were analysed visually by single or multiple raters or quantitatively using computer programs and could be derived from either one or a variety of different scanners.
Similarly there was variation in how FTD was diagnosed clinically. Some studies used the 'gold standard' of histopathology whereas others used clinical diagnosis using either the Neary or Lund‐Manchester criteria. It is likely that the severity of dementia also varied between studies. However, information on neuropsychological performance was not readily available.
With regards to the study populations, participants were recruited through a variety of means, including prospective recruitment during clinic visits, selection from clinical records or research databases, and retrospective selection based on post‐mortem findings. Some studies compared only individuals with FTD with those with AD, whereas others evaluated rCBF SPECT imaging in cohorts of 'mixed' dementias.
Unfortunately we were not able to formally assess the effect of each potential source of heterogeneity due to the small number of studies available for inclusion in the review.
Figure 5 and Figure 7 show the variation in the sensitivity and specificity of rCBF SPECT for differentiating FTD from non‐FTD or AD by study design and type of camera system. However, each study should be considered individually using the details given in our narrative, Table 3 and the Characteristics of included studies table.
Discussion
The literature on the use of rCBF SPECT for discriminating FTD from other dementias is dominated by case‐control studies, with a paucity of well planned prospective cohort studies. This made it difficult to obtain an average sensitivity and specificity for differentiating FTD from other dementias. As a result we found a wide range of sensitivities and specificities, with sensitivities ranging from as low as 36% in single‐headed camera studies to as high as 100% in multiple‐headed camera studies. The specificity for the same group ranged between 41% and 100%.
Case‐control studies and retrospective cohort studies do not reflect normal clinical practice and are known to produce overestimates of specificity and sensitivity. However, the prospective cohort studies were also limited by methodological considerations. In particular, two of these studies were performed using single‐headed cameras that have gradually been replaced in clinical practice by multiple‐headed gamma cameras. The single‐headed cameras are generally likely to have lower resolution and provide less uniform pictures than those of the multiple‐headed cameras, and are compromised by an inability to boost their performance unlike that of the multiple‐headed forms. As such their findings are likely to be less accurate than those obtained using currently recommended techniques.
In addition to differences in study design, our findings demonstrate that the available literature on rCBF SPECT for detecting FTD is very variable in terms of type and severity of dementia, reference standards and rCBF SPECT methodology. The variation between studies is partly due to the wide range of stated objectives. Some aimed to identify patterns of cerebral hypoperfusion suggestive of FTD (Lipton 2004; Pickut 1997), others sought to develop new quantitative techniques to aid image analysis (Nagao 2004; Valotassiou 2012), whereas only a small number assessed whether a predefined pattern of cerebral blood flow could diagnose FTD from a cohort of 'mixed dementia' participants (Boutoleau‐Bretonniere 2012; Launes 1991; Talbot 1998). Differences in reference standards used will also have contributed a source of heterogeneity, with several studies using histopathological confirmation (considered to be the gold standard for FTD diagnosis) whereas others used variations of the Lund‐Manchester and Neary criteria. As previously discussed, these clinical criteria have limitations in terms of how accurately a diagnosis of FTD can be made, and have led to the production of revised criteria with improved accuracy of diagnosis (Rascovsky 2011).
Our review has demonstrated a wide variation in terms of participant recruitment and data interpretation. On the whole, the amount of detail provided regarding participant identification and assessment was limited. In some studies participant recruitment was achieved from 'chart review' (McNeill 2007) or the searching of 'databases' (Horn 2007; Lipton 2004; Rollin‐Sillaire 2012) or 'data files' (Nagao 2004) for individuals who may have had clinical or histopathological diagnoses of dementia and previous SPECT imaging. Still others recruited participants prospectively and consecutively (Boutoleau‐Bretonniere 2012; Launes 1991; Talbot 1998). In addition, not all studies reported the severity of cognitive impairment in their participants, with neuropsychological assessments used mainly for diagnostic rather than descriptive purposes. It is possible that some SPECT scans may have been carried out early in the disease process whilst others may have been imaged much later, influencing the pattern of cerebral hypoperfusion seen due to changes in brain structure and function related to the underlying neurodegenerative process. Recruitment of participants from mainly secondary or tertiary sources means that the generalisation of these results to the general population is likely to be misleading.
In terms of SPECT scan analysis, there was variation in whether scans were interpreted by one or multiple raters, or whether a previous clinical SPECT report was used. Two studies used consensus reporting, a method not commonly used in day‐to‐day practice (Boutoleau‐Bretonniere 2012; Pickut 1997). Of all the studies, only one reported an inter‐rater reliability measurement with a kappa of 0.48 (McNeill 2007). This study was from the single‐headed camera group. Horn 2007 suggested that the correct classification of images depended on both the experience of the reporter and also on whether the images had come from their own centre. Reproducibility in image reporting is an essential aspect in assessing the utility of this tool, where scans are often reported qualitatively but not quantitatively. It is likely that lack of standardisation in how scans are reported, and questionable reproducibility will lead to less accurate results.
Of all the available studies, Boutoleau‐Bretonniere 2012 most closely mirrors both the participant population and methods commonly seen in clinical practice. Due to the small number of studies, differing protocols and limited applicability to everyday practice it is difficult to make a recommendation on the use of rCBF SPECT in clinical practice based on these results. More prospective cohort studies with delayed verification would be helpful, particularly if verification was also confirmed by histopathological diagnosis.
Summary of main results
This review demonstrates that the currently available literature does not clearly answer the question of whether rCBF SPECT can differentiate FTD from AD and other dementias. The 11 studies included in this review varied widely in terms of their study design (case‐control or cohort), technological methodology (single‐ or multiple‐headed cameras, in how and when thresholds for a scan 'positive' for FTD were determined, how scans were reported and whether this was qualitative or quantitative) and reference standard (clinical or histopathological). The studies differed in their objectives; for example, whether they sought to identify a pattern of cerebral perfusion characteristic of FTD, or aimed to test whether a predefined pattern of cerebral perfusion could correctly identify FTD. These factors, along with the wide range of sensitivities and specificities reported makes the value of rCBF SPECT in FTD uncertain.
Strengths and weaknesses of the review
One study (Boutoleau‐Bretonniere 2012) most closely mirrored the patient population and study design appropriate to evaluate rCBF in clinical practice. In addition, four of the included studies (Lipton 2004; McNeill 2007; Read 1995; Rollin‐Sillaire 2012) were conducted using the gold standard of histopathological diagnosis, which allows a definitive diagnosis to be given and, therefore, allows greater certainty in assessing the accuracy of rCBF SPECT for identifying FTD. Due to the small number of studies designed specifically to address this question, as well as confounding factors in terms of scan acquisition and analysis, it is difficult to draw conclusions regarding how rCBF SPECT compares to clinical diagnosis when histopathological confirmation is available. More studies using histopathology as a reference standard would be helpful.
A weakness of this review is the limited number and variability of the different studies available for review. As we have illustrated, a wide range of recruitment techniques, both retrospective and prospective studies, different cohort composition and sizes have been reported.
It must be noted that several papers from which we extracted data for this review did not have our central objective as their primary aim. Furthermore, we have not been able to assess the impact that differing methods of analysis (qualitative ‐ single‐/multirater ‐ or quantitative) have on sensitivity and specificity, and it is not clear whether the accuracy of the diagnosis depends on the patterns of hypometabolism per se or on the measurement or interpretation of this pattern.
These results are unlikely to be generalisable to a memory clinic setting. The majority of studies evaluated the use of rCBF SPECT in isolation to diagnose FTD, but this does not represent how this technique is used in clinical practice. We have been unable to answer whether, when this technique is used within a clinical context as suggested by Rascovsky 2011, the sensitivity and specificity of a diagnosis of FTD improves. Our review suggests that there is inadequate literature available at present to address this question.
Applicability of findings to the review question
Our findings highlight the need for further studies in this area. In particular, protocols should be standardised, study populations well described, thresholds for 'abnormal' scans predefined and clear details given on how scans are analysed.
Authors' conclusions
Implications for practice.
At present we can not make any recommendations for the use of rCBF SPECT in the diagnosis of FTD on the basis of our findings.
Implications for research.
Further research using predetermined patterns of cerebral hypoperfusion in large prospectively followed cohorts of individuals with mixed dementia is required to evaluate the sensitivity and specificity of rCBF SPECT for detecting FTD. It would be useful to compare the diagnostic accuracy of a combination of clinical information and rCBF SPECT to a combination of clinical information and another neuroimaging modality (such as MRI). For clinically applicable research, a cohort of memory clinic patients could be selected for SPECT on the basis of their clinical history and equivocal neuroimaging. Delayed verification could be used to confirm the diagnosis at a later date through either future clinical evaluation or post mortem. It is essential that measurements of intra‐ and inter‐rater reliability are reported to allow a judgement to be made on how reproducible these findings may be in everyday practice. Standardisation of the interpretation of images between centres would also be very useful.
Acknowledgements
The authors would like to thank Anna Noel‐Storr, Trials Search Co‐ordinator of the Cochrane Dementia and Cognitive Improvement Group, for her assistance with writing the search strategy, searching and initial screening of search results.
Appendices
Appendix 1. Classification of dementia
WHO ICD‐10
Dementia
G1. Evidence of each of the following:
-
(1) A decline in memory, which is most evident in the learning of new information, although in more severe cases the recall of previously learned information may be also affected. The impairment applies to both verbal and non‐verbal material. The decline should be objectively verified by obtaining a reliable history from an informant, supplemented, if possible, by neuropsychological tests or quantified cognitive assessments. The severity of the decline, with mild impairment as the threshold for diagnosis, should be assessed as follows:
Mild: a degree of memory loss sufficient to interfere with everyday activities, though not so severe as to be incompatible with independent living. The main function affected is the learning of new material. For example, the individual has difficulty in registering, storing and recalling elements in daily living, such as where belongings have been put, social arrangements, or information recently imparted by family members.
Moderate: a degree of memory loss which represents a serious handicap to independent living. Only highly learned or very familiar material is retained. New information is retained only occasionally and very briefly. The individual is unable to recall basic information about where he lives, what he has recently been doing, or the names of familiar persons.
Severe: a degree of memory loss characterised by the complete inability to retain new information. Only fragments of previously learned information remain. The subject fails to recognise even close relatives.
-
(2) A decline in other cognitive abilities characterised by deterioration in judgement and thinking, such as planning and organising, and in the general processing of information. Evidence for this should be obtained when possible from interviewing an informant, supplemented, if possible, by neuropsychological tests or quantified objective assessments. Deterioration from a previously higher level of performance should be established. The severity of the decline, with mild impairment as the threshold for diagnosis, should be assessed as follows:
Mild: the decline in cognitive abilities causes impaired performance in daily living, but not to a degree making the individual dependent on others. More complicated daily tasks or recreational activities cannot be undertaken.
Moderate: the decline in cognitive abilities makes the individual unable to function without the assistance of another in daily living, including shopping and handling money. Within the home, only simple chores are preserved. Activities are increasingly restricted and poorly sustained.
Severe: the decline is characterised by an absence, or virtual absence, of intelligible ideation. The overall severity of the dementia is best expressed as the level of decline in memory or other cognitive abilities, whichever is the more severe (e.g. mild decline in memory and moderate decline in cognitive abilities indicate a dementia of moderate severity).
-
G2. Preserved awareness of the environment during a period of time long enough to enable the unequivocal demonstration of G1. When there are superimposed episodes of delirium the diagnosis of dementia should be deferred.
G3. A decline in emotional control or motivation, or a change in social behaviour, manifest as at least one of the following:
emotional lability;
irritability;
apathy;
coarsening of social behaviour.
G4. For a confident clinical diagnosis, G1 should have been present for at least six months; if the period since the manifest onset is shorter, the diagnosis can only be tentative.
Comments: The diagnosis is further supported by evidence of damage to other higher cortical functions, such as aphasia, agnosia, apraxia.
Judgements about independent living or the development of dependence (upon others) need to take account of the cultural expectation and context.
Dementia is specified here as having a minimum duration of six months to avoid confusion with reversible states with identical behavioural syndromes, such as traumatic subdural haemorrhage (S06.5), normal pressure hydrocephalus (G91.2) and diffuse or focal brain injury (S06.2 and S06.3).
Neary criteria for behavioural variant of frontotemporal dementia
-
I. Core diagnostic features
A. Insidious onset and gradual progression
B. Early decline in social interpersonal conduct
C. Early impairment in regulation of personal conduct
D. Early emotional blunting
E. Early loss of insight
-
II. Supportive diagnostic features
-
A. Behavioural disorder
1. Decline in personal hygiene and grooming
2. Mental rigidity and inflexibility
3. Distractibility and impersistence
4. Hyperorality and dietary changes
5. Perseverative and stereotyped behaviour
6. Utilisation behaviour
-
B. Speech and language
-
1. Altered speech output
a. Aspontaneity and economy of speech
b. Press of speech
2. Stereotypy of speech
3. Echolalia
4. Perseveration
5. Mutism
-
-
C. Physical signs
1. Primitive reflexes
2. Incontinence
3. Akinesia, rigidity, and tremor
4. Low and labile blood pressure
-
D. Investigations
1. Neuropsychology: significant impairment on frontal lobe tests in the absence of severe amnesia, aphasia, or perceptuospatial disorder
-
2. Electroencephalography (EEG): normal on conventional EEG despite clinically evident dementia
3. Brain imaging (structural and/or functional): predominant frontal and/or anterior temporal abnormality
Appendix 2. Search strategies
| Source | Search strategy | Hits retrieved |
| 1. MEDLINE In‐process and other non‐indexed citations and MEDLINE 1950‐present (Ovid SP) | 1. Tomography, Emission‐Computed, Single‐Photon/ or Tomography, Emission‐Computed/ 2. SPECT.ti,ab. 3. SPET.ti,ab. 4. single photon emission tomography.ti,ab. 5. single photon emission computed tomography.ti,ab. 6. "SPECT/CT".ti,ab. 7. or/1‐6 8. exp Dementia/ 9. Delirium/ 10. Delirium, Dementia, Amnestic, Cognitive Disorders/ 11. dement*.ti,ab. 12. alzheimer*.ti,ab. 13. (lewy* adj2 bod*).ti,ab. 14. (chronic adj2 cerebrovascular).ti,ab. 15. ("organic brain disease" or "organic brain syndrome").ti,ab. 16. "benign senescent forgetfulness".ti,ab. 17. (cerebr* adj2 deteriorat*).ti,ab. 18. (cerebral* adj2 insufficient*).ti,ab. 19. (pick* adj2 disease).ti,ab. 20. "Frontotemporal lobar degeneration".ti,ab. 21. "progressive non‐fluent aphasia".ti,ab. 22. "primary progressive aphasia".ti,ab. 23. (FTD or FTLD).ti,ab. 24. Frontotemporal Lobar Degeneration/ 25. Primary Progressive Nonfluent Aphasia/ 26. Aphasia, Primary Progressive/ 27. or/8‐26 28. 7 and 27 29. (animals not (humans and animals)).sh. 30. 28 not 29 31. (2012* or 2013*).ed. 32. 30 and 31 |
July 2012: 2387 June 2013: 161 |
| 2. EMBASE 1980‐2013 June 21 (Ovid SP) |
1. single photon emission computer tomography/ 2. SPECT.ti,ab. 3. SPET.ti,ab. 4. single photon emission tomography.ti,ab. 5. single photon emission computed tomography.ti,ab. 6. ("99mTc‐SPECT" or "99mTc SPECT" or "99mTc SPECT/CT").ti,ab. 7. or/1‐6 8. dementia/ 9. delirium/ 10. dement*.ti,ab. 11. alzheimer*.ti,ab. 12. (lewy* adj2 bod*).ti,ab. 13. (chronic adj2 cerebrovascular).ti,ab. 14. ("organic brain disease" or "organic brain syndrome").ti,ab. 15. "benign senescent forgetfulness".ti,ab. 16. (cerebr* adj2 deteriorat*).ti,ab. 17. (cerebral* adj2 insufficient*).ti,ab. 18. (pick* adj2 disease).ti,ab. 19. "Frontotemporal lobar degeneration".ti,ab. 20. "progressive non‐fluent aphasia".ti,ab. 21. "primary progressive aphasia".ti,ab. 22. (FTD or FTLD).ti,ab. 23. frontotemporal dementia/ 24. progressive nonfluent aphasia/ 25. primary progressive aphasia/ 26. or/8‐25 27. 7 and 26 28. (2012* OR 2013*).em. 29. 27 and 28 |
July 2012: 3439 June 2013: 426 |
| 3. PSYCINFO 1806‐July week 1 2012 (Ovid SP) |
1. SPECT.mp. 2. SPET.mp. 3. single photon emission tomography.ti,ab. 4. single photon emission computed tomography.ti,ab. 5. ("99mTc‐SPECT" or "99mTc SPECT" or "99mTc SPECT/CT").ti,ab. 6. or/1‐5 7. exp Dementia/ 8. Delirium/ 9. dement*.ti,ab. 10. alzheimer*.ti,ab. 11. (lewy* adj2 bod*).ti,ab. 12. (chronic adj2 cerebrovascular).ti,ab. 13. ("organic brain disease" or "organic brain syndrome").ti,ab. 14. "benign senescent forgetfulness".ti,ab. 15. (cerebr* adj2 deteriorat*).ti,ab. 16. (cerebral* adj2 insufficient*).ti,ab. 17. (pick* adj2 disease).ti,ab. 18. "Frontotemporal lobar degeneration".ti,ab. 19. "progressive non‐fluent aphasia".ti,ab. 20. "primary progressive aphasia".ti,ab. 21. (FTD or FTLD).ti,ab. 22. or/7‐21 23. 6 and 22 24. 2012*.up. or 2013*.up. 25. 23 and 24 |
July 2012: 657 June 2013: 76 |
| 4. Biosis previews 1926 to present (ISI Web of Knowledge) | Topic=(SPECT OR SPET OR "single photon emission tomography" OR "single photon emission computed tomography" OR "99mTc‐SPECT" OR "99mTc SPECT" OR "99mTc SPECT/CT") AND Topic=(dement* OR alzheimer* OR FTLD OR FTD OR "primary progressive aphasia" OR "progressive non‐fluent aphasia" OR "frontotemporal lobar degeneration" OR "frontolobar degeneration" OR "frontal lobar degeneration" OR "pick* disease" OR "lewy bod*") Timespan=All Years. Databases=BIOSIS Previews. Lemmatization=On |
July 2012: 1691 June 2013: 77 |
| 5. Web of Science and conference proceedings (1945‐present) | Topic=(SPECT OR SPET OR "single photon emission tomography" OR "single photon emission computed tomography" OR "99mTc‐SPECT" OR "99mTc SPECT" OR "99mTc SPECT/CT") AND Topic=(dement* OR alzheimer* OR FTLD OR FTD OR "primary progressive aphasia" OR "progressive non‐fluent aphasia" OR "frontotemporal lobar degeneration" OR "frontolobar degeneration" OR "frontal lobar degeneration" OR "pick* disease" OR "lewy bod*") Timespan=records processed from 2011‐07‐01 ‐ 2013‐06‐23. Databases=SCI‐EXPANDED, SSCI, A&HCI, CPCI‐S, CPCI‐SSH, BKCI‐S, BKCI‐SSH. Lemmatization=On |
July 2012: 2556 June 2013: 276 |
| 6. LILACS (BIREME) | demências OR dementia OR dementias OR demência OR Alzheimer OR Alzheimers OR Alzheimer’s OR cognitive OR cognitive OR cognitive OR cognition OR "déficit cognitive" OR cognición OR cognição OR Memória OR memory OR Memoria OR "frontotemporal lobar degeneration" OR "degeneração lobar frontotemporal" OR FTLD OR FTD OR "pick’s disease" OR "primary progressive aphasia" [Words] and 99mTc‐HmPAO OR SPECT OR "Single photon emission computerized tomography" OR SPET OR "Single photon emission tomography" OR "tomografía computarizada de emisión de fotón único" [Words] and 2012 OR 2013 [Country, year publication] | July 2012: 98 June 2013: 2 |
| TOTAL before de‐duplication | July 2012: 10828 June 2013: 1018 |
|
| TOTAL after de‐dupe and first‐assess | July 2012: 302 June 2013: 86 |
|
Appendix 3. Information for extraction to proforma
Bibliographic details of primary paper:
Author, title of study, year and journal
Details of index test:
Method of [index test] administration, including who administered and interpreted the test, and their training
Thresholds used to define positive and negative tests
Reference standard:
Reference standard used
Method of [reference standard] administration, including who administered the test and their training
Study population:
Number of subjects
Age
Gender
Other characteristics, e.g. Apolipoprotein E (APOE) genotype
Settings: i) community; ii) primary care; iii) secondary care outpatients; iv) secondary care inpatients and residential care
Participant recruitment
Sampling procedures
Time between index test and reference standard
Proportion of people with dementia in sample
Subtype and stage of dementia if available
MCI (mild cognitive impairment) definition used (if applicable)
Duration of follow‐up in delayed verification studies
Attrition and missing data
Appendix 4. Assessment of methodological quality QUADAS‐2 tool
| DOMAIN | PATIENT SELECTION | INDEX TEST | REFERENCE STANDARD | FLOW AND TIMING |
| Description | Describe methods of patient selection; describe included patients (prior testing, presentation, intended use of index test and setting) | Describe the index test and how it was conducted and interpreted | Describe the reference standard and how it was conducted and interpreted | Describe any patients who did not receive the index test(s) and/or reference standard or who were excluded from the 2 x 2 table (refer to flow diagram); describe the time interval and any interventions between index test(s) and reference standard |
| Signalling questions (yes/no/unclear) | Was a consecutive or random sample of patients enrolled? | Were the index test results interpreted without knowledge of the results of the reference standard? | Is the reference standard likely to correctly classify the target condition? | Was there an appropriate interval between index test(s) and reference standard? |
| Was a case‐control design avoided? | If a threshold was used, was it prespecified? | Were the reference standard results interpreted without knowledge of the results of the index test? | Did all patients receive a reference standard? | |
| Did the study avoid inappropriate exclusions? | Did all patients receive the same reference standard? | |||
| Were all patients included in the analysis? | ||||
| Risk of bias: high/low/unclear |
Could the selection of patients have introduced bias? | Could the conduct or interpretation of the index test have introduced bias? | Could the reference standard, its conduct, or its interpretation have introduced bias? | Could the patient flow have introduced bias? |
| Concerns regarding applicability: high/low/unclear |
Are there concerns that the included patients do not match the review question? | Are there concerns that the index test, its conduct, or interpretation differ from the review question? | Are there concerns that the target condition as defined by the reference standard does not match the review question? | ‐ |
Appendix 5. Anchoring statements for methodological quality assessment using the QUADAS‐2 tool
| Question | Judgement | Explanation |
| Patient selection | ||
| Was the sampling method appropriate? | No = high risk of bias Yes = low risk of bias Unclear = unclear risk of bias |
Where sampling was used, the designs least likely to cause bias are consecutive sampling or random sampling. Sampling based on volunteers or selecting subjects from a clinic or research resource is prone to bias. |
| Was a case‐control or similar design avoided? | No = high risk of bias Yes = low risk of bias Unclear = unclear risk of bias |
Designs similar to a case‐control design the may introduce bias are those designs where the study team deliberately increase or decrease the proportion of subjects with the target condition, which may not be representative. Some case‐control methods may already be excluded if they mix subjects from various settings. |
| Are exclusion criteria described and appropriate? | No = high risk of bias Yes = low risk of bias Unclear = unclear risk of bias |
Study will be automatically graded as unclear if exclusions are not detailed (pending contact with study authors). Where exclusions are detailed, the study will be graded as 'low risk' if exclusions are felt to be appropriate by the review authors. Certain exclusions common to many studies of dementia are: medical instability; terminal disease; alcohol/substance misuse; concomitant psychiatric diagnosis; other neurodegenerative condition. Exclusions are not felt to be appropriate if 'difficult to diagnose' patients are excluded. Post hoc and inappropriate exclusions will be labelled 'high risk' of bias. |
| Index test | ||
| Was rCBF SPECT assessment/interpretation performed without knowledge of reference standard? | No = high risk of bias Yes = low risk of bias Unclear = unclear risk of bias |
Terms such as "blinded" or "independently and without knowledge of" are sufficient and full details of the blinding procedure are not required. Interpretation of the results of the index test may be influenced by knowledge of the results of reference standard. If the index test is always interpreted prior to the reference standard then the person interpreting the index test cannot be aware of the results of the reference standard and so this item could be rated as 'yes'. |
| Were rCBF SPECT thresholds prespecified? | No = high risk of bias Yes = low risk of bias Unclear = unclear risk of bias |
For scales and biomarkers there is often a reference point (in units or categories) above which subjects are classified as 'test positive'; this may be referred to as a threshold, clinical cut‐off or dichotomisation point. A study is classified as at high risk of bias if the authors define the optimal cut‐off post‐hoc based on their own study data because selecting the threshold to maximise sensitivity, specificity or both may lead to overoptimistic measures of test performance. Certain papers may use an alternative methodology for analysis that does not use thresholds and these papers should be classified as not applicable. |
| Reference standard | ||
| Is the assessment used for clinical diagnosis of FTD acceptable? | No = high risk of bias Yes = low risk of bias Unclear = unclear risk of bias |
Ante‐mortem clinical diagnosis of FTD will be based on recognised diagnostic criteria, Lund and Manchester Groups 1994 or Neary 1998 or McKhann 2001 criteria (as previously outlined) or histopathological diagnosis and/or genetic mutation known to be causative of FTD (if available). For other types of dementia potentially used to define control groups in our review, clinical diagnoses of dementia will include all‐cause (unspecified) dementia, using any recognised diagnostic criteria, for example DSM‐IV and ICD‐10 (American Psychiatric Association 2013; WHO 2010). NINCDS‐ADRDA (National Institute of Neurological and Communicative Disorders and Stroke and the Alzheimer's Disease and Related Disorders Association) criteria are the most accepted ante‐mortem clinical consensus gold standard for Alzheimer's dementia (McKhann 1984), defining three ante‐mortem groups: 'probable', 'possible' and 'unlikely' Alzheimer's dementia. The Consortium to Establish a Registry for Alzheimer's Disease (CERAD) (Mirra 1991), ICD10 and DSM‐IV definitions of AD are also acceptable. National Institute of Neurological Disorders and Stroke‐Association Internationale pour la Recherche et l'Enseignement en Neurosciences (NINDS‐AIREN) (Román 1993), Alzheimer’s Disease Diagnostic and Treatment Centers (ADDTC) (Chui 1992), DSM‐IV, ICD‐10, and the Cambridge Mental Disorders of the Elderly Examination (CAMDEX) criteria (Hendrie 1988) are all acceptable for the diagnosis of vascular dementia (VD). Where the criteria used for assessment are not familiar to the review authors or to the Cochrane Dementia and Cognitive Improvement Group ('unclear') this item should be classified as at high risk of bias. |
| Was clinical assessment for FTD performed without knowledge of the rCBF SPECT biomarker? | No = high risk of bias Yes = low risk of bias Unclear = unclear risk of bias |
Terms such as "blinded" or "independently and without knowledge of" are sufficient and full details of the blinding procedure are not required. Interpretation of the results of the reference standard may be influenced by knowledge of the results of index test. |
| Patient flow | ||
| Was there an appropriate interval between rCBF SPECT and clinical assessment? | No = high risk of bias Yes = low risk of bias Unclear = unclear risk of bias |
For cross‐sectional case‐control studies the index test and application of the reference standard are ideally administered on the same day, but a delay is unlikely to introduce bias as the condition of dementia is irreversible. For longitudinal studies, the time between reference standard and index test will influence the accuracy (Geslani 2005; Okello 2009; Visser 2006), and therefore we will note time as a separate variable (both within and between studies) and will test its influence on the diagnostic accuracy. We have set a minimum mean time to follow‐up assessment of one year for longitudinal cohort (delayed verification) studies. |
| Did all subjects get the same assessment for dementia regardless of rCBF SPECT result? | No = high risk of bias Yes = low risk of bias Unclear = unclear risk of bias |
There may be scenarios where subjects who score 'test positive' on the index test have a more detailed assessment. Where dementia assessment (i.e. reference standard) differs between groups of subjects this should be classified as at high risk of bias. |
| Were all patients who received rCBF SPECT assessment included in the final analysis? | No = high risk of bias Yes = low risk of bias Unclear = unclear risk of bias |
If the number of patients enrolled differs from the number of patients included in the 2 x 2 table then there is the potential for bias. If participant data missing due to drop‐out differ systematically from those for the remaining participants, then estimates of test performance may differ. If drop‐outs occur these should be accounted for; a maximum proportion of drop‐outs has been specified as 20% in order to be scored as low risk of bias, but this will depend upon length of follow up in longitudinal cohort studies. |
| Were missing or uninterpretable rCBF SPECT results reported? | No = high risk of bias Yes = low risk of bias Unclear = unclear risk of bias |
Where missing or uninterpretable results are reported, and if there is substantial attrition (we have set an arbitrary value of 50% missing data), this should be scored as at high risk of bias. If these results are not reported, this should be scored as 'unclear' and authors will be contacted. |
| Anchoring statements to assist with assessment of applicability | ||
| Question | Explanation | |
| Were included patients representative of the general population of interest? | The included patients should match the intended population as described in the review question. The review authors should consider population in terms of symptoms; pre‐testing; potential disease prevalence; setting. If there are clear grounds for suspecting an unrepresentative spectrum the item should be rated 'poor applicability'. |
|
| Index test | ||
| Were sufficient data on rCBF SPECT application given for the test to be repeated in an independent study? | Variation in technology, test execution, and test interpretation may affect estimate of accuracy. In addition, the background and training/expertise of the assessor should be reported and taken into consideration. If the rCBF SPECT biomarker was not performed consistently this item should be rated 'poor applicability'. | |
| Reference standard | ||
| Was clinical diagnosis of dementia made in a manner similar to current clinical practice? | For many reviews, clinical diagnosis of dementia will be made using standard clinical criteria. For certain reviews an applicability statement relating to reference standard may not be applicable. There is the possibility that a current reference standard, although valid, may diagnose a far smaller proportion of subjects with disease than in usual clinical practice. In this instance the item should be rated 'poor applicability'. | |
rCBF= regional cerebral blood flow; SPECT= single‐photon emission computerised tomography; FTD=frontotemporal dementia; DSM‐IV= DSM=Diagnostic and Statistical Manual of Mental Disorders‐IV; ICD‐10=International Classificatio of Diseases‐10
Review question and inclusion criteria
| Category | Review question | Inclusion criteria |
| Participants | Participants with suspected FTD (Primary Objective 1) |
Participants fulfilling the criteria for the clinical diagnosis of any forms of dementia in secondary and tertiary care setting |
| Index test | rCBF SPECT biomarker | rCBF SPECT biomarker |
| Target condition | Frontotemporal dementia (FTD) |
Initial diagnosis of FTD Differential diagnosis of FTD from other dementia subtypes |
| Reference standard | Diagnosis of FTD as determined by the Manchester‐Lund or NINDS criteria, histopathological confirmation of diagnosis and/or genetic mutation known to be causative of FTD (if available) |
Diagnosis of FTD as determined by the Manchester‐Lund or NINDS criteria, histopathological confirmation of diagnosis and/or genetic mutation known to be causative of FTD (if available) NINCDS‐ADRDA criteria are the most accepted ante‐mortem clinical consensus gold standard for Alzheimer's dementia, defining three ante‐mortem groups: 'probable', 'possible' and 'unlikely' Alzheimer's dementia. CERAD, ADDTC, ICD‐10 and DSM‐IV definitions of ADD were also acceptable. NINDS‐AIREN, ADDTC, DSM‐IV, ICD‐10, CAMDEX criteria were acceptable for VaD |
| Outcome | N/A | Data to construct 2 x 2 table |
| Study design | N/A | Longitudinal cohort studies and nested case‐control studies if they incorporate a delayed‐verification design (case‐control nested in cohort studies) (Objectives) Cross‐sectional studies in which: i) rCBF SPECT results and the clinical diagnostic criteria were obtained within a narrow time‐frame, and ii) FTD patients were differentiated from patients with other dementia subtypes |
In assessing individual items, the assessment of 'unclear' should be given only if there is genuine uncertainty. In these situations review authors will contact the relevant study teams for additional information.
FTD = frontotemporal dementia; rCBF=; SPECT=; NINDS = National Institute of Neurological Disorders and Stroke; NINCDS‐ADRDA=National Institute of Neurological and Communicative Disorders and Stroke and the Alzheimer's Disease; CERAD=; ADDTC=ICD‐10; DSM‐IV=; ADD=Alzheimer's disease dementia; NINDS‐AIREN=; CAMDEX=; VaD=vascular dementia;
Data
Presented below are all the data for all of the tests entered into the review.
Tests. Data tables by test.
| Test | No. of studies | No. of participants |
|---|---|---|
| 1 FTD versus non‐FTD: Single‐headed camera rCBF SPECT | 2 | 474 |
| 2 FTD versus non‐FTD: Multiple‐headed camera rCBF SPECT | 3 | 135 |
| 3 FTD versus AD: Single‐headed camera rCBF SPECT | 3 | 309 |
| 4 FTD versus AD: Multiple‐headed camera rCBF SPECT | 8 | 421 |
1. Test.
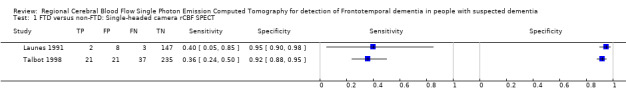
FTD versus non‐FTD: Single‐headed camera rCBF SPECT.
2. Test.
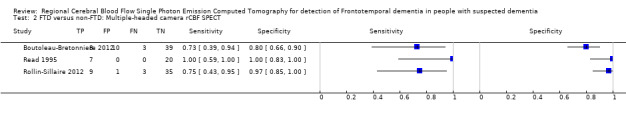
FTD versus non‐FTD: Multiple‐headed camera rCBF SPECT.
3. Test.
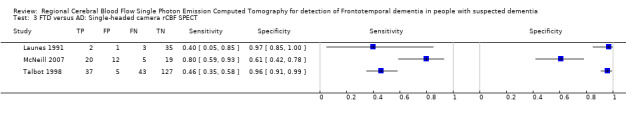
FTD versus AD: Single‐headed camera rCBF SPECT.
4. Test.
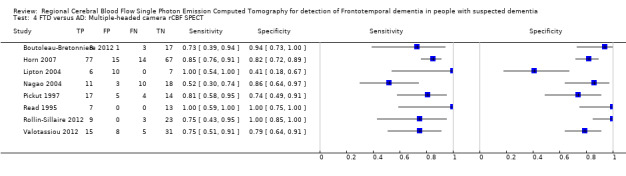
FTD versus AD: Multiple‐headed camera rCBF SPECT.
Characteristics of studies
Characteristics of included studies [ordered by study ID]
Boutoleau‐Bretonniere 2012.
| Study characteristics | |||
| Patient sampling | Patients attending the Neurological Memory Center at Nantes University Hospital were enrolled prospectively over a period of 36 months (2004 to 2007) to a longitudinal study. The sampling procedure not reported. The exclusion criteria included: major depressive disorders, probable AD dementia, FTD, VaD, LBD, Parkinson's disease, rapidly progressing dementia, neoplastic, inflammatory, infectious or metabolic disease, and contraindications to SPECT or MRI imaging. |
||
| Patient characteristics and setting | Ninety‐one participants with clinically ambiguous dementia (CAD) were screened. Fourteen participants did not fulfil inclusion criteria and eight refused to participate in the study. 69 participants were recruited after neuropsychological assessment, CSF sampling, MRI and SPECT and prospectively followed up. At baseline, patients were examined both by a neurologist and a neuropsychologist for eligibility according to the CAD criteria: 1) dementia according to DSM‐IV criteria; 2) cognitive changes of moderate severity (MMSE ≥18); 3) clinical symptoms at inclusion not fulfilling existing criteria for frontotemporal dementia (FTD) (Neary 1998), vascular dementia (Román 1993), progressive supranuclear palsy/corticobasal degeneration spectrum (Gibb 1989; Litvan 1996), Parkinson's disease, and Lewy body disease (Hughes 2001; McKeith 2005), 4) presence of ≥1 atypical feature for AD listed in criteria III to V of NINCDS‐ADRDA criteria (i.e. early and prominent neuropsychiatric symptoms, early gait disturbances, focal neurological findings, systemic or brain disorder sufficient to produce dementia which is not considered to be the cause of the dementia). Demographic data reported on 60 participants who had follow‐up assessment: Gender: 23 F, 37 M (FTD: 4 F; 7 M; AD: 9 F, 9 M; VaD: 3 F; 5 M) Age (mean±SD years): 63.9 ± 9.4 (FTD: 68.6 ± 5.4; AD: 65.2 ± 9.4; VaD: 62.6 ± 9.0) MMSE (mean±SD): 22.3 ± 3.5 (FTD: 22.5 ± 3.6; AD: 21.1 ± 3.8; VaD: 23.6 ± 1.9) Education: 23/60 graduated (FTD: 3/11, AD: 9/9 and VaD: 2/8 graduated) Sources of referral: patients were referred by neurologists or general practitioners Sources of recruitment: Neurological Memory Center, University Hospital, Nantes, France |
||
| Index tests |
99mTc‐HMPAO SPECT 99mTc‐HMPAO fixation was analysed regionally for frontal, parietal, temporal and occipital regions on the left and right. According to the pattern of 99mTc‐HMPAO fixation, results were classified in four categories:
Threshold: prespecified; visual interpretation of the SPECT images Two of the authors that were not implicated in patient care and blind to all clinical data analysed SPECT |
||
| Target condition and reference standard(s) | Target condition: FTD (differential diagnosis of FTD versus 1. AD dementia and 2. VaD dementia) Reference standards: Neary 1998. The clinical diagnosis of Alzheimer’s disease dementia and VaD dementia were established by the NINCDS‐ADRDA (McKeith 2005) and NINDS‐AIREN (Román 1993) criteria, respectively. Clinicians were unaware of SPECT pattern (p325) |
||
| Flow and timing |
Duration of follow up: 24 months At baseline 69 participants At follow up (table 3, p328 & information from the author): 60 participants were assessed by neuropsychological tests and MRI and included in analysis 11 FTD: 8 FTD type SPECT (TP = 8); 3 AD type (FN = 3) 18 AD: 1 FTD type SPECT (FP = 1); 17 AD type (TN = 17) 8 VD: 2 FTD type SPECT (FP = 2); 3 AD type and 2 ‘other’ (TN = 6) 4 other dementia: 1 AD type + 3 ‘other’ (TN = 4) 12 unclassified: 4 with FTD type SPECT (FP = 4); 8 non‐ FTD type SPECT (TN = 8) 7 Psych: 3 with FTD type SPECT (FP=3); 4 non‐ FTD type SPECT (TN = 4) 1) SPECT FTD type pattern indicative of FTD (N = 60) FTD = 11 (disease positive); non‐FTD = 49 (disease negative) TP = 8, FP = 10, FN = 3, TN = 39; Sensitivity = 73%; Specificity = 80% (calculated in RevMan5) 2) FTD vs AD (N = 29) FTD = 11 (disease positive); AD = 18 (disease negative) TP = 8, FP = 1, FN = 3, TN = 17; Sensitivity = 73%; Specificity = 94% (calculated in RevMan5) 3) FTD vs VaD (N = 19) FTD = 11 (disease positive); VaD = 8 (disease negative) TP = 8, FP = 2, FN = 3, TN = 6; Sensitivity = 73%; Specificity = 75% (calculated in RevMan5) Lost to follow up: Nine patients withdrew from the study (6 were lost to follow up and 3 died) All patients that had a follow‐up assessment were included in the analysis |
||
| Comparative | |||
| Notes | The trial investigators were contacted; they provided some requested data tor the 2 x 2 table to be completed; email from Dr Boutoleau‐Bretonniere on 25/3/14 | ||
| Methodological quality | |||
| Item | Authors' judgement | Risk of bias | Applicability concerns |
| DOMAIN 1: Patient Selection | |||
| Was a consecutive or random sample of patients enrolled? | Unclear | ||
| Was a case‐control design avoided? | Yes | ||
| Did the study avoid inappropriate exclusions? | Yes | ||
| Unclear | Low | ||
| DOMAIN 2: Index Test All tests | |||
| If a threshold was used, was it pre‐specified? | Yes | ||
| Low | Low | ||
| DOMAIN 3: Reference Standard | |||
| Is the reference standards likely to correctly classify the target condition? | Yes | ||
| Were the reference standard results interpreted without knowledge of the results of the index tests? | Yes | ||
| Low | Low | ||
| DOMAIN 4: Flow and Timing | |||
| Was there an appropriate interval between index test and reference standard? | Yes | ||
| Were all patients included in the analysis? | No | ||
| Unclear | |||
Horn 2007.
| Study characteristics | |||
| Patient sampling | Retrospective study of 173 patients from a database Exclusion criteria: not reported |
||
| Patient characteristics and setting | 173 participants: 91 FTD and 82 AD. Each diagnosis was established and retrospectively verified by a neurologist on the basis of clinical symptoms, neuropsychological tests and follow up. No further details. The widely used reference standards for FTD and the standardised criteria for AD dementia not reported Demographic data not reported Sources of recruitment: a number of different French hospitals (Paris, Toulouse, Nice, Rennes, Nantes, Rouen, Saint Etienne and Marseille) |
||
| Index tests | 3D Tc‐99m ECD (ethyl cysteinate diethylester) SPECT There are obviously some differences between SPECT images caused by different cameras and reconstruction methods Threshold: visual inspection against a classifier; not prespecified: the best performances are obtained for 8 PLS components and intensity normalisation based on the whole cortex, 0.5 probability threshold for classifying data (table 1, p1338) The images were reported by four experts, nuclear physicians with a high experience in SPECT images, blind to all clinical data. The images were displayed according to their daily practice. In addition, they were asked to give a probability‐like diagnosis so that their doubts may be recorded. The physicians seem to favour the detection of AD to the detriment of FTD: the 0.5 thresholds reveals predominance of sensitivity over specificity. It can be noticed that AD has a higher prevalence than FTD in their daily practice, leading them to biased diagnosis toward the most frequent disease. The images were acquired in different hospitals with different cameras, and had undergone different reconstruction methods. As a general experience, physicians found it more difficult to diagnose the images from centres other than their own. As a matter of fact, their performances are higher for the images coming from their own centre |
||
| Target condition and reference standard(s) | Target condition: FTD dementia (differential diagnosis of FTD versus AD dementia) Reference standard: not specified. Both the FTD dementia and AD dementia were established and retrospectively verified by a neurologist on the basis of clinical symptoms, neuropsychological tests and follow up Unclear whether the reference standard results were interpreted without knowledge of the results of the index test |
||
| Flow and timing | The Interval between SPECT and clinical assessment not reported. However, timing is not applicable as cross‐sectional. A delay is unlikely to introduce bias as the condition of dementia is irreversible FTD vs AD (Table 1, p1338) N = 173; n = 91 FTD (disease positive); n = 82 AD (disease negative) TP = 77; FP = 15; FN = 14; TN = 67 Sensitivity = 85%; Specificity = 82% |
||
| Comparative | |||
| Notes | |||
| Methodological quality | |||
| Item | Authors' judgement | Risk of bias | Applicability concerns |
| DOMAIN 1: Patient Selection | |||
| Was a consecutive or random sample of patients enrolled? | No | ||
| Was a case‐control design avoided? | No | ||
| Did the study avoid inappropriate exclusions? | Unclear | ||
| High | Unclear | ||
| DOMAIN 2: Index Test All tests | |||
| If a threshold was used, was it pre‐specified? | No | ||
| High | Unclear | ||
| DOMAIN 3: Reference Standard | |||
| Is the reference standards likely to correctly classify the target condition? | Unclear | ||
| Were the reference standard results interpreted without knowledge of the results of the index tests? | Unclear | ||
| High | Unclear | ||
| DOMAIN 4: Flow and Timing | |||
| Was there an appropriate interval between index test and reference standard? | Yes | ||
| Were all patients included in the analysis? | Yes | ||
| Low | |||
Launes 1991.
| Study characteristics | |||
| Patient sampling | 160 consecutively imaged elderly patients with suspected dementia from the hospital’s memory disorder clinic were recruited Exclusion criteria: not reported |
||
| Patient characteristics and setting | 160 participants were included in the study. A number of patients with dementia was 98 (Table 4, p762). Demographic data on 5 FTD; 36 AD; 33 VaD (MID: multi‐infarct dementia); 32 SPEC (specific causes of dementia) Gender: FTD: 2 F; 3 M; AD: 25 F,11 M; VaD: 24 F; 9 M; SPEC: 16 F, 16 M Age (mean±SD years): FTD: 66.0 ± 5.1; AD: 64.9 ± 8.1; VaD: 68.0 ± 7.9; SPEC: 58.4 ± 12.0 MMSE: not reported Education: not reported Duration of disease (mean±SD years): FTD: 3.2 ± 1.5; AD: 2.8 ± 2.0; VaD: 3.2 ± 2.0; SPEC: 2.0 ± 3.1 Sources of referral: not reported Sources of recruitment: memory disorder clinic, Helsinki University Central Hospital, Finland |
||
| Index tests |
99mTc‐HMPAO SPECT 370 to 600 MBq dose was used. Data acquisition was started 2 to 5 min after the injection. SPECT images were classified into five rCBF patterns:
As the perfusion defects are not known to be preferentially located in any particular brain areas in MID and a number of other dementing conditions, in contrast to AD and FTD, the rCBF was not semi‐quantified (e.g. by calculating cortical/cerebral count density ratios); therefore, the rCBF patterns on the SPECT scans were interpreted only visually. Threshold: prespecified; rCBF patterns on the SPECT scans were interpreted visually and without knowledge of the clinical diagnosis. However, a single‐headed camera was used with no extended acquisition. Image analysis was not performed. This is against the EANM guidelines and would represent an obsolete clinical service. |
||
| Target condition and reference standard(s) | Target condition: FTD dementia (differential diagnosis of FTD vs 1. AD dementia, 2. VaD (MID)) Reference standards: the Neary 1998 criteria. The clinical diagnosis of Alzheimer’s disease dementia and VaD (MID) dementia were established by the NINCDS‐ADRDA (McKeith 2005) and DSM‐III‐R criteria, respectively. The SPECT results were unknown to the clinicians |
||
| Flow and timing | Interval between SPECT and clinical assessment not reported. However, timing is not applicable as cross‐sectional A delay is unlikely to introduce bias as the condition of dementia is irreversible. Clinical diagnosis: 98 with dementia and 62 without dementia SPECT FTD pattern (bilateral frontal or frontotemporal area of hypoperfusion) = abnormal scans; ‘other patterns’ = normal scans Information from Table 4 (p762) and table 3 (p761) 5 FTD participants: 2 had compatible SPECT pattern; 2 had MID pattern; 1 had AD pattern 2 abnormal scans (TP = 2); 3 normal scans (FN = 3) 36 AD participants: 23 had compatible SPECT pattern; 1 had FTD pattern; 10 had MID pattern; 2 had normal pattern 1 abnormal scan (FP = 1); 35 normal scan (TN = 35) 33 MID (VaD) participants: 25 had compatible SPECT pattern; 2 had FTD pattern; 5 AD pattern; 1 abnormal but unclassified 2 abnormal scan (FP = 2); 31 normal scan (TN = 31) 24 ‘unclassifiable dementia’: 1 had compatible SPECT pattern; 5 FTD patterns; 1 had AD pattern; 11 had VaD pattern; 6 had normal pattern 5 abnormal scan (FP = 5); 19 normal scan (TN = 19) 62 patients without dementia: all patients had normal SPECT scan (Table 3, p761) 0 abnormal scan (FP = 0); 62 normal scan (TN = 62) 1) SPECT FTD pattern indicative of FTD (n = 160) 5 D+; 155 D‐ TP = 2; FP = 8; FN = 3; TN = 147 Sensitivity = 40%; Specificity = 95% (calculated in Revman5) 2) FTD vs AD (n = 41) TP = 2; FP = 1; FN = 3; TN = 35 Sensitivity = 40%; Specificity = 97% (calculated in RevMan) 3) FTD vs VaD (n = 38) TP = 2; FP = 2; FN = 3; TN = 31 Sensitivity = 40%; Specificity = 94% (calculated in RevMan) |
||
| Comparative | |||
| Notes | |||
| Methodological quality | |||
| Item | Authors' judgement | Risk of bias | Applicability concerns |
| DOMAIN 1: Patient Selection | |||
| Was a consecutive or random sample of patients enrolled? | Yes | ||
| Was a case‐control design avoided? | Yes | ||
| Did the study avoid inappropriate exclusions? | Unclear | ||
| Unclear | Low | ||
| DOMAIN 2: Index Test All tests | |||
| If a threshold was used, was it pre‐specified? | Yes | ||
| High | Low | ||
| DOMAIN 3: Reference Standard | |||
| Is the reference standards likely to correctly classify the target condition? | Yes | ||
| Were the reference standard results interpreted without knowledge of the results of the index tests? | Yes | ||
| Low | Low | ||
| DOMAIN 4: Flow and Timing | |||
| Was there an appropriate interval between index test and reference standard? | Yes | ||
| Were all patients included in the analysis? | Yes | ||
| Low | |||
Lipton 2004.
| Study characteristics | |||
| Patient sampling | Retrospective design: data used from a longitudinal study; the cases with neuropathologically diagnosed FTLD and definite AD in the database were collected for 27 participants Inclusion criteria: all cases with neuropathologically diagnosed FTLD and definite AD in the database were collected. Definite AD participants defined as having both pathologically confirmed definite AD and a history of at least one 99mTc‐HMPAO SPECT scan during clinical course |
||
| Patient characteristics and setting | In total, 27 participants were included. 23/27 participants had SPECT scan data: 6/10 FTLD and 17 AD dementia. Participants with pathologically confirmed diagnosis were included Country: USA No further information |
||
| Index tests | Xenon or 99mTc‐HMPAO SPECT The degree of lateralisation was semiquantitated by the degree of abnormality: reduced regional cerebral blood flow (rCBF) on SPECT, noted in the radiologist’s report (0 = no abnormality, 1 = mild or unspecified, 2 = moderate, and 3 = severe abnormality). Ratings were made for frontal, temporal, parietal, and occipital lobes on the right and left. Lateralisation for each lobe individually was defined by greater abnormality on either the right or left. A difference of at least 1 point between left and right for a given lobe was considered as lateralisation for that lobe. A global rating of lateralisation was made based on the predominance of left or right lateralisation for one or more lobes Threshold: not prespecified; SPECT scans were interpreted with knowledge of the clinical diagnosis. Two different types of SPECT are used |
||
| Target condition and reference standard(s) | Target condition: FTLD (differential diagnosis of FTLD vs AD dementia) Reference standard: neuropathological diagnoses for FTLD. The diagnosis of definite AD pathologically confirmed and a history of at least one 99mTc‐HMPAO SPECT scan during clinical course Not reported whether the pathological diagnosis was made without knowledge of SPECT scan, although it is likely to be independent |
||
| Flow and timing | Interval between SPECT and pathological diagnosis not reported. However, timing is not applicable as cross‐sectional assessment Information from Table 1 (p325) SPECT performed on 6/10 FTLD and 17 AD participants: all 6 FTLD had ‘abnormal’ SPECT scan (‘any lateralisation); 10 AD had ‘abnormal’ and 7 ‘normal’ (‘no lateralisation’) SPECT scan Information from Table 2 (p325) SPECT: sensitivity = 100%; specificity = 41%; PPV = 38%; NPV = 100% FTLD vs AD (any lateralisation on SPECT scan) (N = 23) N = 23; disease positive = 6; disease negative = 17 TP = 6; FP = 10; FN = 0; TN = 7 (calculated in RevMan) Note: SPECT was not performed on 4 participants with FTD |
||
| Comparative | |||
| Notes | |||
| Methodological quality | |||
| Item | Authors' judgement | Risk of bias | Applicability concerns |
| DOMAIN 1: Patient Selection | |||
| Was a consecutive or random sample of patients enrolled? | No | ||
| Was a case‐control design avoided? | No | ||
| Did the study avoid inappropriate exclusions? | Yes | ||
| High | Unclear | ||
| DOMAIN 2: Index Test All tests | |||
| If a threshold was used, was it pre‐specified? | No | ||
| High | Low | ||
| DOMAIN 3: Reference Standard | |||
| Is the reference standards likely to correctly classify the target condition? | Yes | ||
| Were the reference standard results interpreted without knowledge of the results of the index tests? | Yes | ||
| Low | Low | ||
| DOMAIN 4: Flow and Timing | |||
| Was there an appropriate interval between index test and reference standard? | Yes | ||
| Were all patients included in the analysis? | No | ||
| High | |||
McNeill 2007.
| Study characteristics | |||
| Patient sampling | Retrospective design. Forty‐three FTD and 31 AD patients had been referred between 1985 and 1998 to the Greater Manchester Neurosciences Center, Salford, UK. Their diagnoses were pathologically confirmed in Shi Shi 2005 This study is part of a larger research programme. No further details Exclusion criteria: not reported |
||
| Patient characteristics and setting | Fifty six participants: 25 FTD and 31 AD participants with pathologically confirmed diagnoses were included. The clinical records of both FTD and AD groups were scrutinised. These patients had been assessed longitudinally using detailed neurological and neuropsychological evaluation (Neary 1986). The overall clinical diagnosis had been based on a consensus between the neurologist and neuropsychologist in a multidisciplinary setting. This presumptive clinical diagnosis was before SPECT scanning was recorded. Patients had been followed up every 6 months until their death Gender: 18 F, 38 M (FTD: 7 F; 18 M; AD: 11 F, 20 M) Age (mean±SD years): FTD: 58.0 ± 10; AD: 61 ± 7 MMSE (mean±SD): FTD: 20 ± 7; AD: 16 ± 6 Duration of disease (mean±SD years): FTD: 4 ± 4; AD: 4 ± 2 Education: not reported Sources of referral: not reported Sources of recruitment: tertiary care centre, UK |
||
| Index tests |
99mTc‐HMPAO SPECT Obtained at initial evaluation. SPECT scans, performed within 1 month of the first clinical assessment, were included in the study The scans were rated:
This rating was performed regionally for frontal, parietal, temporal and occipital regions on the left and right. Asymmetry was rated as either absent or present (0 and 1, respectively). Blood flow was assessed using a coloured magenta heat scale. Areas were considered abnormal if they were below the halfway point of this scale on more than two sections. Finally, a diagnosis was made using a choice of FTD, AD or 'non‐specific' Threshold: prespecified; visual interpretation of the SPECT images by a consultant in nuclear medicine, experienced in the interpretation of SPECT images of patients with dementia. They were reported blind to all clinical and pathological data. However, a single‐headed camera was used with no extended acquisition. Image analysis was not performed. This is against the EANM guidelines and would represent an obsolete clinical service |
||
| Target condition and reference standard(s) | Target condition: FTD (differential diagnosis of FTD vs AD dementia) Reference standard: pathological diagnosis (Shi 2005). The diagnosis for AD was made by Consortium to Establish a Registry for AD criteria for the neuropathological diagnosis (Mirra 1991) |
||
| Flow and timing |
Duration until death: mean 4 ± 4 years for FTD; mean 4 ± 2 years for FTD Information from Table 2 (page 351): FTD vs AD analysis (N = 56) (frontal region) FTD = 25 (disease positive); AD = 31 (disease negative) SPECT in FTD participants: 20 (73%) FTD abnormal (TP = 20); 5 (20%) SPECT normal (FN = 5) SPECT in AD participants: 12 (39%) FTD abnormal (FP = 12); 19 (61%) AD normal (TN = 19) Sensitivity = 80%; Specificity = 61% (calculated in Revman5) FTD vs AD analysis (N = 56) (parietal region) FTD = 25 (disease positive); AD = 31 (disease negative) SPECT in FTD participants: 7 (28%) FTD abnormal (TP = 7); 18 (72%) SPECT normal (FN = 18) SPECT in AD participants: 28 (90%) FTD abnormal (FP = 28); 3 (10%) AD normal (TN = 3) Sensitivity = 28%; Specificity = 10% (calculated in Revman5) FTD vs AD analysis (N = 56) (temporal region) FTD = 25 (disease positive); AD = 31 (disease negative) SPECT in FTD participants: 15 (60%) FTD abnormal (TP = 15); 10 (40%) SPECT normal (FN = 10) SPECT in AD participants: 27 (87%) FTD abnormal (FP = 27); 4 (13%) AD normal (TN = 4) Sensitivity = 60%; Specificity = 13% (calculated in Revman5) FTD vs AD analysis (N = 56) (occipital region) FTD = 25 (disease positive); AD = 31 (disease negative) SPECT in FTD participants: 1 (4%) FTD abnormal (TP = 1); 24 (96%) SPECT normal (FN = 24) SPECT in AD participants: 6 (19%) FTD abnormal (FP = 11); 25 (81%) AD normal (TN = 25) Sensitivity = 4%; Specificity = 69% (calculated in Revman5) Note: all participants with the pathologically confirmed diagnosis were included in the analysis |
||
| Comparative | |||
| Notes | |||
| Methodological quality | |||
| Item | Authors' judgement | Risk of bias | Applicability concerns |
| DOMAIN 1: Patient Selection | |||
| Was a consecutive or random sample of patients enrolled? | No | ||
| Was a case‐control design avoided? | No | ||
| Did the study avoid inappropriate exclusions? | Unclear | ||
| High | Low | ||
| DOMAIN 2: Index Test All tests | |||
| If a threshold was used, was it pre‐specified? | Yes | ||
| High | Low | ||
| DOMAIN 3: Reference Standard | |||
| Is the reference standards likely to correctly classify the target condition? | Yes | ||
| Were the reference standard results interpreted without knowledge of the results of the index tests? | Yes | ||
| Low | Low | ||
| DOMAIN 4: Flow and Timing | |||
| Was there an appropriate interval between index test and reference standard? | Yes | ||
| Were all patients included in the analysis? | Yes | ||
| Low | |||
Nagao 2004.
| Study characteristics | |||
| Patient sampling | Retrospective study: 21 consecutive patients with a diagnosis of FTLD were selected from the data file of the outpatient clinic between October 1998 and March 2002 (Hokoishi 2001) and 21 patients with probable AD were randomly sampled from the same data file. They were matched for sex, age, duration of dementia and severity of dementia as estimated with the CDR. Eleven healthy controls with normal cognitive findings were recruited from the community We only included data on performance of the index test to discriminate between patients with FTLD and AD dementia Exclusion criteria: i) the clinical features described as excluding FTLD by Neary 1998 criteria; ii) an advanced stage of FTLD, with severe deficits or behavioural disorders that could have made assessment difficult; iii) patients with magnetic resonance imaging (MR) imaging evidence of focal brain lesions and MR angiographic evidence of occlusive lesions in the cervical and intracranial arteries were also excluded |
||
| Patient characteristics and setting | 42 participants: 21 FTLD and 21 AD. Primary degenerative dementia patients who satisfied the DSM‐III criteria for dementia were recruited for this study. FTLD and AD were diagnosed clinically using the Neary 1998 and McKhann 1984 criteria, respectively. Gender: FTLD: 14 F and 7 M; AD: 13 F and 8 M Age (mean±SD years): FTLD: 65.5 ± 6.2; AD: 69.6 ± 6.9 Clinical Dementia Rating (CDR): FTLD: 8 with a CDR of 0.5 and 13 with a CDR of 1.0; AD: 7 with a CDR of 0.5 and 14 with a CDR of 1.0 MMSE: (mean±SD) FTLD: 23.2 ± 5.4; AD: 21.6 ± 4.6 Sources of referrals: not reported Sources of recruitment: Higher Brain Function Clinic for Outpatients of the University Hospital of Ehime, Matsuyama, Japan |
||
| Index tests |
99mTc‐HMPAO SPECT 740 MBq dose was used. The SPECT images were delineated images using a 35% and a 50% cut‐off of the maximal voxel radioactivity and measured the number of voxels included in the contours of two different cutoffs. The fractal dimension (FD) was calculated by relating the logarithms of the cut‐offs and the numbers of voxels and it was defined as the heterogeneity of cerebral perfusion (Chung 2000; Nagao 2002). The SPET images were divided into two sets, anterior and posterior Thresholds: not prespecified
Not reported whether the results of the index test were interpreted without the knowledge of a clinical diagnosis |
||
| Target condition and reference standard(s) | Target condition: FTLD (differential diagnosis of FTLD vs AD dementia) Reference standard: Neary 1998. The clinical diagnosis of AD was established by the NINCDS‐ADRDA criteria (McKhann 1984). The reference standard results were interpreted without knowledge of the results of the index test (index test was applied after the clinical diagnoses were made) |
||
| Flow and timing | Interval between SPECT and clinical assessment not reported. However, timing is not applicable as cross‐sectional. A delay is unlikely to introduce bias as the condition of dementia is irreversible FTLD vs AD 1) SPECT result: anterior FD > 1.46 21 FTLD participants: 11 SPECT positive; 10 SPECT negative 21 AD participants: 3 SPECT positive; 18 SPECT negative TP = 11; FN = 10; FP = 3; TN = 18 Sensitivity = 52%; Specificity = 86% (calculated in Revman5) 2) SPECT result: anterior FD to posterior FD > 1.6 21 FTLD participants: 11 SPECT positive; 10 SPECT negative 21 AD participants: 0 SPECT positive; 21 SPECT negative TP = 11; FN = 10; FP = 0; TN = 21 Sensitivity = 52%; Specificity = 100% (calculated in Revman5) |
||
| Comparative | |||
| Notes | The trial investigators were contacted; they provided requested data tor the 2 x 2 table to be completed; email from Dr Nagao on 02/2/13 | ||
| Methodological quality | |||
| Item | Authors' judgement | Risk of bias | Applicability concerns |
| DOMAIN 1: Patient Selection | |||
| Was a consecutive or random sample of patients enrolled? | Unclear | ||
| Was a case‐control design avoided? | No | ||
| Did the study avoid inappropriate exclusions? | Yes | ||
| High | Low | ||
| DOMAIN 2: Index Test All tests | |||
| If a threshold was used, was it pre‐specified? | No | ||
| High | Low | ||
| DOMAIN 3: Reference Standard | |||
| Is the reference standards likely to correctly classify the target condition? | Yes | ||
| Were the reference standard results interpreted without knowledge of the results of the index tests? | Yes | ||
| Low | Low | ||
| DOMAIN 4: Flow and Timing | |||
| Was there an appropriate interval between index test and reference standard? | Yes | ||
| Were all patients included in the analysis? | Yes | ||
| Low | |||
Pickut 1997.
| Study characteristics | |||
| Patient sampling | Twenty‐one patients clinically diagnosed with FLD were selected from the records of a Memory Clinic. Age‐ and severity‐matched FLD (n = 21) and (S)DAT (n = 19) groups were considered. No further information on sampling Exclusion criteria: patients with concurrent pathology (vascular dementia, atrophy, tumours, focal or more than age‐associated atrophy) were excluded |
||
| Patient characteristics and setting | 40 participants: 21 FLD and 19 (S)ADT Age (mean±SD years): 70 ± 9 years in both groups MMSE (mean±SD) 15.4 ± 4.9 in the FLD group; mean 14.8 ± 5.3 in the (S)DAT group Sources of recruitment: records of memory clinic. Country: Belgium |
||
| Index tests |
99mTc‐HMPAO SPECT Threshold: images were assessed qualitatively by visual interpretation on shades of colour in cortical regions. Brain SPECT perfusion deficits were scored by visual qualitative analysis with respect to location: frontal, parietal, temporal and occipital; lateralisation: left and or right; and severity score: 0 = normal (no perfusion deficit); 1 = slight (13% to 30%); 2 = moderate (30% to 50%); 3 = severe (> 50%, including breaching of the cortex). The probability of predicting (S)DAT based on the SPECT scan is calculated with the formula (p932), using the severity score of bifrontal hypoperfusion: value ˂ 0.5 was predictive for FLD; value > 0.5 was predictive for (S)DAT Threshold: not prespecified The physicians were unaware of the type and severity of cognitive impairment of the patient studied |
||
| Target condition and reference standard(s) | Target condition: FLD (differentiating FLD vs senile dementia of Alzheimer's type) Reference standard: not specified The diagnosis of probable (S)DAT was based on the NINCDS‐ADRDA criteria. The patients also fulfilled the DSM IV‐criteria The clinical diagnoses were established before participants underwent SPECT scans |
||
| Flow and timing | Interval between SPECT and clinical assessment not reported. However, timing is not applicable as cross‐sectional. A delay is unlikely to introduce bias as the condition of dementia is irreversible FLD vs (S)DAT N = 40: 21 FLD (D+): 81% correctly classified: 17/21: TP = 17; FN = 4; 18 (S)DTA (D‐): 74% correctly classified: 14/19: TN = 14; FP = 5 Sensitivity = 81%; Specificity = 74% (calculated in RevMan5) |
||
| Comparative | |||
| Notes | |||
| Methodological quality | |||
| Item | Authors' judgement | Risk of bias | Applicability concerns |
| DOMAIN 1: Patient Selection | |||
| Was a consecutive or random sample of patients enrolled? | No | ||
| Was a case‐control design avoided? | No | ||
| Did the study avoid inappropriate exclusions? | Yes | ||
| High | Low | ||
| DOMAIN 2: Index Test All tests | |||
| If a threshold was used, was it pre‐specified? | No | ||
| High | Low | ||
| DOMAIN 3: Reference Standard | |||
| Is the reference standards likely to correctly classify the target condition? | Unclear | ||
| Were the reference standard results interpreted without knowledge of the results of the index tests? | Yes | ||
| High | Unclear | ||
| DOMAIN 4: Flow and Timing | |||
| Was there an appropriate interval between index test and reference standard? | Yes | ||
| Were all patients included in the analysis? | Yes | ||
| Low | |||
Read 1995.
| Study characteristics | |||
| Patient sampling | Twenty seven participants were retrospectively recruited. They were consecutive dementia patients, clinically evaluated at a Univeresity dementia clinic. and were unselected Exclusion criteria: not reported |
||
| Patient characteristics and setting | 27 patients undergoing full clinical evaluation, including SPECT, were identified with diagnostic neuropathological studies by a chart review. Clinical diagnosis at baseline: 8 FTD; 7 probable AD; 4 possible AD; 1 AD‐LBD variant; 1 AD‐vascular; 6 other (2 JCD; 2 MID; 1 MID‐AD; 1 hydrocephalus) Pathologically confirmed diagnosis at follow up: 7 FTLD (n = 4 FTD & 3 Pick’s disease) and 13 AD. Demographic data reported for those 20 participants Gender: 11 M; 9 F Age: range 42 to 69 years Sources of recruitment: University‐based speciality dementia clinic. Country: USA |
||
| Index tests |
99mTc‐HMPAO SPECT Threshold: prespecified; four patterns emerged, each corresponding to a distinct pathological entry. All SPECT scans were interpreted visually by a nuclear medicine physician blinded to clinical diagnosis. SPECT predicted pathology in 93% The SPECT methodology section is unclear in this paper. Two types of camera are mentioned, one of which would not meet the criteria of the EANM and SNM guidelines. However, the other camera is a dedicated brain system. The authors do not state the proportion of patients imaged on each system. In addition standard clinical practice was not followed with regards to rest times following injection of the radiotracer |
||
| Target condition and reference standard(s) | Target condition: FTLD (differential diagnosis of FTD versus AD dementia) Reference standard: pathology (brain biopsy or post‐mortem brain pathology) In all of the patients clinical diagnosis was made before using SPECT |
||
| Flow and timing | There was an appropriate interval between index test and referense standard (pathohystology or brain biopsy). 1) SPECT FTD type pattern indicative of FTD confirmed pathologically (n = 27) (Table 1, p1244) Participants (N = 27): 7/27 had ‘SPECT FTD type pattern’: ‘positive test’; 20/27 ‘SPECT other type pattern’: ‘negative test’ All 7 participants with SPECT ‘positive test’ were pathologically diagnosed with FTLD (FTD) (1 with biopsy and 6 with histopathology). No participant with SPECT ‘negative’ test was diagnosed with FTLD (FTD) TP = 7; FP = 0; FN = 0; TN = 20; Sensitivity = 100%; Specificity = 100% 2) FTLD vs AD (n = 20) (Table 1, p1244) TP = 7; FP = 0; FN = 0; TN = 13; Sensitivity = 100%; Specificity = 100% All participants pathologically diagnosed with FTD and AD were included in analyses |
||
| Comparative | |||
| Notes | |||
| Methodological quality | |||
| Item | Authors' judgement | Risk of bias | Applicability concerns |
| DOMAIN 1: Patient Selection | |||
| Was a consecutive or random sample of patients enrolled? | Unclear | ||
| Was a case‐control design avoided? | Yes | ||
| Did the study avoid inappropriate exclusions? | Unclear | ||
| Unclear | Low | ||
| DOMAIN 2: Index Test All tests | |||
| If a threshold was used, was it pre‐specified? | Yes | ||
| Unclear | Low | ||
| DOMAIN 3: Reference Standard | |||
| Is the reference standards likely to correctly classify the target condition? | Yes | ||
| Were the reference standard results interpreted without knowledge of the results of the index tests? | Yes | ||
| Low | Low | ||
| DOMAIN 4: Flow and Timing | |||
| Was there an appropriate interval between index test and reference standard? | Yes | ||
| Were all patients included in the analysis? | Yes | ||
| Low | |||
Rollin‐Sillaire 2012.
| Study characteristics | |||
| Patient sampling | Retrospective study of 48 consecutive patients with a degenerative or vascular dementia who were referred to a memory clinic between 1989 and 2008 Exclusion criteria: not reported |
||
| Patient characteristics and setting | 48 participants patients: 25 with a clinical diagnosis of AD; 19 with a clinical diagnosis of FTLD/PSP/CBD; 5 with 'other' clinical diagnoses. The caseload database (1989 to 2008) at the Lille/Bailleul memory clinic was reviewed to identify all patients who had: i) a clinical diagnosis of dementia disorder, ii) SPECT imaging data, and iii) a definite diagnosis determined by neuropathological or genetic evidence. All medical records were reviewed by two neurologists blinded to the definite diagnosis and SPECT images. These clinical diagnoses were made at time of SPECT acquisition and just before death, according to the international diagnostic criteria (Cairns 2007; Ball 1997). Age at first symptom (median; mean±SD years): total sample: 62.8; 61.6 ± 9.6; FTLD/PSP/CBD: 58.9; 57.4 ± 10.3; AD: 62.9; 62.4 ± 7.8 Age at SPECT (median; mean±SD years): total sample: 68.5; 67.3 ± 8.9; FTLD/PSP/CBD: 64.9; 62.1 ± 10.5; AD: 69.2; 65.5 ± 6.2 Time between first symptom and first visit (median; mean±SD years): total sample: 3.3; 4.4 ± 3.6; FTLD/PSP/CBD: 2.8; 3.6 ± 3.1; AD: 5.7; 5.5 ± 5.6 Time between first symptoms and SPECT (median; mean±SD years): total sample: 4.7; 5.8±3.8; FTLD/PSP/CBD: 3.7; 4.7±3.2; AD: 5.4; 6.9±3.8 Time between first visit and SPECT (median; mean±SD years): total sample: 0.3; 1.4±1.9; FTLD/PSP/CBD: 0.6; 1.1±1.3; AD: 0.2; 1.4±2.1 MMSE at first visit (median; mean±SD): total sample: total sample: 20; 19.5±6.7; FTLD/PSP/CBD: 24; 23.8±3.4; AD: 15; 14.6±8.1 MMSE at the time of SPECT (median; mean±SD): total sample: 19; 17.6±7.6; FTLD/PSP/CBD: 20.5; 231.2±34.5; AD: 18; 16.9±7.2 Age at death (median; mean±SD years): total sample: 73.5; 72.3±9.5; FTLD/PSP/CBD: 67.4; 66.1±10.9; AD: 75; 75.1±6.8 Duration of (median; mean±SD years): total sample: 9.6; 10.8±4.7; FTLD/PSP/CBD: 8.5; 8.6±3.2; AD: 12.6; 12.7±4.8 Sources of recruitment: Lille‐Bailleul Memory Clinic, University of Lille Nord de France |
||
| Index tests |
99mTc‐HMPAO SPECT All SPECT images were acquired between 1990 and 2006. SPECT imaging data were normalised and represented by fixation values according to a coloured scale for immediate ranking: a value of less than 80% was considered to be significant (Steinling 1988). This cut‐off was inially determined to obtain a specificity of 100% and a specificity of 60% for AD diagnosis (Steinling 1989) Threshold: prespecified; visual interpretation Index test was interpreted without the knowledge of reference standard |
||
| Target condition and reference standard(s) | Target conditions: FTLD (differential diagnosis of FTLD vs 1) AD and 2) non‐FTLD) Reference standards: pathological diagnosis for FTLD was established by the Cairns 2007 criteria. The pathological diagnosis for AD was made by the Ball 1997 criteria The reference standard results were interpreted without knowledge of the index test |
||
| Flow and timing |
Duration of follow up: participants were followed until death At baseline: N = 48 participants with a clinical diagnosis of dementia disorder (9 SPECT with FTLD pattern; 1 SPECT with PPA; 38 SPECT with ‘other’ patterns) (p836) At follow up: neuropathology was performed in 47 patients and genetic mutation in one patient (data provided by the author) 1) SPECT FTD pattern indicative of FTD (n = 48) SPECT ‘FTD type pattern’ = 10 ‘positive tests’: 9 FTLD (disease positive) and 1 non‐FTLD (disease negative) SPECT ‘other or normal type pattern’ = 38 ‘negative tests’: 3 FTLD (disease positive) and 35 non FTLD (disease negative) TP = 9; FP = 1; FN = 3; TN = 35; Sensitivity = 75%; Specificity = 97% (calculated in Revman5) 2) FTD vs AD (N = 35) 12 patients with FTLD pathological diagnosis (including 2 Pick's dementia and 1 PGRN mutation) at follow up: 9 with FTLD SPECT pattern and 1 with PPA pattern (positive tests) TP = 9; 3 with 'other' SPECT patterns (2 with DLB pattern; 1 with non‐specific hypoperfusion) (negative test) FN = 3 23 patients with AD pathological diagnosis at follow up: 0 with FTLD SPECT pattern (positive tests) FP = 0; 23 with 'other' SPECT patterns (negative test) TN = 23 Sensitivity = 75%; Specificity = 100% (calculated in Revman5) Loss to follow up: none |
||
| Comparative | |||
| Notes | The trial investigators were contacted; they provided some requested data tor the 2 x 2 table to be completed; email from Dr Rollin‐Silliare on 21/2/13 | ||
| Methodological quality | |||
| Item | Authors' judgement | Risk of bias | Applicability concerns |
| DOMAIN 1: Patient Selection | |||
| Was a consecutive or random sample of patients enrolled? | Unclear | ||
| Was a case‐control design avoided? | Yes | ||
| Did the study avoid inappropriate exclusions? | Unclear | ||
| Unclear | Low | ||
| DOMAIN 2: Index Test All tests | |||
| If a threshold was used, was it pre‐specified? | Yes | ||
| Low | Low | ||
| DOMAIN 3: Reference Standard | |||
| Is the reference standards likely to correctly classify the target condition? | Yes | ||
| Were the reference standard results interpreted without knowledge of the results of the index tests? | Yes | ||
| Low | Low | ||
| DOMAIN 4: Flow and Timing | |||
| Was there an appropriate interval between index test and reference standard? | Yes | ||
| Were all patients included in the analysis? | Yes | ||
| Low | |||
Talbot 1998.
| Study characteristics | |||
| Patient sampling | A sample of 363 patients who were consecutively referred to the cerebral function unit at Manchester Royal Infirmary for diagnostic assessment of dementia Exclusion criteria: not reported |
||
| Patient characteristics and setting | 363 participants with suspected dementia underwent neuropsychological evaluation, neurological examination, CT, and 99mTc‐HMPAO SPECT at initial presentation. Patients were reviewed prospectively for a median three (range 1–6) years with six monthly neuropsychological and neurological evaluation, and classified on the basis of established clinical criteria into a number of disease groups. Age and gender were reported in the five largest groups (N = 314): AD (132), vascular dementia (78), Lewy body disease (24), frontotemporal dementia (58) and progressive aphasia (22) Gender: FTD: 26 F; 32 M; AD: 80 F, 52 M; VaD: 37 F; 41 M; LBD: 10 F; 14 M; progressive aphasia: 15 F; 7 M Age (mean±SD years): FTD: 58.9 ± 1.1; AD: 58.9 ± 1.1; VaD: 63.6 ± 8.1; LBD: 67.6 ± 4.8; progressive aphasia (PA): 64.9 ± 6.8 MMSE (mean±SD): not reported Education (mean±SD years): not reported Sources of referral: not reported Sources of recruitment: Hospital Cerebral Functional Unit, Manchester, UK |
||
| Index tests |
99mTc‐HMPAO SPECT The index test was performed on all 363 participants at baseline (within one month of initial presentation). The 99mTc‐HMPAO SPECT images were reported by a consultant in nuclear medicine experienced in the interpretation of CBF images. Images were viewed on a monitor with standardised display settings and reported blind to clinical and CT findings Threshold: not prespecified: visual interpretation, using magenta scale: bilateral anterior CBF abnormality or bilateral anterior plus unilateral posterior CBF abnormality (SPECT indicative of FTLD) The threshold above provides support for frontotemporal dementia (p311). It was not reported whether the index test results were interpreted without knowledge of the results of the reference standard. A single‐headed camera was used with no extended acquisition. Image analysis was not performed. This is against the EANM guidelines and would represent an obsolete clinical service |
||
| Target condition and reference standard(s) | Target condition: FTD: differential diagnosis of FTD vs i) AD dementia and ii) VaD Reference standard: the Brun 1994 criteria; in four patients the clinical diagnosis was confirmed pathologically Mann 1993). The clinical diagnosis for AD and vascular dementia were established by the NINCDS‐ADRDA (McKhann 1984) and Román 1993 criteria, respectively. Pathological confirmation of AD was established in eight patients (Mann 1993) Not reported whether the reference standard results were interpreted without knowledge of the results of the index test |
||
| Flow and timing |
Duration of follow up: median 3 years (range 1 to 6 years) Index test: SPECT 'bilateral anterior' or 'bilateral anterior plus unilateral posterior' CBF abnormality At baseline: 363 participants with suspected dementia At follow up: 132 AD; 58 FTD; 78 VD; 24 LBD; 22 progressive aphasia; 49 ‘other’ (according to the clinical diagnosis) Information from Table 2 (p307) 1) SPECT FTD pattern indicative of FTD SPECT pattern: bilateral anterior brain hypoperfusion Participants: 132 AD; 58 FTD; 78 VD; 24 LBD; 22 progressive aphasia (n = 314) TP = 21; FP = 21; FN = 37; TN = 235 Sensitivity = 36%; specificity = 92% (calculated in RevMan5) 2) FTLD vs AD SPECT pattern: bilateral anterior and bilateral anterior & unilateral posterior brain hypoperfusion Participants: FTLD (FTD & PA) = 80; AD = 132 (N = 212) TP = 37; FP = 5; FN = 43; TN = 127 Sensitivity = 46%; specificity = 96% (calculated in RevMan5) 2) FTLD vs VD SPECT pattern: bilateral anterior and bilateral anterior & unilateral posterior brain hypoperfusion Participants: FTLD (FTD & PA) = 80; VaD = 78 (N = 158) TP = 37; FP = 21; FN = 43; TN = 57 Sensitivity = 46%; specificity = 73% (calculated in RevMan5) Loss to follow up: 49 participants with ‘other’ clinical diagnosis not included because the relevant information for those patients are not reported |
||
| Comparative | |||
| Notes | |||
| Methodological quality | |||
| Item | Authors' judgement | Risk of bias | Applicability concerns |
| DOMAIN 1: Patient Selection | |||
| Was a consecutive or random sample of patients enrolled? | Yes | ||
| Was a case‐control design avoided? | Yes | ||
| Did the study avoid inappropriate exclusions? | Unclear | ||
| Unclear | Low | ||
| DOMAIN 2: Index Test All tests | |||
| If a threshold was used, was it pre‐specified? | No | ||
| High | Low | ||
| DOMAIN 3: Reference Standard | |||
| Is the reference standards likely to correctly classify the target condition? | Yes | ||
| Were the reference standard results interpreted without knowledge of the results of the index tests? | Unclear | ||
| Unclear | Low | ||
| DOMAIN 4: Flow and Timing | |||
| Was there an appropriate interval between index test and reference standard? | Yes | ||
| Were all patients included in the analysis? | No | ||
| Unclear | |||
Valotassiou 2012.
| Study characteristics | |||
| Patient sampling | 112 consecutive patients from the outpatient hospital memory clinic Exclusion criteria: pregnant women, patients with a history of psychiatric disorders and patients with signs or findings of other neurological disorders and patients with the presence of vascular or structural brain lesions |
||
| Patient characteristics and setting | 112 participants: 73 FTLD (bvFTLD = 20; PNFA = 11; SD = 21; CBD/PSP = 21) and 39 AD Gender: FTLD: 52 F; 21 M; AD: 29 F 10 M Age (mean±SD years): FTLD: 65± 9; AD: 71 ± 8 MMSE (mean±SD): FTLD: 16 ± 9; AD: 19 ± 5 Education: (mean±SD years)FTLD: 10.7± 4.7; AD: 9.3± 4.7 Years of disease (mean±SD): FTLD: 3± 2; AD: 4± 2 Sources of referral: not reported Sources of recruitment: outpatient hospital memory clinic of the General Hospital, Larrisa, Greece |
||
| Index tests |
99mTc‐HMPAO SPECT 740 MBq dose was administered NeuroGram software on the restricted data for the semiquantitative evaluation of brain perfusion in specific Broadmann areas (BA) was used. This is the method of statistical analysis for automated diagnosis of brain perfusion SPECT images. A predefined anatomical and BA template for the semiquantitative analysis was used in order to investigate brain perfusion. Threshold: not prespecified; the optimal sensitivity and specificity of various cut‐off perfusion values were determined from ROC curves Computer program used for the interpretation of the results of the index test |
||
| Target condition and reference standard(s) | Target condition: i) bvFTLD or ii) PNFA or iii) SD vs AD dementia (differential diagnosis) Reference standard: Neary 1998 criteria. The clinical diagnosis of AD dementia was established by the NINCDS‐ADRDA (McKhann 1984) The clinical diagnosis of dementia was made before performing SPECT scans |
||
| Flow and timing | Interval between SPECT and clinical assessment not reported. However, timing is not applicable as cross‐sectional. A delay is unlikely to introduce bias as the condition of dementia is irreversible Participants: 73 FTLD (bvFTLD = 20; PNFA = 11; SD = 21; CBD/PSP = 21) and 39 AD Information from Table 4 (p1271) 1) bvFTLD vs AD (n = 59) bvFTLD = 20 (disease positive); AD = 39 (disease negative); sensitivity = 75%; specificity = 79% TP = 15; FP = 8; FN = 5; TN = 31 (calculated in Revman5) 2) PNFA vs AD (n = 50) PNFA = 11 (disease positive); AD = 39 (disease negative); sensitivity = 76.9%; specificity = 63.4% TP = 8; FP = 14; FN = 3; TN = 25 (calculated in Revman5) 3) SD vs AD (n = 50) SD = 21 (disease positive); AD = 39 (disease negative); sensitivity = 81%; specificity = 51% TP = 17; FP = 19; FN = 4; TN = 20 (calculated in Revman5) We did not include 21 CBD/PSP patients in the analyses; they are not the patients with the target condition considered in the review |
||
| Comparative | |||
| Notes | |||
| Methodological quality | |||
| Item | Authors' judgement | Risk of bias | Applicability concerns |
| DOMAIN 1: Patient Selection | |||
| Was a consecutive or random sample of patients enrolled? | Unclear | ||
| Was a case‐control design avoided? | No | ||
| Did the study avoid inappropriate exclusions? | Yes | ||
| High | Low | ||
| DOMAIN 2: Index Test All tests | |||
| If a threshold was used, was it pre‐specified? | No | ||
| High | Low | ||
| DOMAIN 3: Reference Standard | |||
| Is the reference standards likely to correctly classify the target condition? | Yes | ||
| Were the reference standard results interpreted without knowledge of the results of the index tests? | Yes | ||
| Low | Low | ||
| DOMAIN 4: Flow and Timing | |||
| Was there an appropriate interval between index test and reference standard? | Yes | ||
| Were all patients included in the analysis? | No | ||
| Unclear | |||
AD=Alzheimer's disease dementia; FTD=frontotemporal dementia; VaD=vascular dementia; LBD=Lewy body dementia; SPECT=single‐photon emission computerised tomography; MRI=magnetic resonance imaging; CSF=cerebrospinal fluid; CAD=clinically ambiguous dementia; DSM=Diagnostic and Statistical Manual of Mental Disorders; MMSE=The Mini Mental State Examination; NINCDS‐ADRDA=National Institute of Neurological and Communicative Disorders and Stroke and the Alzheimer's Disease and Related Disorders Association; ±SD= ±standard deviation; 99mTc‐HMPAO=Technetium exametazime hexamethylpropyleneamine oxime; RevMan5; Review Manager 5; NINDS‐AIREN=National Institute of Neurological and Communicative Disorders and Stroke and Association Internationale pour la Recherche et l'Enseignement en Neurosciences; TP: true positive; FP: false positive; FN: false negative; TN: true negative; 3D Tc‐99m ECD=three‐dimensional spaceTechnetium exametazime ethyl cysteinate diethylester; PLS=partial least square; SPEC=specific causes of dementia; MID: multi‐infarct dementia; rCBF=regional cerebral blood flow; EANM=European Association of Nuclear Medicine; FTLD=frontotemporal lobar degeneration; PPV=positive predictive value; NPV=negative predictive value; CDR=; FD=fractal dimension; CDR=clinical dementia rating; (S)DAT=(Senile) demenia of the Alzheimer's type; D+ = disease positive; D+ = disease negative; SNM: Society of Nuclear Medicine; bvFTLD=behavioural variant frontotemporal degeneration; PNFA=progressive nonfluent aphasia; CBD/PSP=corticobasal degeneration/ progressive supranuclear palsy; PPA=primary progressive aphasia; CT=computerised tomography; BA: Brodmann area; ROC=receiver operating characteristic; SD=semantic dementia
Characteristics of excluded studies [ordered by study ID]
| Study | Reason for exclusion |
|---|---|
| Barnes 2000 | Not having data for constructing a 2 x 2 table. Target condition: not differential diagnosis of FTD vs other forms of dementia. The focus of the study was to investigate whether SPM is an effective decision and whether it impacts on the confidence of image reporting |
| Barquero 1996 | Not having data for constructing a 2 x 2 table. Participants: PPA variant FTD; participants with other forms of dementia not included |
| Boeve 2012 | Not having data for constructing a 2 x 2 table for FTD. Genetic analysis performed |
| Bonte 1994 | Not having data for constructing a 2 x 2 table for FTD. Target condition: Alzheimer's diasease dementia participants: only 4/30 patients had frontal dementia pathological diagnosis |
| Bonte 2004 | Not having data for constructing a 2 x 2 table. Target condition: Alzheimer's disease dementia not FTD. Index test: AD SPECT pattern observed |
| Borghesani 2010 | Insufficient data to complete 2 x 2 tables. Additional data were requested from the trial investigators but no further information was available at the time this review was prepared |
| Borroni 2010 | Not having data for constructing a 2 x 2 table. Participants: bvFTD, SD and PNFA variant only; participants with other frorms of dementia not included. The focus of the study was to evaluate the correlation between FTLD‐modified Clinical Dementia Rating (CDR) scale and the degree of frontotemporal hypoperfusion in patients with FTLD |
| Borroni 2012 | Not having data for constructing a 2 x 2 table. Participants: bvFTD and SD variant FTD only; participants with other forms of dementia not included. The focus of the study was to evaluate whether SPECT scan may be useful to predict prognosis of long‐term survival in FTLD patients |
| Buchpiguel 1996 | Not having data for constructing a 2 x 2 table. Participants: at follow up only 1 participant with FTD |
| Didic 1998 | Not having data for constructing a 2 x 2 table. Participants: FTD patients only; participants with other types of dementia not included. Target condition: not differential diagnosis of FTD vs other types of dementia |
| Frisoni 1992 | Not having data for constructing a 2 x 2 table. Index test: threshold not used. Participants: 5 FTD and 5 AD. The AD participants were 'atypical': one participant had vivid hallucinations and one had delusions |
| Frisoni 1995 | Not having data for constructing a 2 x 2 table. Index test: threshold not used. Target condition not differential diagnosis of FTD vs other types of dementia. The focus of the study was to assess the neuropsychological SPECT imaging feature in DFT and AD participants |
| Grace 2001 | Not having data for constructing a 2 x 2 table. Target condition: not differential diagnosis of FTD vs other types of dementia. The focus of the study was to evaluate the relationship of behavioural changes to other diagnostic information regarding dementia (SPECT, neuropsychological performance, depressive symptomatology) |
| Hannequin 2001 | Not having data for constructing a 2 x 2 table. Participants: PPA variant FTD patients only. Participants with other forms of dementia not included. Target condition: not differential diagnosis of FTD vs other types of dementia |
| Hogh 2004 | Not having data for constructing a 2 x 2 table. Target condition: not FTD. The focus of the studies was not identifying those participants with a questionable dementia at baseline who would develop FTD at follow up |
| Honda 2002 | Not having data for constructing a 2 x 2 table. The focus of the study was to evaluate interobserver variation in diagnosis of dementia by brain perfusion SPECT |
| Joseph 2006 | Not having data for constructing a 2 x 2 table. Only one patient out of five with FTLD pathological diagnosis had a SPECT scan at baseline |
| Julin 1995 | Not having data for constructing a 2 x 2 table. Index test: threshold not used. Target condition: not differential diagnosis of FTD vs AD dementia |
| Kaneko 2004 | Not having data for constructing a 2 x 2 table. Index test: 99mTc‐HMPAO SPECT: posterior cingulate perfusion was observed only in 13/20 AD patients and in 5/20 SDAT patients. The index test was not performed in the patients with FTD |
| Le Ber 2006 | Participants: fvFTD patients only; participants with other types of dementia not included. Target condition: not differential diagnosis of FTD vs other types of dementia |
| Lojkowska 2002 | Not having data for constructing a 2 x 2 table. Descriptive analysis reported |
| Mendez 2007 | Insufficient data to complete 2 x 2 tables. Additional data were requested from the trial investigators but no further information was available at the time this review was prepared |
| Miller 1997 | Not having data for constructing a 2 x 2 table. Aim of the study: to assess the of the Lund‐Manchester research (LMRC) criteria for FTD. The initial research question was whether any of the items on the LMRC could reliably distinguish between FTD and AD. A SPECT scan was used as a reference standard not an index test |
| Miller 1999 | Not having data for constructing a 2 x 2 table. Index test: threshold not used. The focus of the study was to evaluate SPECT scans against the presence of right or left frontal or temporal hypoperfusion in participants with FTD |
| Papma 2013 | Not having data for constructing a 2 x 2 table. Index test: threshold not used. The focus of the study was to evaluate SPECT scan hypoperfusion patterns in FTD with and without episodic memory impairment and in early onset of AD dementia |
| Sjogren 2000 | Insufficient data to complete 2 x 2 tables. Additional data were requested from the trial investigators but no further information was available at the time this review was prepared |
| Talbot 1995 | Not having data for constructing a 2 x 2 table. Index test: threshold not used. This study evaluated differences in the patterns of rCBF data between groups |
| Valotassiou 2009 | Not having data for constructing a 2 x 2 table. Index test: threshold not used. The focus of the study was to evaluate the perfusion of specific BA areas of the brain cortex in FTD and AD patients, using NeuroGam processing program |
| Valotassiou 2011 | Not having data for constructing a 2 x 2 table. Participants: SD variant FTD and AD (data extractable for SD vs AD) |
| Valotassiou 2012a | Not having data for constructing a 2 x 2 table. Participants: PNFA variant FTD and AD |
| Valotassiou 2012b | Not having data for constructing a 2 x 2 table. Participants: SD and PNFA variant FTD only |
| Waragai 2008 | Not having data for constructing a 2x 2 table. Target condition: AD dementia not FTD |
FTD=frontotemporal dementia; SPM=Statistical Parametric Maps; PPA=primary progressive aphasia; FTD=frontotemporal dementia; AD=Alzheimer's disease; SPECT=single‐photon emission computerised tomography; bvFTD= behavioural variant frontotemporal degeneration; SD=semantic dementia; PNFA=progressive nonfluent aphasia; CDR=Clinical Dementia Rating scale; FTLD=frontotemporal lobar degeneration; DFT=dementia of frontal type; ; 99mTc‐HMPAO=Technetium exametazime hexamethylpropyleneamine oxime; SDAT=senile dementia Alzheimer's type; fvFTD=frontal variant frontotemporal dementia; PNFA= progressive nonfluent aphasia
Contributions of authors
HAA: designed and drafted protocol; took overall responsibility for study selection and data extraction, and data and analyses tables; checked data entry; assessed QUADAS‐2; updated methods, drafted Results, Findings, Discussion and Authors' conclusions sections, and finalised the review manuscript.
NS: designed and drafted protocol; helped with study selection and data extraction; assessed QUADAS‐2; compiled characteristics of included and excluded studies tables; entered data and checked data entry; set up data and analyses tables; updated Methods section and drafted the Results section; drafted Summary of Findings table; contributed to Discussion section and finalised the review manuscript; managed the review process and produced progress reports, attended progress meetings and worked with all review authors to ensure that the review met publication deadlines.
CJ: helped with study selection and article retrieval, attended progress meetings, drafted manuscript.
RBH: designed and drafted protocol, advised on technical aspects of the review, drafted discussion and finalised review manuscript.
YT: restructured data and analysis tables, constructed analyses to generate forest plots and SROC plots, critically revised and finalised review manuscript.
SC: designed and drafted the protocol, helped with article retrieval and screening, and finalised review manuscript.
EJC: designed and drafted the protocol, helped with article retrieval and screening, took responsibility for study selection, attended progress meetings, drafted discussion and finalised the review manuscript.
Sources of support
Internal sources
No sources of support supplied
External sources
-
NIHR, UK.
This review was supported by the National Institute for Health Research, via a Cochrane Programme Grant to the Cochrane Dementia and Cognitive Improvement group. The views and opinions expressed therein are those of the authors and do not necessarily reflect those of the Systematic Reviews Programme, NIHR, NHS or the Department of Health
Declarations of interest
Hilary A Archer ‐ none known Nadja Smailagic‐ none known Christeena John‐ none known Robin B Holmes‐ none known Yemisi Takwoingi‐ none known Elizabeth J Coulthard‐ none known Sarah Cullum‐ none known
New
References
References to studies included in this review
Boutoleau‐Bretonniere 2012 {published data only}
- Boutoleau‐Bretonniere C, Lebouviera T, Delaroche O, Lamy E, Evrard C, Charriau T, et al. Value of neuropsychological testing, imaging, and CSF biomarkers for the differential diagnosis and prognosis of clinically ambiguous dementia. Journal of Alzheimer’s Disease 2012;28(2):323–36. [DOI] [PubMed] [Google Scholar]
Horn 2007 {published data only}
- Horn JF, Habert MO, Giron A, Fertil B. Alzheimer's disease and frontotemporal dementia differential automatic diagnosis based on SPECT images. Biomedical Imaging: From Nano to Macro, 2007. ISBI 2007. 4th IEEE International Symposium on Biomedical Imaging; 2007 April 12‐15; Arlington, VA, USA. IEEE, 2007:1336‐9.
- Horn JF, Habert MO, Kas A, Malek Z, Maksud P, Lacomblez L, et al. Differential automatic diagnosis between Alzheimer’s disease and frontotemporal dementia based on perfusion SPECT images. Artificial Intelligence in Medicine 2009;47(2):147‐58. [DOI] [PubMed] [Google Scholar]
Launes 1991 {published data only}
- Launes J, Sulkava R, Erkinjuntti T, Nikkinen P, Lindroth L, Liewendahl K, et al. 99Tcm‐HMPAO SPECT in suspected dementia. Nuclear Medicine Communications 1991;12(9):757‐65. [DOI] [PubMed] [Google Scholar]
Lipton 2004 {published data only}
- Lipton AM, Benavidesa R, Hynan LS, Bonte FJ, Harris TS, White CL, et al. Lateralization on neuroimaging does not differentiate frontotemporal lobar degeneration from Alzheimer’s disease. Dementis and Geriatriatric Cognitive Disorders 2004;17(4):324‐7. [DOI] [PubMed] [Google Scholar]
McNeill 2007 {published data only}
- McNeill R, Sare GM, Manoharan M, Testa HJ, Mann DM, Neary D, et al. Accuracy of single‐photon emission computed tomography in differentiating frontotemporal dementia from Alzheimer’s disease. Journal of Neurology, Neurosurgery, and Psychiatry 2007;78(4):350–5. [DOI] [PMC free article] [PubMed] [Google Scholar]
Nagao 2004 {published data only}
- Nagao M, Sugawara Y, Ikeda M, Fukuhara R, Hokoishi K, Murase K, et al. Heterogeneity of cerebral blood flow in frontotemporal lobar degeneration and Alzheimer’s disease. European Journal of Nuclear Medicine and Molecular Imaging 2004;31(2):162‐8. [DOI] [PubMed] [Google Scholar]
Pickut 1997 {published data only}
- Pickut BA, Saerens J, Marien P, Borggreve F, Goeman J, Vandevivere J, et al. Discriminative use of SPECT in frontal lobe‐type dementia versus (senile) dementia of the Alzheimer's type. Journal of Nuclear Medicine 1997;38(6):929‐34. [PubMed] [Google Scholar]
Read 1995 {published data only}
- Read SL, Miller BL, Mena I, Kim R, Itabashi H, Darby A. SPECT in dementia: clinical and pathological correlation. Journal of the American Geriatrics Society 1995;43(11):1243‐7. [DOI] [PubMed] [Google Scholar]
Rollin‐Sillaire 2012 {published data only}
- Rollin‐Silliare A, Bombois S, Deramecourt V, Steinert‐Emptaz A, Salleron J, Morvan J, et al. Contribution of single photon emission computed tomography to the differential diagnosis of dementia in a memory clinic. Journal of Alzheimer's Disease 2012;30(4):833‐45. [DOI] [PubMed] [Google Scholar]
Talbot 1998 {published data only}
- Talbot PR, Lloyd JJ, Snowden JS, Neary D, Testa HJ. A clinical role for 99mTc‐HMPAO SPECT in the investigation of dementia?. Journal of Neurology, Neurosurgery, and Psychiatry 1998;63(3):306–13. [DOI] [PMC free article] [PubMed] [Google Scholar]
Valotassiou 2012 {published data only}
- Valotassiou V, Papatriantafyllou J, Sifakis N, Tzavara C, Tsougos I, Kapsalaki E, et al. Perfusion SPECT studies with mapping of Brodmann areas in differentiating Alzheimer's disease from frontotemporal degeneration syndromes. Nuclear Medicine Communications 2012;33(12):1267‐76. [DOI] [PubMed] [Google Scholar]
- Valotassiou V, Papatriantafyllou J, Sifakis N, Tzvara C, Tsougos J, Kapsalaki E, et al. Brain perfusion SPECT with Brodmann areas mapping in the differential diagnosis of Alzheimer's disease from behavioural variant of frontotemporal lobar degeneration. European Journal of Nuclear Medicine and Molecular Imaging 2011;38(Suppl 2):S260‐441. [Google Scholar]
References to studies excluded from this review
Barnes 2000 {published data only}
- Barnes A, Lusman D, Pattersona J, Brown D, Wyper D. The use of statistical pParametric mapping (SPM96) as a decision aid in the differential diagnosis of dementia using 99mTc‐HMPAO SPECT. Behavioural Neurology 2000;12(1‐2):77‐86. [DOI] [PubMed] [Google Scholar]
Barquero 1996 {published data only}
- Barquero MS, Dominguez M, Encinas M, Barabash A, Cabranes JA, Varela de Seijas E. Primary progressive aphasia: diagnosis and evolution using brain SPECT. Fifth International Conference on Alzheimer's Disease and Related Disorders. Osaka, Japan July 1996. Neurobiology of Aging. 1996; Vol. 17(4), issue 4 Suppl:S92.
Boeve 2012 {published data only}
- Boeve BF, Boylan KB, Graff‐Radford NR, DeJesus‐Hernandez M, Knopman DS, Pedraza O, et al. Characterization of frontotemporal dementia and/or amyotrophic lateral sclerosis associated with the GGGGCC repeat expansion in C9ORF72. Brain 2012;135:765‐83. [DOI] [PMC free article] [PubMed] [Google Scholar]
Bonte 1994 {published data only}
- Bonte F, Tintner R, Weiner M, Bigio E, White C. Histopathological validation of brain blood flow SPECT in the differential diagnosis of the dementias. 39th annual Meeting of the Southwestern Chapter of the Society of Nuclear Medicine. Albuquerque, New Mexico, USA 1994. Clinical Nuclear Medicine. 1994; Vol. 19(3):260.
Bonte 2004 {published data only}
- Bonte FJ, Harris TS, Roney CA, Hynan LS. Differential diagnosis between Alzheimer’s and frontotemporal disease by the posterior cingulate sign. Journal of Nuclear Medicine 2004;45(5):771‐4. [PubMed] [Google Scholar]
Borghesani 2010 {published data only}
- Borghesani PR, DeMers SM, Manchanda V, Pruthi S, Lewis DH, Borson S. Neuroimaging in the clinical diagnosis of dementia: observations from a memory disorders clinic. Journal of the American Geriatrics Society 2010;58(8):1453‐8. [DOI] [PMC free article] [PubMed] [Google Scholar]
Borroni 2010 {published data only}
- Borroni B, Agosti C, Premi E, Cerini C, Cosseddu M, Paghera B, et al. The FTLD‐modified Clinical Dementia Rating scale is a reliable tool for defining disease severity in frontotemporal lobar degeneration: evidence from a brain SPECT study. European Journal of Neurology 2010;17(5):703‐7. [DOI] [PubMed] [Google Scholar]
Borroni 2012 {published data only}
- Borronia B, Grassi M, Premi E, Alberici A, Cosseddu M, Cancelli V, et al. Is long‐term prognosis of frontotemporal lobar degeneration predictable by neuroimaging? Evidence from a single‐subject functional brain study. Journal of Alzheimer's Disease 2012;29(4):883‐90. [DOI] [PubMed] [Google Scholar]
Buchpiguel 1996 {published data only}
- Buchpiguel CA, Mathias SC, Itaya LY, Barros NG, Portela LA, Freitas JM, et al. Brain SPECT in dementia. A clinical‐scintigraphic correlation. Arquivos de Neuro‐psiquiatria 1996;54(3):375‐83. [DOI] [PubMed] [Google Scholar]
Didic 1998 {published data only}
- Didic M, Giusiano B, Laforte C, Ceccaldi M, Poncet M. Identification of clinical subtypes of fronto‐temporal dementia and cerebral blood flow on SPECT: preliminary results. Alzheimer's Reports 1998;1(3):179‐85. [Google Scholar]
Frisoni 1992 {published data only}
- Frisoni GB, Bianchetti A, Pizzolato G, Ferlin G, L Battistin L, Trabucchi M. Functional imaging (99mTc‐HMPAO SPECT) and clinical findings in the differentiation of Alzheimer's disease and dementia of frontal type. Third International Conference on Alzheimer's disease and related disorders. Abano Terme, Italy, July 1992. Neurobiol Aging. 1992; Vol. 13 Suppl 1:S16.
Frisoni 1995 {published data only}
- Frisoni GB, Pizzolato G, Geroldi C, Rossato A, Bianchetti A, Trabucchi M. Dementia of the frontal type: neuropsychological and [99Tc]‐HM‐PAO SPET features. Journal of Geriatric Psychiatry and Neurology 1995;8(1):42‐8. [PubMed] [Google Scholar]
Grace 2001 {published data only}
- Grace J, Zawacki TM, Ott BR, Boyle P, Noto R. Behavioral, neuropsychological, and SPECT correlates of frontal lobe functioning in dementia. Brain and Cognition. 2001; Vol. 47, issue 1‐2:279‐82.
Hannequin 2001 {published data only}
- Hannequin D, Lefevre MHS, Bakchine S, Kotzki PO, Vera P. Primary progressive aphasia: a bilateral temporal lobe involvment. Neurology. 2001; Vol. 56, issue Suppl 3:A189.
Hogh 2004 {published data only}
- Hogh P, Teller AS, Hasselbalch SG, Waldemar G. Clinical progression of MCI or questionable dementia and predictive value of HMPAO‐SPECT: Follow‐up study of 115 patients from a multidisciplinary memory clinic based in neurology.. 9th International Conference on Alzheimer's Disease and Related Disorders. Philadelphia, USA July 2004. Neurobiology of Aging. 2004; Vol. 25 Suppl 2:S272.
Honda 2002 {published data only}
- Honda N, Machida K, Hosono M, Matsumoto T, Matsuda H, Oshima M, et al. Interobserver variation in diagnosis of dementia by brain perfusion SPECT. Radiation Medicine 2002;20(6):281‐9. [PubMed] [Google Scholar]
Joseph 2006 {published data only}
- Josephs KA, Duffy JR, Strand EA, Whitwell JL, Layton KF, Parisi JE, et al. Clinicopathological and imaging correlates of progressive aphasia and apraxia of speech. Brain 2006;129(Pt 6):1385‐98. [DOI] [PMC free article] [PubMed] [Google Scholar]
Julin 1995 {published data only}
- Julin P, Wahlund LO, Basun H, Persson A, Måre K, Rudberg U. Clinical diagnosis of frontal lobe dementia and Alzheimer’s disease: relation to cerebral perfusion, brain atrophy and electroencephalography. Dementia 1995;6(3):142‐7. [DOI] [PubMed] [Google Scholar]
Kaneko 2004 {published data only}
- Kaneko K, Kuwabara Y, Sasaki M, Ogomori K, Ichimiya A, Koga H, et al. Posterior cingulate hypoperfusion in Alzheimer’s disease, senile dementia of Alzheimer type, and other dementias evaluated by three‐dimensional stereotactic surface projections using Tc‐99m HMPAO SPECT. Clinical Nuclear Medicine 2004;29(6):362‐6. [DOI] [PubMed] [Google Scholar]
Le Ber 2006 {published data only}
- Ber I, Guedj E, Gabelle A, Verpillat P, Volteau M, Thomas‐Anterion C, et al. Demographic, neurological and behavioural characteristics and brain perfusion SPECT in frontal variant of frontotemporal dementia. Brain 2006;129(Pt 11):3051‐65. [DOI] [PubMed] [Google Scholar]
Lojkowska 2002 {published data only}
- Lojkowska W, Ryglewicza D, Jedrzejczak T, Sienkiewicz‐Jarosz H, Minc S, Jakubowska T, et al. SPECT as a diagnostic test in the investigation of dementia. Journal of the Neurological Sciences 2002;203‐204:215‐9. [DOI] [PubMed] [Google Scholar]
Mendez 2007 {published data only}
- Mendez MF, Shapira JS, McMurtray A, Licht E, Miller BL. Accuracy of the clinical evaluation for frontotemporal dementia. Archives of Neurology 2007;64(6):830‐5. [DOI] [PubMed] [Google Scholar]
Miller 1997 {published data only}
- Miller BL, Ikonte C, Ponton M, Levy M, Boone K, Darby A, et al. A study of the Lund‐Manchester research criteria for frontotemporal dementia: clinical and single‐photon emission CT correlations. Neurology 1997;48(4):937‐42. [DOI] [PubMed] [Google Scholar]
Miller 1999 {published data only}
- Miller BL, Gearhart R. Neuroimaging in the diagnosis of frontotemporal dementia. Dementia and Geriatric Cognitive Disorders 1999;10(Suppl 1):71‐4. [DOI] [PubMed] [Google Scholar]
Papma 2013 {published data only}
- Papma JM, Seelaar H, Koning I, Hasan D, Reijs A, Valkema R, et al. Episodic memory impairment in frontal dementia; A 99mTc‐HMPAO SPECT study. Current Alzheimer Research 2013;10(3):332‐9. [DOI] [PubMed] [Google Scholar]
Sjogren 2000 {published data only}
- Sjögren M, Gustafson L, Wikkelsö C, Wallin A. Frontotemporal dementia can be distinguished from Alzheimer’s disease and subcortical white matter dementia by an anterior‐to‐posterior rCBF‐SPET ratio. Dementia and Geriatric Cognitive Disorders 2000;11(5):275‐85. [DOI] [PubMed] [Google Scholar]
Talbot 1995 {published data only}
- Talbot PR, Snowden JS, Lloyd JJ, Neary D, Testa HJ. The contribution of single photon emission tomography to the clinical differentiation of degenerative cortical brain disorders. Journal of Neurology 1995;242(9):579‐86. [DOI] [PubMed] [Google Scholar]
Valotassiou 2009 {published data only}
- Valotassiou V, Papatriantafyllou J, Sifakis N, Karageorgiou C, Tsougos I, Tzavara C, et al. Evaluation of brain perfusion in specific Brodmann areas in frontotemporal dementia and Alzheimer disease using automated 3‐D voxel based analysis. Journal of Instrumentation 2009;4:doi:10.1088/1748‐0221/4/05/P05020. [Google Scholar]
Valotassiou 2011 {published data only}
- Valotassiou V, Papatriantafyllou J, Sifakis N, Tzavara C, Tsougos J, Psimadas D, et al. Evaluation of perfusion differences in semantic dementia and Alzheimer's disease using Tc‐99m‐HMPAO SPECT with automated Brodmann areas mapping. European Journal of Nuclear Medicine and Molecular Imaging 2011;38(Suppl 2):S323. [Google Scholar]
Valotassiou 2012a {published data only}
- Valotassiou V, Papatriantafyllou J, Sifakis N, Tzavara C, Tsougos J, Psimadas D, et al. Alzheimer's disease and progressive non‐fluent aphasia: evaluation of perfusion differences using 99mTc‐HMPAO SPECT and Brodmann areas mapping.. 25th Annual Congress of the European Association of Nuclear Medicine (EANM) Milan Italy Oct 2012. European Journal of Nuclear Medicine and Molecular Imaging. 2012; Vol. 39 (Suppl 2):S547.
Valotassiou 2012b {published data only}
- Valotassiou V, Papatriantafyllou J, Sifakis N, Tzavara C, Tsougos J, Psimadas D, et al. Patterns of perfusion deficit in semantic dementia and progressive non‐fluent aphasia: a Tc‐99m‐HMPAO SPECT study with Brodmann areas mapping. 25th Annual Congress of the European Association of Nuclear Medicine (EANM) Milan Italyn Oct 2012. European Journal of Nuclear Medicine and Molecular Imaging. 2012; Vol. 39(Suppl 2):S547.
Waragai 2008 {published data only}
- Waragai M, Mizumura S, Yamada T, Matsuda H. Differentiation of early‐stage Alzheimer’s disease from other types of dementia using brain perfusion single photon emission computed tomography with easy Z‐score imaging system analysis. Dementia and Geriatric Cognitive Disorders 2008;26(6):547‐55. [DOI] [PubMed] [Google Scholar]
Additional references
Alzheimer's Disease International 2010
- Alzheimer's Disease International. World Alzheimer report 2010. The global economic impact of dementia. www.alz.co.uk/research/files/WorldAlzheimerReport2010.pdf 2010 (accessed 14 May 2015).
Alzheimer's Society 2007
- Alzheimer's Society. Dementia UK 2007. www.alzheimers.org.uk/site/scripts/download_info.php?fileID=2 2007 (accessed 14 May 2015).
American Psychiatric Association 2013
- American Psychiatric Association. Diagnostic and Statistical Manual of Mental Disorders, Fifth Edition. http://dsm.psychiatryonline.org//book.aspx?bookid=556 2013 (accessed 14 May 2015).
Ball 1997
- Ball MG, Braak H, Coleman P, Dickson D, Duyckaerts C, Gambetti P, et al. Consensus recommedations for the postmortem diagnosis of Alzheimer's disease: The National Institute on Aging, and Reagan Institute Working Group on Diagnostic Criteria for the Neuropathological Assessment of Alzheimer's Disease. neurobiology of Aging 1997;18:S1‐S2. [PubMed] [Google Scholar]
Brun 1994
- Brun A, England B, Gustafson L, et al. Clinical and neuropathological criteria for frontotempora;l dementia. Journal of Neurology, Neurosurgery and Psychiatry 1994;57:416‐8. [DOI] [PMC free article] [PubMed] [Google Scholar]
Cairns 2007
- Cairns NG, Bigio EH, Mackenzie IR, Neumann M, Lee VM, Hatanpaa KJ, et al. Consortium for Frontotemporal Lobar Degeneration.Neuropathologic diagnostic and nosologic criteria for frontotempolar lobar degeneration: Consensus of the consortium for frontotemporal lobar degeneration. Acta Neuropathologica 2007;114:5‐22. [DOI] [PMC free article] [PubMed] [Google Scholar]
Catafau 2001
- Catafau AM. Brain SPECT in clinical practice. Part I: perfusion. Journal of Nuclear Medicine 2001;42(2):259‐71. [PubMed] [Google Scholar]
Chui 1992
- Chui HC, Victoroff JI, Margolin D, Jagust W, Shankle R, Katzman R. Criteria for the diagnosis of ischemic vascular dementia proposed by the State of California Alzheimer's Disease Diagnostic and Treatment Centers. Neurology 1992;42(3 Pt 1):473‐80. [DOI] [PubMed] [Google Scholar]
Chung 2000
- Chung HW, Huang YH. Fractal analysis of nuclear medicine images for the diagnosis of pulmonary emphysema:interpretations, implications, and limitations. American Journal of Roentgenology 2000;174:1055‐9. [DOI] [PubMed] [Google Scholar]
Davis 2013
- Davis DHJ, Creavin ST, Noel‐Storr A, Quinn TJ, Smailagic N, Hyde C, et al. Neuropsychological tests for the diagnosis of Alzheimer’s disease dementia and other dementias: a generic protocol for cross‐sectional and delayed‐verification studies. Cochrane Database of Systematic Reviews 2013, Issue 3. [DOI: 10.1002/14651858.CD010460] [DOI] [PMC free article] [PubMed] [Google Scholar]
Ferri 2005
- Ferri CP, Prince M, Brayne C, Brodaty H, Fratiglioni L, Ganguli M, et al. Global prevalence of dementia: a Delphi consensus study. Lancet 2005;366(9503):2112‐7. [DOI] [PMC free article] [PubMed] [Google Scholar]
Geslani 2005
- Geslani DM, Tierney MC, Herrmann N, Szalai JP. Mild cognitive impairment: an operational definition and its conversion rate to Alzheimer's disease. Dementia and Geriatric Cognitive Disorders 2005;19(5‐6):383‐9. [DOI] [PubMed] [Google Scholar]
Gibb 1989
- Gibb WR, Luthert PJ, Marsden CD. Corticobasal degeneration. Brain 1989;112:1171‐92. [DOI] [PubMed] [Google Scholar]
Glanville 2010
- Glanville JM, Cikalo M, Crawford F, Dozier M, Lowson P. Handsearching for reports of diagnostic test accuracy studies: adding to the evidence base. Oral presentation at the Joint Cochrane and Campbell Colloquium; 2010 Oct 18‐22; Keystone, Colorado, USA [abstract]. CMR Metodologia Cochrane ID:CMR 15328. 2010; Vol. Suppl:48.
Hendrie 1988
- Hendrie HC, Hall KS, Brittain HM, Austrom MG, Farlow M, Parker J, et al. The CAMDEX: a standardized instrument for the diagnosis of mental disorder in the elderly: a replication with a US sample. Journal of the American Geriatrics Society 1988;36(5):402‐8. [DOI] [PubMed] [Google Scholar]
Hokoishi 2001
- Hokoishi K, Ikeda M, Maki N, et al. Frontotemporal lobar degeneration: a study in Japan. Dementia and Geriatric Cognitive Disorders 2001;12:393‐9. [DOI] [PubMed] [Google Scholar]
Hughes 2001
- Hughes AJ, Daniel SE, Lees AJ. Improved accuracy of clinical diagnosis of Lewy body Parkinson's disease. Neurology 2001;57:1497‐99. [DOI] [PubMed] [Google Scholar]
Juni 2009
- Juni JE, Waxman AD, Devous MD Sr, Tikofsky RS, Ichise M, Heertum RL, et al. Procedure guideline for brain perfusion SPECT using (99m)Tc radiopharmaceuticals 3.0. Journal of Nuclear Medicine Technology 2009;37(3):191‐5. [DOI] [PubMed] [Google Scholar]
Kapucu 2009
- Kapucu OL, Nobili F, Varrone A, Booij J, Vander Borght T, Någren K, et al. EANM procedure guideline for brain perfusion SPECT using 99mTc‐labelled radiopharmaceuticals, version 2. European Journal of Nuclear Medicine and Molecular Imaging 2009;36(12):2093‐102. [DOI] [PubMed] [Google Scholar]
Knopman 2001
- Knopman DS, DeKosky ST, Cummings JL, Chui H, Corey‐Bloom J, Relkin N, et al. Practice parameter: diagnosis of dementia (an evidence‐based review). Report of the Quality Standards Subcommittee of the American Academy of Neurology. Neurology 2001;56(9):1143‐53. [DOI] [PubMed] [Google Scholar]
Litvan 1996
- Litvan I, Agid Y, Calne D, Campbell G, Dubois B, Duvoisin RC, et al. Clinical research criteria for the diagnosis of progressive supranuclear palsy (Steele‐Richardson‐Olszewski syndrome): Report of the NINDS‐SPSP international workshop. Neurology 1996;47:1‐9. [DOI] [PubMed] [Google Scholar]
Lund and Manchester Groups 1994
- Clinical and neuropathological criteria forfrontotemporal dementia. The Lund and Manchester Groups. Journal of Neurology, Neurosurgery, and Psychiatry 1994;57(4):416‐8. [DOI] [PMC free article] [PubMed] [Google Scholar]
Mackenzie 2010
- Mackenzie IRA, Neumann M, Bigio EH, Cairns NG, Alafuzoff I, Kril J, et al. Nomenclature and nosology for neuropathologic subtypes of frontotemporal lobar degeneration: an update. Acta Neuropathologica 2010;119(1):1‐4. [DOI] [PMC free article] [PubMed] [Google Scholar]
Mackenzie 2011
- Mackenzie IR, Neumann M, Baborie A, Sampathu DM, Du Plessis D, Jaros E, et al. A harmonized classification system for FTLD‐TDP pathology. Acta Neuropathologica 2011;122(1):111‐3. [DOI] [PMC free article] [PubMed] [Google Scholar]
Mahoney 2012
- Mahoney CJ, Beck J, Rohrer JD, Lashley T, Mok K, Shakespeare T, et al. Frontotemporal dementia with the C9ORF72 hexanucleotide repeat expansion: clinical, neuroanatomical and neuropathological features. Brain 2012;135(Pt 3):736‐50. [DOI] [PMC free article] [PubMed] [Google Scholar]
Mann 1993
- Mann DMA, South PW. The topographic distributaion of brain atrophy in frontal lobe dementia. Acta Neuropathologica 1993;85:334‐40. [DOI] [PubMed] [Google Scholar]
Matthews 2009
- Matthews FE, Brayne C, Lowe J, McKeith I, Wharton SB, Ince P. Epidemiological pathology of dementia: attributable‐risks at death in the Medical Research Council Cognitive Function and Ageing Study. PLoS Medicine 2009;6(11):e1000180. [DOI] [PMC free article] [PubMed] [Google Scholar]
McKeith 2005
- McKeith IG, Dickson DW, Lowe J, Emre M, O' Brien JT, Feldman H, et al. Diagnosis and management of dementia with Lewy bodies: Third report of the DLB Consortium. Neurology 2005;65:1863‐72. [DOI] [PubMed] [Google Scholar]
McKhann 1984
- McKhann G, Drachman D, Folstein M, Katzman R, Price D, Stadlan EM. Clinical diagnosis of Alzheimer's disease: report of the NINCDS‐ADRDA Work Group under the auspices of Department of Health and Human Services Task Force on Alzheimer's Disease. Neurology 1984;34(7):939‐44. [DOI] [PubMed] [Google Scholar]
McKhann 2001
- McKhann GM, Albert MS, Grossman M, Miller B, Dickson D, Trojanowski JQ, et al. Clinical and pathological diagnosis of frontotemporal dementia: report of the Work Group on Frontotemporal Dementia and Pick's Disease. Archives of Neurology 2001;58(11):1803‐9. [DOI] [PubMed] [Google Scholar]
McKhann 2011
- McKhann GM, Knopman DS, Chertkow H, Hyman BT, Jack CR Jr, Kawas CH, et al. The diagnosis of dementia due to Alzheimer's disease: recommendations from the National Institute on Aging‐Alzheimer's Association workgroups on diagnostic guidelines for Alzheimer's disease. Alzheimer's & Dementia 2011;7(3):263‐9. [DOI] [PMC free article] [PubMed] [Google Scholar]
Mirra 1991
- Mirra SS, Heyman A, McKeel D, Sumi SM, Crain BJ, Brownlee LM, et al. The Consortium to Establish a Registry for Alzheimer's Disease (CERAD). Part II. Standardization of the neuropathologic assessment of Alzheimer's disease. Neurology 1991;41(4):479‐86. [DOI] [PubMed] [Google Scholar]
Moher 2009
- Moher D, Liberati A, Tetzlaff J, Altman DG, PRISMA Group. Preferred reporting items for systematic reviews and meta‐analyses: the PRISMA statement. Annals of Internal Medicine 2009;151(4):264‐9. [DOI] [PubMed] [Google Scholar]
MRC CFAS 2001
- Neuropathology Group of the Medical Research Council Cognitive Function and Ageing Study. Pathological correlates of late‐onset dementia in a multicentre, community‐based population in England and Wales. Neuropathology Group of the Medical Research Council Cognitive Function and Ageing Study (MRC CFAS). Lancet 2001;357(9251):169‐75. [DOI] [PubMed] [Google Scholar]
Nagao 2002
- Nagao M, Murase K. Measurement of heterogeneous distribution on Technegas SPECT images by three‐dimensional fractal analysis. Annals of Nuclear medicine 2002;16(6):369‐76. [DOI] [PubMed] [Google Scholar]
NAO 2007
- National Audit Office. Improving services and support for people with dementia. http://www.nao.org.uk/wp‐content/uploads/2007/07/0607604.pdf 4 July 2007 (accessed 14 May 2015).
Neary 1986
- Neary D, Snowden JS, Bowen DM, et al. Neuropsychological syndromes in presenile dementia due to cerebral atrophy. Journal of Neurology, neurosurgery, and Psychiatry 1986;49:163‐74. [DOI] [PMC free article] [PubMed] [Google Scholar]
Neary 1998
- Neary D, Snowden JS, Gustafson L, Passant U, Stuss D, Black S, et al. Frontotemporal lobar degeneration: a consensus on clinical diagnostic criteria. Neurology 1998;51(6):1546‐54. [DOI] [PubMed] [Google Scholar]
NICE 2006
- National Institute for Health and Care Excellence. Dementia: supporting people with dementia and their carers in health and social care. Clinical guidelines CG42.. http://guidance.nice.org.uk/CG42/NICEGuidance/pdf/English November 2006 (accessed 14 May 2015).
Okello 2009
- Okello A, Koivunen J, Edison P, Archer HA, Turkhemer FE, Nagren K, et al. Conversion of amyloid positive and negative MCI to AD over 3 years: an 11C‐PIB PET study. Neurology 2009;73(10):754‐60. [DOI] [PMC free article] [PubMed] [Google Scholar]
Rascovsky 2007
- Rascovsky K, Hodges JR, Kipps CM, Johnson JK, Seeley WW, Mendez MF, et al. Diagnostic criteria for the behavioral variant of frontotemporal dementia (bvFTD): current limitations and future directions.. Alzheimer Disease and Associated Disorders 2007;21(4):S14‐8. [DOI] [PubMed] [Google Scholar]
Rascovsky 2011
- Rascovsky K, Hodges JR, Knopman D, Mendez MF, Kramer JH, Neuhaus J, et al. Sensitivity of revised diagnostic criteria for the behavioural variant of frontotemporal dementia. Brain 2011;134(Pt 9):2456‐77. [DOI] [PMC free article] [PubMed] [Google Scholar]
Ratnavalli 2002
- Ratnavalli E, Brayne C, Dawson K, Hodges JR. The prevalence of frontotemporal dementia. Neurology 2002;58(11):1615‐21. [DOI] [PubMed] [Google Scholar]
Review Manager 2013 [Computer program]
- The Nordic Cochrane Centre, The Cochrane Collaboration. Review Manage (RevMan). Version 5.2. Copenhagen: The Nordic Cochrane Centre, The Cochrane Collaboration, 2013.
Román 1993
- Román GC, Tatemichi TK, Erkinjuntti T, Cummings JL, Masdeu JC, Garcia JH, et al. Vascular dementia: diagnostic criteria for research studies. Report of the NINDS‐AIREN International Workshop. Neurology 1993;43(2):250‐60. [DOI] [PubMed] [Google Scholar]
Savva 2009
- Savva GM, Wharton SB, Ince PG, Forster G, Matthews FE, Brayne C. Age, neuropathology, and dementia. The New England Journal of Medicine 2009;360(22):2302‐9. [DOI] [PubMed] [Google Scholar]
Seelaar 2011
- Seelaar H, Rohrer JD, Pijnenburg YA, Fox NC, Swieten JC. Clinical, genetic and pathological heterogeneity of frontotemporal dementia: a review. Journal of Neurology, Neurosurgery, and Psychiatry 2011;82(5):476‐86. [DOI] [PubMed] [Google Scholar]
Shi 2005
- Shi J, Shaw CL, Richardson AMT, et al. Hystopathological changes underlying frontotemporal lobar degeneration with clinicopathological correlation. Acta Neuropathologica 2005;110:501‐12. [DOI] [PubMed] [Google Scholar]
Steinling 1988
- Steinling M, Mazingue A, Kassiotis P, Gaudet Y, Fialdes P, Duhamel A, et al. MmPaO TC as an indicator of local cerebral blood flow: Quantfied study compared to xenon 133 inhalation method. Annals of Radiology 1988;31:229‐38. [PubMed] [Google Scholar]
Steinling 1989
- Steinling M, Leys D, Amagassi F, Soetart G, Vernes R. Can Alzheimer and multi infarct dementia be differentiated using 99m‐Tc‐HMPAO tomograms. In: Circulation cerebrale et viellissement, G Geraud‐A Bes, Eds.John Libbey Eurotext 1989:291‐4. [Google Scholar]
Visser 2006
- Visser PJ, Kester A, Jolles J, Verhey F. Ten‐year risk of dementia in subjects with mild cognitive impairment. Neurology 2006;67(7):1201‐7. [DOI] [PubMed] [Google Scholar]
Whiting 2011
- Whiting P, Westwood M, Beynon R, Burke M, Sterne JA, Glanville J. Inclusion of methodological filters in searches for diagnostic test accuracy studies misses relevant studies. Journal of Clinical Epidemiology 2011;64(6):602‐7. [DOI] [PubMed] [Google Scholar]
WHO 2010
- World Health Organization. International Classification of Diseases and Related Health Problems 10th revision (ICD‐10). http://www.who.int/entity/classifications/icd/ICD10Volume2_en_2010.pdf 2010 (accessed 14 May 2015).