

Abstract
Background
Policies and protocols for fetal surveillance in the pregnancy where impaired fetal growth is suspected vary widely, with numerous combinations of different surveillance methods.
Objectives
To assess the effects of antenatal fetal surveillance regimens on important perinatal and maternal outcomes.
Search methods
We searched the Cochrane Pregnancy and Childbirth Group's Trials Register (29 February 2012).
Selection criteria
Randomised and quasi‐randomised trials comparing the effects of described antenatal fetal surveillance regimens.
Data collection and analysis
Review authors R Grivell and L Wong independently assessed trial eligibility and quality and extracted data.
Main results
We included one trial of 167 women and their babies. This trial was a pilot study recruiting alongside another study, therefore, a separate sample size was not calculated. The trial compared a twice‐weekly surveillance regimen (biophysical profile, nonstress tests, umbilical artery and middle cerebral artery Doppler and uterine artery Doppler) with the same regimen applied fortnightly (both groups had growth assessed fortnightly). There were insufficient data to assess this review's primary infant outcome of composite perinatal mortality and serious morbidity (although there were no perinatal deaths) and no difference was seen in the primary maternal outcome of emergency caesarean section for fetal distress (risk ratio (RR) 0.96; 95% confidence interval (CI) 0.35 to 2.63). In keeping with the more frequent monitoring, mean gestational age at birth was four days less for the twice‐weekly surveillance group compared with the fortnightly surveillance group (mean difference (MD) ‐4.00; 95% CI ‐7.79 to ‐0.21). Women in the twice‐weekly surveillance group were 25% more likely to have induction of labour than those in the fortnightly surveillance group (RR 1.25; 95% CI 1.04 to 1.50).
Authors' conclusions
There is limited evidence from randomised controlled trials to inform best practice for fetal surveillance regimens when caring for women with pregnancies affected by impaired fetal growth. More studies are needed to evaluate the effects of currently used fetal surveillance regimens in impaired fetal growth.
Keywords: Female; Humans; Pregnancy; Fetal Growth Retardation; Fetal Growth Retardation/diagnostic imaging; Fetal Monitoring; Fetal Monitoring/methods; Middle Cerebral Artery; Middle Cerebral Artery/diagnostic imaging; Pilot Projects; Randomized Controlled Trials as Topic; Ultrasonography, Prenatal; Umbilical Arteries; Umbilical Arteries/diagnostic imaging
Plain language summary
Testing in pregnancy when there is poor growth of the baby
A baby may not grow at the predicted rate during pregnancy and be born with a low birthweight. This can result in problems for both mother and baby. When poor growth of the baby is suspected during pregnancy, antenatal care includes a combination of tests that are carried out at regular intervals to assess the health of the developing baby. Based on knowledge of the progressive changes any deterioration in the baby’s condition can be detected, which allows optimal timing of the birth so that the baby is in the best condition possible. The specified frequency and combinations of tests varies with local and personal policies. Tests may include fetal movement monitoring, fetal heart rate, growth scans, Doppler ultrasound to measure blood flow, and changes in fetal heart rate with movement to check for possible stillbirth.
The review authors identified only one controlled trial, from New Zealand. This trial randomised 167 women who were between 24 and 36 weeks' pregnant where ultrasound showed a small‐for‐gestational‐age baby. They received a set combination of tests either twice‐weekly or fortnightly. With more frequent testing, women were 25% more likely to have induced labour. Overall their babies were born four days earlier than in the fortnightly surveillance group where spontaneous onset of labour was more likely to occur. The mean gestational age at birth was just under 38 weeks in the twice‐weekly group and just over 38 weeks in the fortnightly group, which was unlikely to have an impact on the health of the newborn. The number of caesarean sections, either for fetal distress or because of failure of induction, was no different. No information was available on length of antenatal hospital admission or operative vaginal births and infants were not followed up to determine neurodevelopment and cerebral palsy. This study excluded pregnancies with abnormal Doppler studies and disorders of the amniotic fluid. More studies are needed and the women’s views on the testing are also important.
Background
Description of the condition
Impaired fetal growth is a disturbance of normal growth, resulting in a baby that does not grow to its potential. Impaired growth may be due to maternal complications (such as high blood pressure or hypertension), fetal complications (including structural or chromosomal problems) or problems with placental development (which is the most common cause of impaired growth) (Baschat 2006). It can be difficult to accurately differentiate between the constitutionally small baby and one with impaired growth when compared with its potential.
There are numerous definitions for growth of the baby in pregnancy. An infant with low birthweight for gestation is classified as very small‐for‐gestational age (SGA) (less than 3rd percentile) or SGA (less than 10th percentile). SGA includes both those babies that have not reached their growth potential (through growth impairment) and also those babies that are constitutionally small. A baby may be of normal birthweight but still significantly lighter than its genetic growth potential (Baschat 2006).
When impaired fetal growth is suspected in pregnancy, ultrasound may be ordered to assess growth with various standard measurements. These include the abdominal circumference, biparietal diameter, head circumference and femur (upper leg) length, which can then be used to estimate the fetal weight. Ultrasound allows these measurements to be plotted against known population percentile lines on a growth curve to assess severity and timing of growth restriction. Sequential ultrasounds can also allow identification of the baby who begins pregnancy on a certain percentile and then crosses the percentile lines because of impaired growth.
Impaired growth is associated with increased risk of complications for the baby, including perinatal death (Baschat 2001; Gardosi 1998), adverse neurological outcomes (such as cerebral palsy) and poor long‐term neurodevelopmental outcomes (Yanney 2004). There may also be an association with adverse health events in adult life (such as obesity, type 2 diabetes and high blood pressure).
Optimal management of growth restriction has three main aspects: identification of the baby at risk in the general population (pregnancy risk factors may be of assistance); confirmation of the diagnosis of impaired fetal growth and distinction from the healthy small baby; and ongoing care, culminating in decisions about mode and timing of birth (Baschat 2005; Breeze 2007).
Description of the intervention
After a baby has been identified with impaired growth in‐utero, antenatal care providers may adopt a variety of methods to monitor the well‐being of the baby. The choice of monitoring technique and the frequency of monitoring varies considerably, but may be influenced by the severity of the growth impairment.
Antenatal surveillance aims to provide information about the health of the baby while in the uterus. Decisions based on the results of that surveillance may in turn reduce the risks to both the baby and the mother associated with impaired growth.
There are a number of tests that may be used in clinical practice, alone or in combination, to identify the baby at risk of growth restriction. These include clinical estimation of the baby's size by palpating the woman's abdomen, ultrasound assessment of baby's growth, fetal movement counting, fetal heart rate assessment (cardiotocography), ultrasound assessment of the baby's well‐being by biophysical profile testing, and assessment of the blood flow through the placenta and various blood vessels in the baby (called Doppler velocimetry). The use of some of these tests alone are the subject of other Cochrane reviews (Alfirevic 2010; Grivell 2010; Lalor 2008). The scope of this review is to examine these surveillance methods when used together in different combinations or at different intervals.
How the intervention might work
By increasing the frequency of monitoring a woman's baby during pregnancy, or using different methods of surveillance in combination, it may be possible to identify the baby who would benefit from earlier birth. This in turn, may be associated with improved health outcomes for the baby.
Why it is important to do this review
Once a baby has been identified as having impaired growth, the appropriate methods and frequency of surveillance is uncertain. Currently, there is considerable variation, based on local hospital policies, and individual practitioner preferences. This systematic review assesses the benefits and harms associated with different combinations of surveillance methods.
Objectives
To assess the benefits and harms associated with different methods of antenatal surveillance for the baby identified with impaired growth.
Methods
Criteria for considering studies for this review
Types of studies
Published and unpublished randomised and quasi‐randomised trials evaluating the effects of one or more described antenatal fetal surveillance regimens. Studies which compare a particular regimen with 'standard care' were only included if standard care involved what this review has defined as a regimen. We did not include studies that compared with no specific surveillance.
Types of participants
Women with pregnancies deemed by the investigators to be affected by impaired fetal growth or fetal growth restriction. (The minimum requirement for this review is an estimated fetal weight of less than 10th percentile or abdominal circumference less than 10th percentile, using local intrauterine growth charts.)
Types of interventions
Described antenatal fetal surveillance regimens. A regimen for the purpose of the review was two or more surveillance methods. Each surveillance method was performed at a specified interval. Possible surveillance methods to be included: fetal movement monitoring, cardiotocography, biophysical profile, Doppler ultrasound of the umbilical artery and fetal venous and arterial circulation (ductus venosus or middle cerebral artery). For the purpose of the review, we expected a study to randomise women to different regimens of surveillance (i.e. different combinations of surveillance methods or applying surveillance methods at different intervals).
Types of outcome measures
Clinically relevant outcomes were prespecified through discussion and agreement among the review authors.
Primary outcomes
Infant
Perinatal mortality and serious neonatal morbidity, as defined by the trial authors
Maternal
Emergency caesarean section for fetal distress
Secondary outcomes
Infant
Stillbirth
Neonatal death
Hypoxic ischaemic encephalopathy
Admission to neonatal special care or intensive care unit
Gestational age at birth
Low birthweight for gestation at birth (as defined by individual trial)
Birthweight
Preterm birth
Low Apgar scores at five minutes (as defined by trial)
Cord blood acidosis
Metabolic acidosis or lactic acidosis
Respiratory distress syndrome
Use of ventilatory support
Use of inotropic support
Necrotising enterocolitis
Grade III or IV intraventricular haemorrhage
Duration of neonatal hospital stay
Longer‐term neurodevelopmental outcomes
Cerebral palsy
Maternal
Antenatal hospital admission
Induction of labour
Caesarean section
Operative vaginal delivery
Womens views of care
Use of healthcare services
For infant: length of stay in neonatal special care or intensive care unit
For mother: length of antenatal hospital admission
Costs of monitoring
Search methods for identification of studies
Electronic searches
We searched the Cochrane Pregnancy and Childbirth Group’s Trials Register by contacting the Trials Search Co‐ordinator (29 February 2012).
The Cochrane Pregnancy and Childbirth Group’s Trials Register is maintained by the Trials Search Co‐ordinator and contains trials identified from:
monthly searches of the Cochrane Central Register of Controlled Trials (CENTRAL);
weekly searches of MEDLINE;
weekly searches of EMBASE;
handsearches of 30 journals and the proceedings of major conferences;
weekly current awareness alerts for a further 44 journals plus monthly BioMed Central email alerts.
Details of the search strategies for CENTRAL, MEDLINE and EMBASE, the list of handsearched journals and conference proceedings, and the list of journals reviewed via the current awareness service can be found in the ‘Specialized Register’ section within the editorial information about the Cochrane Pregnancy and Childbirth Group.
Trials identified through the searching activities described above are each assigned to a review topic (or topics). The Trials Search Co‐ordinator searches the register for each review using the topic list rather than keywords.
We did not apply any language restrictions.
Data collection and analysis
Selection of studies
Two review authors independently assessed for inclusion all the potential studies we identified as a result of the search strategy. We resolved any disagreement through discussion or, if required, we consulted a third review author.
Data extraction and management
We designed a form to extract data. Two review authors (R Grivell and L Wong) extracted the data independently using the agreed form. We resolved discrepancies through discussion. We entered data into the Review Manager software (RevMan 2011) and checked for accuracy.
When information regarding any of the above was unclear, we attempted to contact the authors of the original reports to provide further details.
For the methods used when assessing methodological quality of trials identified in the previous version of this review, seeAppendix 1
For this update we used the following methods for assessing the methodological quality of trials.
Assessment of methodological quality of included studies
Two review authors independently assessed risk of bias for the one included study using the criteria outlined in the Cochrane Handbook for Systematic Reviews of Interventions (Higgins 2011). We resolved any disagreement by discussion or by involving a third assessor.
(1) Sequence generation (checking for possible selection bias)
We described for the included study the method used to generate the allocation sequence in sufficient detail to allow an assessment of whether it should produce comparable groups.
We assessed the method as:
low risk of bias (any truly random process, e.g. random number table; computer random number generator);
high risk of bias (any non‐random process, e.g. odd or even date of birth; hospital or clinic record number);
unclear risk of bias.
(2) Allocation concealment (checking for possible selection bias)
We described for the included study the method used to conceal allocation to interventions prior to assignment and assessed whether intervention allocation could have been foreseen in advance of, or during recruitment, or changed after assignment.
We assessed the methods as:
low risk of bias (e.g. telephone or central randomisation; consecutively numbered sealed opaque envelopes);
high risk of bias (open random allocation; unsealed or non‐opaque envelopes, alternation; date of birth);
unclear risk of bias.
(3.1) Blinding of participants and personnel (checking for possible performance bias)
We described for the included study the methods used, if any, to blind study participants and personnel from knowledge of which intervention a participant received. We considered that studies would be judged to be at low risk of bias if they were blinded, or if we judged that the lack of blinding would be unlikely to affect results. We planned to assess blinding separately for different outcomes or classes of outcomes.
We assessed the methods as:
low, high or unclear risk of bias for participants;
low, high or unclear risk of bias for personnel.
(3.2) Blinding of outcome assessment (checking for possible detection bias)
We described for the included study the methods used, if any, to blind outcome assessors from knowledge of which intervention a participant received. We planned to assess blinding separately for different outcomes or classes of outcomes.
We assessed methods used to blind outcome assessment as:
low, high or unclear risk of bias.
(4) Incomplete outcome data (checking for possible attrition bias due to the amount, nature and handling of incomplete outcome data)
We described for the included study, and for each outcome or class of outcomes, the completeness of data including attrition and exclusions from the analysis. We stated whether attrition and exclusions were reported and the numbers included in the analysis at each stage (compared with the total randomised participants), reasons for attrition or exclusion where reported, and whether missing data were balanced across groups or were related to outcomes. Where sufficient information was reported, or could be supplied by the trial authors, we planned to re‐include missing data in the analyses which we undertook.
We assessed methods as:
low risk of bias (e.g. no missing outcome data; missing outcome data balanced across groups);
high risk of bias (e.g. numbers or reasons for missing data imbalanced across groups; ‘as treated’ analysis done with substantial departure of intervention received from that assigned at randomisation);
unclear risk of bias.
(5) Selective reporting bias
We described for the included study how we investigated the possibility of selective outcome reporting bias and what we found. We assessed the methods as:
low risk of bias (where it is clear that all of the study’s pre‐specified outcomes and all expected outcomes of interest to the review have been reported);
high risk of bias (where not all the study’s pre‐specified outcomes have been reported; one or more reported primary outcomes were not prespecified; outcomes of interest were reported incompletely and so cannot be used; study fails to include results of a key outcome that would have been expected to have been reported);
unclear risk of bias.
(6) Other sources of bias (checking for bias due to problems not covered by (1) to (5) above)
We described for the included study any important concerns we had about other possible sources of bias. We assessed whether the study was free of other problems that could put it at risk of bias:
low risk of other bias;
high risk of other bias;
unclear whether there is risk of other bias.
(7) Overall risk of bias
We made explicit judgements about whether the included study was at high risk of bias, according to the criteria given in the Cochrane Handbook for Systematic Reviews of Interventions (Higgins 2011). With reference to (1) to (6) above, we assessed the likely magnitude and direction of the bias and whether we considered it likely to impact on the findings. We planned to explore the impact of the level of bias through undertaking sensitivity analyses ‐ see 'Sensitivity analysis'.
For this update, no new trials were identified (29 February 2012). The following methods were used for previous versions of this review. In future updates, when new trials are identified, we will use the methods outlined in Appendix 2.
Measures of treatment effect
We carried out statistical analysis using RevMan 2008 and a fixed‐effect model. If we had included more than one trial, we planned to use fixed‐effect meta‐analysis for combining data in the absence of significant heterogeneity if trials were sufficiently similar. If heterogeneity was found, we planned to explore this by sensitivity analysis followed by random‐effects if required.
Dichotomous data
For dichotomous data, we presented results as summary risk ratio with 95% confidence intervals.
Continuous data
For continuous data, we used the mean difference. If more trials had been included, we would have used mean difference if outcomes were measured in the same way between trials and the standardised mean difference to combine trials that measured the same outcome, but used different methods. If there was evidence of skewness, this would have been reported.
Dealing with missing data
We analysed data on all participants with available data in the group to which they were allocated, regardless of whether or not they received the allocated intervention. If, in the original reports, participants were not analysed in the group to which they were randomised, and there was sufficient information in the trial report, we attempted to restore them to the correct group.
Assessment of heterogeneity
We were unable to apply tests of heterogeneity between trials using the I² statistic because only one trial was included in the review.
Subgroup analyses
We planned to conduct subgroup analyses classifying whole trials by interaction tests as described by Deeks 2001. We planned to carry out the following subgroup analyses: diagnosis of impaired fetal growth before or after 32 weeks, normal or abnormal umbilical artery doppler at time of diagnosis. These analyses were not possible on the information from this study.
Sensitivity analyses
We planned sensitivity analysis to explore the effect of trial quality. This would have involved analysis based on an a rating of selection bias and attrition bias. We planned to exclude studies of poor quality in the analysis in order to assess for any substantive difference to the overall result. Sensitivity analysis was not possible as there was only one trial included.
Results
Description of studies
Results of the search
Three trials were identified and one trial met our inclusion criteria (McCowan 2000) ‐ see table of Characteristics of included studies. Two trials were excluded ‐ see table of Characteristics of excluded studies.
Included studies
Participants
McCowan 2000 was a pilot study and recruitment occurred concurrently with another randomised trial assessing the use of low‐dose aspirin treatment for small‐for‐gestational‐age fetuses with abnormal Doppler studies. The pilot trial (McCowan 2000) recruited pregnant women who were outpatients with a singleton pregnancy between 24 and 36 weeks' gestation, with ultrasonographic evidence of small‐for‐gestational‐age fetuses (i.e. abdominal circumference below 10th percentile), normal results of umbilical artery Doppler velocimetry studies and no oligohydramnios (low amniotic fluid volume). A total of 167 women were randomly assigned, 85 to the twice‐weekly surveillance group and 82 to the fortnightly surveillance group.
Settings
The included study was conducted in Auckland, New Zealand at a tertiary referral centre (acute hospital setting).
Interventions
Twice‐weekly or fortnightly fetal surveillance involving biophysical profile, nonstress tests, umbilical artery and middle cerebral artery Doppler, growth scans and uterine artery Doppler.
Excluded studies
Two trials were excluded as they did not compare antenatal fetal surveillance regimens (i.e. combination of methods of surveillance, each at a specified frequency). Williams 2003 randomised women to either nonstress testing or umbilical artery velocimetry, while Sood 2007 looked at the addition of vibroacoustic stimulation to biophysical profile testing.
See table of Characteristics of excluded studies.
Risk of bias in included studies
SeeFigure 1; Figure 2, for summary of 'Risk of bias' assessments.
1.
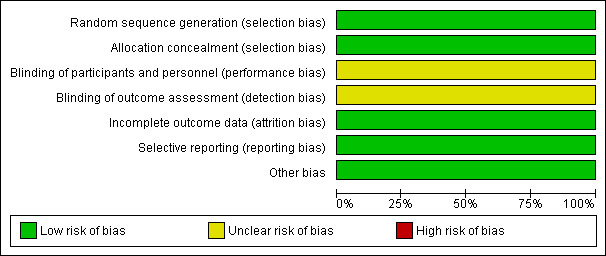
Risk of bias graph: review authors' judgements about each risk of bias item presented as percentages across all included studies.
2.
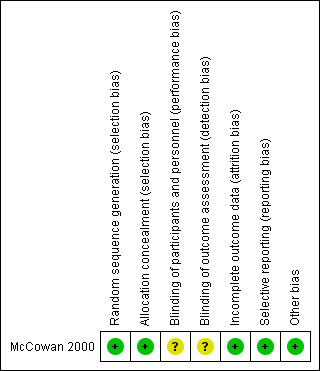
Risk of bias summary: review authors' judgements about each risk of bias item for each included study.
Allocation
Formal randomisation was reported in McCowan 2000 which used sequence generation via computer‐generated numbers and allocation concealment via telephone randomisation. It was not feasible to blind the participant and care giver and it was not stated whether the outcome assessors were blinded or not. No loss to follow‐up was documented.
Blinding
It was not feasible to blind participants and unclear if clinician or outcome assessors were blinded.
Incomplete outcome data
No loss of follow‐up was documented in this trial (McCowan 2000).
Selective reporting
All pre‐specified outcomes were reported on in the results section (McCowan 2000).
Other potential sources of bias
No other potential sources of bias were apparent. Baseline characteristics were similar, apart from age, with women assigned to the twice‐weekly surveillance group being slightly younger (McCowan 2000).
Effects of interventions
Primary outcomes
Infant
Perinatal mortality and serious neonatal morbidity, as defined by the trial authors.
The authors state that there were no perinatal deaths in either study group. McCowan 2000 did not assess composite perinatal morbidity and mortality as a primary outcome but instead used markers of neonatal morbidity. Perinatal mortality is mentioned in the body of the text, this information has been used for this review's outcome of perinatal mortality (Analysis 1.1).
1.1. Analysis.

Comparison 1 Twice‐weekly versus fortnightly surveillance, Outcome 1 Perinatal mortality.
Maternal
Emergency caesarean section for fetal distress.
No statistically significant difference was seen for this primary maternal outcome (risk ratio (RR) 0.96; 95% confidence interval (CI) 0.35 to 2.63; 167 women) (Analysis 1.22).
1.22. Analysis.

Comparison 1 Twice‐weekly versus fortnightly surveillance, Outcome 22 Emergency caesarean section for fetal distress.
Secondary outcomes
Infant
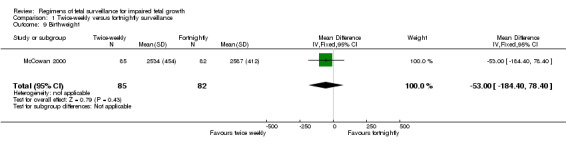
Data were available for several of the secondary outcomes that relate to infant health. In keeping with the more frequent monitoring, mean gestational age at birth was four days less for the twice‐weekly surveillance group compared with the fortnightly surveillance group, (mean difference (MD) ‐ 4 days; 95% CI ‐7.79 to ‐0.21) (Analysis 1.7). No statistically significant differences were seen for any of the other infant secondary outcomes where data were available, for admission to neonatal special care unit or intensive care unit (Analysis 1.6); low birthweight (Analysis 1.8); mean birthweight (Analysis 1.9); and cord blood acidosis (Analysis 1.12).
1.7. Analysis.

Comparison 1 Twice‐weekly versus fortnightly surveillance, Outcome 7 Gestational age at birth.
1.6. Analysis.
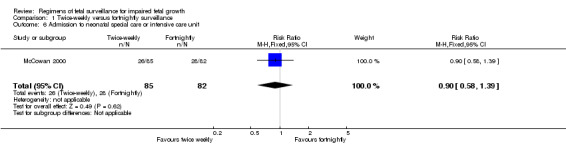
Comparison 1 Twice‐weekly versus fortnightly surveillance, Outcome 6 Admission to neonatal special care or intensive care unit.
1.8. Analysis.
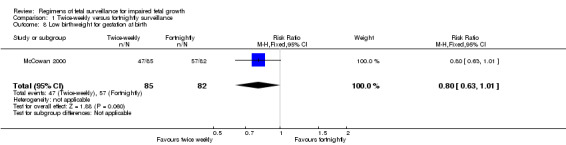
Comparison 1 Twice‐weekly versus fortnightly surveillance, Outcome 8 Low birthweight for gestation at birth.
1.9. Analysis.
Comparison 1 Twice‐weekly versus fortnightly surveillance, Outcome 9 Birthweight.
1.12. Analysis.

Comparison 1 Twice‐weekly versus fortnightly surveillance, Outcome 12 Cord blood acidosis.
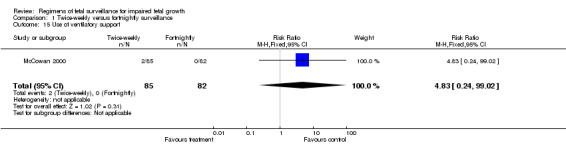
No data were available for some of the serious neonatal morbidity and mortality outcomes including preterm birth, low Apgar scores at five minutes (as defined by trial), and other complications of prematurity, such as respiratory morbidity, necrotising enterocolitis and serious intraventricular haemorrhage. Only two infants required mechanical ventilation (at 30 and 32 weeks), both babies were in the twice‐weekly group (Analysis 1.15). No follow‐up was performed. Consequently, no data are available on longer‐term neurodevelopmental outcomes and cerebral palsy.
1.15. Analysis.
Comparison 1 Twice‐weekly versus fortnightly surveillance, Outcome 15 Use of ventilatory support.
Maternal
Women in the twice‐weekly surveillance group were 25% more likely to have labour induced than those in the fortnightly surveillance group (RR 1.25; 95% CI 1.04 to 1.50) (Analysis 1.24).
1.24. Analysis.

Comparison 1 Twice‐weekly versus fortnightly surveillance, Outcome 24 Induction of labour.
No statistically significant differences were seen between the two groups regarding caesarean section (Analysis 1.25). No data were available on women's views of care, length of antenatal hospital admission and operative vaginal birth.
1.25. Analysis.

Comparison 1 Twice‐weekly versus fortnightly surveillance, Outcome 25 Caesarean section.
Use of healthcare services
No statistically significant difference was seen for length of stay in neonatal special care or intensive care unit. No data were available for length of antenatal hospital admission or costs of monitoring.
Outcomes reported but not prespecified in the review
McCowan 2000 reported no statistically significant difference in umbilical artery resistance index at delivery, Ponderal index, hypoglycaemia, spontaneous onset of labour, pre‐eclampsia and gestational hypertension.
Discussion
This pilot, randomised trial of two regimens did not demonstrate any difference in markers of neonatal morbidity or perinatal mortality between the two study groups. A much larger study will be required to detect a difference in perinatal mortality and serious neonatal morbidity.
The women in the twice‐weekly surveillance group were 25% more likely to have induction of labour compared with those in the fortnightly surveillance group where spontaneous onset of labour was more likely to occur. Despite the earlier intervention, there were no statistically significant benefits in infant or maternal outcomes such as neonatal morbidity, the need for caesarean section or the need for emergency caesarean section for fetal distress.
Women in the twice‐weekly surveillance group gave birth on average four days earlier than women in the fortnightly surveillance group. This difference of four days is unlikely to be clinically significant in infants born at term and is unlikely to impact on serious neonatal morbidity or mortality.
There is almost no evidence to date to indicate an optimal antenatal surveillance method for infants identified with impaired growth. Any future studies should include an assessment of women's views of care and should be adequately powered to detect clinically relevant differences in maternal and infant health outcomes.
This study only recruited a subset population of all pregnancies with small‐for‐gestational‐age fetus (that is, pregnancies with normal Doppler velocimetric studies); it excluded pregnancies with abnormal Doppler studies and oligohydramnios. Often babies who are identified as having impaired in‐utero growth also have abnormal Doppler studies or oligohydramnios, or both. There is no evidence to inform the optimal surveillance regimen for this group of women and their babies. Thus, further studies could incorporate subgroup analysis of pregnancies with small‐for‐gestational‐age fetuses associated with abnormal Doppler studies or oligohydramnios, or both.
One international group of authors has embarked on a randomised trial of timing of delivery in early preterm fetal growth restriction based on early and late fetal Doppler venous changes versus cardiotocography. It is noted by the Trial of Umbilical and Fetal Flow in Europe (TRUFFLE) group that current evidence regarding assessment techniques is lacking and that there is a need for a multicentre randomised controlled trial that will help to provide reliable evidence (Lees 2005). It is hoped that the TRUFFLE study will contribute at least in part to our knowledge surrounding the complex question of what fetal surveillance methods to use, how to use them and how the results should be interpreted and acted upon.
Authors' conclusions
Implications for practice.
There is very little evidence from randomised controlled trials to inform best practice for antenatal surveillance regimens when caring for women whose pregnancy is affected by impaired fetal growth.
Implications for research.
More studies are needed to evaluate the effects of current fetal surveillance regimens for impaired fetal growth.
What's new
| Date | Event | Description |
|---|---|---|
| 6 March 2012 | New citation required but conclusions have not changed | Review updated. |
| 6 March 2012 | New search has been performed | Search updated. There are no new trials. Risk of bias assessment updated to current standard methods. |
Acknowledgements
The authors would like to acknowledge Philippa Middleton for her advice during the protocol and review phase.
Leanne Jones for her help with the 2012 update.
Appendices
Appendix 1. Methods used to assess risk of bias of trials included in previous versions of this review
Selection of studies
We assessed for inclusion all potential studies we identified as a result of the search strategy. We resolved any disagreement through discussion or, if required, consulted a third party.
Data extraction and management
We designed a form to extract data. Two review authors (R Grivell and L Wong) extracted the data independently using the agreed form. We resolved discrepancies through discussion. We used the Review Manager software (RevMan 2008) to double enter all the data or a subsample.
When information regarding any of the above was unclear, we attempted to contact authors of the original reports to provide further details.
Assessment of methodological quality of included studies
We assessed the validity of the one included study using the criteria outlined in the Cochrane Handbook for Systematic Reviews of Interventions (Higgins 2008). We described the methods used for generation of the randomisation sequence.
(1) Sequence generation (checking for possible selection bias)
We described for the included study the method used to generate the allocation sequence in sufficient detail to allow an assessment of whether it should produce comparable groups. We assessed the method as:
adequate (any truly random process, e.g. random number table; computer random number generator);
inadequate (any non random process, e.g. odd or even date of birth; hospital or clinic record number);
unclear.
(2) Allocation concealment (checking for possible selection bias)
We described for the included study the method used to conceal the allocation sequence in sufficient detail and determine whether intervention allocation could have been foreseen in advance of, or during recruitment, or changed after assignment. We assessed the methods as:
adequate (e.g. telephone or central randomisation; consecutively numbered sealed opaque envelopes);
inadequate (open random allocation; unsealed or non‐opaque envelopes, alternation; date of birth);
unclear.
(3) Blinding (checking for possible performance bias)
We described for the included study the methods used, if any, to blind study participants and personnel from knowledge of which intervention a participant received. We considered that studies would be judged at low risk of bias if they were blinded, or if we judged that the lack of blinding could not have affected the results. Blinding was assessed separately for different outcomes or classes of outcomes. We assessed the blinding as: adequate, inadequate or unclear for participants; adequate, inadequate or unclear for personnel; adequate, inadequate or unclear for outcome assessors.
(4) Incomplete outcome data (checking for possible attrition bias through withdrawals, dropouts, protocol deviations)
We described for the included study, and for each outcome or class of outcomes, the completeness of data including attrition and exclusions from the analysis. We stated whether attrition and exclusions were reported, the numbers included in the analysis at each stage (compared with the total randomised participants), reasons for attrition or exclusion where reported, and whether missing data were balanced across groups or were related to outcomes. Where sufficient information was reported, or could be supplied by the trial authors, we re‐included missing data in the analyses which we undertook. We assessed methods as:
adequate (i.e. low risk of bias);
inadequate (i.e. high risk of bias):
unclear.
(5) Selective reporting bias
We described for the included study how we investigated the possibility of selective outcome reporting bias and what we found. We assessed the methods as:
adequate (where it is clear that all of the study’s prespecified outcomes and all expected outcomes of interest to the review have been reported);
inadequate (where not all the study’s prespecified outcomes have been reported; one or more reported primary outcomes were not prespecified; outcomes of interest are reported incompletely and so cannot be used; study fails to include results of a key outcome that would have been expected to have been reported);
unclear.
(6) Other sources of bias
We described for the the included study any important concerns we had about other possible sources of bias. We assessed whether the study was free of other problems that could put it at risk of bias:
yes;
no;
unclear.
(7) Overall risk of bias
We made explicit judgements about whether the study was at a high risk of bias, according to the criteria given in the Handbook (Higgins 2008). With reference to (1) to (6) above, we assessed the likely magnitude and direction of the bias and whether we considered it likely to impact on the findings. We planned to explore the impact of the level of bias through undertaking sensitivity analyses ‐ see 'Sensitivity analysis'.
Appendix 2. Methods used to assess trials included in future versions of this review
Dichotomous data
For dichotomous data, we will present results as summary risk ratio with 95% confidence intervals.
Continuous data
For continuous data, we will use the mean difference if outcomes are measured in the same way between trials. We will use the standardised mean difference to combine trials that measure the same outcome, but use different methods.
Unit of analysis issues
Cluster‐randomised trials
We will include cluster‐randomised trials in the analyses along with individually‐randomised trials. We will adjust their standard errors using the methods described in the Cochrane Handbook for Systematic Reviews of Interventions (Higgins 2011) using an estimate of the intracluster correlation co‐efficient (ICC) derived from the trial (if possible), from a similar trial or from a study of a similar population. If we use ICCs from other sources, we will report this and conduct sensitivity analyses to investigate the effect of variation in the ICC. If we identify both cluster‐randomised trials and individually‐randomised trials, we plan to synthesise the relevant information. We will consider it reasonable to combine the results from both if there is little heterogeneity between the study designs and the interaction between the effect of intervention and the choice of randomisation unit is considered to be unlikely.
We will also acknowledge heterogeneity in the randomisation unit and perform a subgroup analysis to investigate the effects of the randomisation unit.
Cross‐over trials
Cross‐over trials will not be included.
Dealing with missing data
For included studies, we will note levels of attrition. We will explore the impact of including studies with high levels of missing data in the overall assessment of treatment effect by using sensitivity analysis.
For all outcomes, we will carry out analyses, as far as possible, on an intention‐to‐treat basis, i.e. we will attempt to include all participants randomised to each group in the analyses, and all participants will be analysed in the group to which they were allocated, regardless of whether or not they received the allocated intervention. The denominator for each outcome in each trial will be the number randomised minus any participants whose outcomes are known to be missing.
Assessment of heterogeneity
We will assess statistical heterogeneity in each meta‐analysis using the T², I² and Chi² statistics. We will regard heterogeneity as substantial if I² is greater than 30% and either T² is greater than zero, or there is a low P value (less than 0.10) in the Chi² test for heterogeneity.
Assessment of reporting biases
If there are 10 or more studies in the meta‐analysis, we will investigate reporting biases (such as publication bias) using funnel plots. We will assess funnel plot asymmetry visually, and use formal tests for funnel plot asymmetry. For continuous outcomes, we will use the test proposed by Egger 1997, and for dichotomous outcomes, we will use the test proposed by Harbord 2006. If asymmetry is detected in any of these tests or is suggested by a visual assessment, we will perform exploratory analyses to investigate it.
Data synthesis
We will carry out statistical analysis using the Review Manager software (RevMan 2011). We will use fixed‐effect meta‐analysis for combining data where it is reasonable to assume that studies are estimating the same underlying treatment effect: i.e. where trials are examining the same intervention, and the trials’ populations and methods are judged sufficiently similar. If there is clinical heterogeneity sufficient to expect that the underlying treatment effects differ between trials, or if substantial statistical heterogeneity is detected, we will use random‐effects meta‐analysis to produce an overall summary if an average treatment effect across trials is considered clinically meaningful. The random‐effects summary will be treated as the average range of possible treatment effects and we will discuss the clinical implications of treatment effects differing between trials. If the average treatment effect is not clinically meaningful, we will not combine trials.
If we use random‐effects analyses, the results will be presented as the average treatment effect with 95% confidence intervals, and the estimates of T² and I².
Subgroup analysis and investigation of heterogeneity
If we identify substantial heterogeneity, we will investigate it using subgroup analyses and sensitivity analyses. We will consider whether an overall summary is meaningful, and if it is, use random‐effects analysis to produce it.
We plan to carry out the following subgroup analyses:
diagnosis of impaired fetal growth before or after 32 weeks;
normal or abnormal umbilical artery doppler at time of diagnosis.
The following primary outcomes will be used in subgroup analysis:
perinatal mortality and serous neonatal morbidity, as defined by the trial authors;
emergency caesarean section for fetal distress.
We will assess differences between subgroups by interaction tests available within RevMan (RevMan 2011).
Sensitivity analysis
We plan to carry out sensitivity analyses to explore the effect of trial quality assessed by concealment of allocation, high attrition rates, or both, with poor quality studies being excluded from the analyses in order to assess whether this makes any difference to the overall result.
Data and analyses
Comparison 1. Twice‐weekly versus fortnightly surveillance.
| Outcome or subgroup title | No. of studies | No. of participants | Statistical method | Effect size |
|---|---|---|---|---|
| 1 Perinatal mortality | 1 | 167 | Risk Ratio (M‐H, Fixed, 95% CI) | 0.0 [0.0, 0.0] |
| 2 Serious neonatal morbidity | 0 | 0 | Risk Ratio (M‐H, Fixed, 95% CI) | 0.0 [0.0, 0.0] |
| 3 Stillbirth | 0 | 0 | Risk Ratio (M‐H, Fixed, 95% CI) | 0.0 [0.0, 0.0] |
| 4 Neonatal death | 0 | 0 | Risk Ratio (M‐H, Fixed, 95% CI) | 0.0 [0.0, 0.0] |
| 5 Hypoxic ischaemic encephalopathy | 0 | 0 | Risk Ratio (M‐H, Fixed, 95% CI) | 0.0 [0.0, 0.0] |
| 6 Admission to neonatal special care or intensive care unit | 1 | 167 | Risk Ratio (M‐H, Fixed, 95% CI) | 0.90 [0.58, 1.39] |
| 7 Gestational age at birth | 1 | 167 | Mean Difference (IV, Fixed, 95% CI) | ‐4.0 [‐7.79, ‐0.21] |
| 8 Low birthweight for gestation at birth | 1 | 167 | Risk Ratio (M‐H, Fixed, 95% CI) | 0.80 [0.63, 1.01] |
| 9 Birthweight | 1 | 167 | Mean Difference (IV, Fixed, 95% CI) | ‐53.0 [‐184.40, 78.40] |
| 10 Preterm birth | 0 | 0 | Risk Ratio (M‐H, Fixed, 95% CI) | 0.0 [0.0, 0.0] |
| 11 Low Apgar scores at 5 minutes | 0 | 0 | Risk Ratio (M‐H, Fixed, 95% CI) | 0.0 [0.0, 0.0] |
| 12 Cord blood acidosis | 1 | 167 | Risk Ratio (M‐H, Fixed, 95% CI) | 1.29 [0.30, 5.57] |
| 13 Metabolic acidosis or lactic acidosis | 0 | 0 | Risk Ratio (M‐H, Fixed, 95% CI) | 0.0 [0.0, 0.0] |
| 14 Respiratory distress syndrome | 0 | 0 | Risk Ratio (M‐H, Fixed, 95% CI) | 0.0 [0.0, 0.0] |
| 15 Use of ventilatory support | 1 | 167 | Risk Ratio (M‐H, Fixed, 95% CI) | 4.83 [0.24, 99.02] |
| 16 Use of inotropic support | 0 | 0 | Risk Ratio (M‐H, Fixed, 95% CI) | 0.0 [0.0, 0.0] |
| 17 Necrotising enterocolitis | 0 | 0 | Risk Ratio (M‐H, Fixed, 95% CI) | 0.0 [0.0, 0.0] |
| 18 Grade III or IV intraventricular haemorrhage | 0 | 0 | Risk Ratio (M‐H, Fixed, 95% CI) | 0.0 [0.0, 0.0] |
| 19 Duration of neonatal hospital stay | 0 | 0 | Mean Difference (IV, Fixed, 95% CI) | 0.0 [0.0, 0.0] |
| 20 Long‐term neurodevelopmental outcomes | 0 | 0 | Risk Ratio (M‐H, Fixed, 95% CI) | 0.0 [0.0, 0.0] |
| 21 Cerebral palsy | 0 | 0 | Risk Ratio (M‐H, Fixed, 95% CI) | 0.0 [0.0, 0.0] |
| 22 Emergency caesarean section for fetal distress | 1 | 167 | Risk Ratio (M‐H, Fixed, 95% CI) | 0.96 [0.35, 2.63] |
| 23 Antenatal hospital admission | 0 | 0 | Risk Ratio (M‐H, Fixed, 95% CI) | 0.0 [0.0, 0.0] |
| 24 Induction of labour | 1 | 167 | Risk Ratio (M‐H, Fixed, 95% CI) | 1.25 [1.04, 1.50] |
| 25 Caesarean section | 1 | 167 | Risk Ratio (M‐H, Fixed, 95% CI) | 1.14 [0.54, 2.40] |
| 26 Operative vaginal delivery | 0 | 0 | Risk Ratio (M‐H, Fixed, 95% CI) | 0.0 [0.0, 0.0] |
| 27 Length of stay in neonatal special care and/or intensive care unit | Other data | No numeric data | ||
| 28 Length of antenatal hospital admission | 0 | 0 | Mean Difference (IV, Fixed, 95% CI) | 0.0 [0.0, 0.0] |
| 29 Costs of monitoring | 0 | 0 | Mean Difference (IV, Fixed, 95% CI) | 0.0 [0.0, 0.0] |
| 30 Women's views of care | 0 | 0 | Odds Ratio (M‐H, Fixed, 95% CI) | 0.0 [0.0, 0.0] |
1.27. Analysis.
Comparison 1 Twice‐weekly versus fortnightly surveillance, Outcome 27 Length of stay in neonatal special care and/or intensive care unit.
| Length of stay in neonatal special care and/or intensive care unit | ||
|---|---|---|
| Study | Twice weekly | Fortnightly |
| McCowan 2000 | median 5 days (range 0 to 66) | median 4 days (range 1 to 27) |
Characteristics of studies
Characteristics of included studies [ordered by study ID]
McCowan 2000.
| Methods | Randomised controlled trial, pilot study recruiting alongside another larger trial. | |
| Participants | 167 women with singleton pregnancies 24 to 36 weeks; outpatients; previous normal anatomy scan; ultrasound showing abdominal circumference < 10th percentile, 2 measures of umbilical artery Doppler resistive index < 95th centile, no oligohydramnios. | |
| Interventions | Twice‐weekly versus fortnightly fetal surveillance. Surveillance methods include biophysical profile, nonstress tests, umbilical artery and middle cerebral artery Doppler, growth scans and uterine artery Doppler. | |
| Outcomes | Neonatal; gestational age at delivery, umbilical artery resistive index at delivery, abnormal umbilical artery at delivery, female sex, birthweight, birthweight < 10th percentile, ponderal index, ponderal index < 10th percentile, admission to neonatal nursery, neonatal hospital stay, acidosis at birth, hypoglycaemia. Maternal: spontaneous onset of labour, induction of labour, caesarean delivery, caesarean delivery for fetal distress, pre‐eclampsia, gestational hypertension. |
|
| Notes | Sample size calculated for main study, no prespecified single primary outcome for this pilot complementary study. | |
| Risk of bias | ||
| Bias | Authors' judgement | Support for judgement |
| Random sequence generation (selection bias) | Low risk | Computer‐generated numbers. |
| Allocation concealment (selection bias) | Low risk | Central telephone randomisation service. |
| Blinding of participants and personnel (performance bias) All outcomes | Unclear risk | Not feasible to blind participant and unclear if clinician or outcome assessors were blinded. |
| Blinding of outcome assessment (detection bias) All outcomes | Unclear risk | Not feasible to blind participant and unclear if clinician or outcome assessors were blinded. |
| Incomplete outcome data (attrition bias) All outcomes | Low risk | No loss to follow up documented. |
| Selective reporting (reporting bias) | Low risk | All outcomes described within the methods section have been reported on. |
| Other bias | Low risk | Baseline characteristics table presented ‐ were similar apart from women assigned to the twice‐weekly surveillance group were slightly younger (y, mean ± SD) 24.3 ± 5.1 versus 26.4 ± 5.5. |
Characteristics of excluded studies [ordered by study ID]
| Study | Reason for exclusion |
|---|---|
| Sood 2007 | Participants were high risk, not specifically growth restricted and did not compare 2 regimens. |
| Williams 2003 | Participants were high risk, not specifically growth restricted and compared nonstress test (cardiotocography) to umbilical artery doppler therefore this does not qualify as a regimen as per our definition. |
Contributions of authors
Rosalie Grivell and Lufee Wong researched and wrote the protocol and the review, with advice from Vineesh Bhatia, particularly in relation to neonatal outcomes. Rosalie Grivell is the guarantor for the review.
For the 2012 update, all authors approved the revisions made by Leanne Jones.
Sources of support
Internal sources
No sources of support supplied
External sources
-
National Institute for Health Research, UK.
UK NIHR Programme of centrally‐managed pregnancy and childbirth systematic reviews of priority to the NHS and users of the NHS: 10/4001/02
Declarations of interest
None known.
New search for studies and content updated (no change to conclusions)
References
References to studies included in this review
McCowan 2000 {published data only}
- McCowan LME, Harding JE, Roberts AB, Barker SE, Ford C, Stewart AW. A pilot randomized controlled trial of two regimens of fetal surveillance for small‐for‐gestational‐age fetuses with normal results of umbilical artery Doppler velocimetry. American Journal of Obstetrics and Gynecology 2000;182(1):81‐6. [DOI] [PubMed] [Google Scholar]
References to studies excluded from this review
Sood 2007 {published data only}
- Sood AK. Vibroacoustic stimulation and modified fetal biophysical profile in high risk pregnancy. Journal of Obstetrics and Gynaecology of India 2007;57(1):27‐36. [Google Scholar]
Williams 2003 {published data only}
- Williams KP, Farquharson DF, Bebbington M, Dansereau J, Galerneau F, Wilson RD, et al. Screening for fetal well‐being in a high‐risk population comparing the nonstress test with umbilical artery Doppler velocimetry: a randomized controlled trial. American Journal of Obstetrics and Gynecology 2003;188:1366‐71. [DOI] [PubMed] [Google Scholar]
Additional references
Alfirevic 2010
- Alfirevic Z, Stampalija T, Gyte GML. Fetal and umbilical Doppler ultrasound in high‐risk pregnancies. Cochrane Database of Systematic Reviews 2010, Issue 1. [DOI: 10.1002/14651858.CD007529.pub2] [DOI] [PMC free article] [PubMed] [Google Scholar]
Baschat 2001
- Baschat AA, Harman CR. Antenatal assessment of the growth restricted fetus. Current Opinion in Obstetrics and Gynaecology 2001;13:161‐8. [DOI] [PubMed] [Google Scholar]
Baschat 2005
- Baschat AA. Arterial and venous Doppler in the diagnosis and management of early onset fetal growth restriction. Early Human Development 2005;81(11):877‐87. [DOI] [PubMed] [Google Scholar]
Baschat 2006
- Baschat AA. Fetal growth disorders. High Risk Pregnancy Management Options. Philadelphia: Saunders, 2006. [Google Scholar]
Breeze 2007
- Breeze AC, Lees CC. Prediction and perinatal outcomes of fetal growth restriction. Seminars in Fetal and Neonatal Medicine 2007;12(5):363‐97. [DOI] [PubMed] [Google Scholar]
Deeks 2001
- Deeks JJ, Altman DG, Bradburn MJ. Statistical methods for examining heterogeneity and combining results from several studies in meta‐analysis. In: Egger M, Davey Smith G, Altman DG editor(s). Systematic reviews in health care: meta‐analysis in context. London: BMJ Books, 2001. [Google Scholar]
Egger 1997
- Egger M, Davey Smith G, Schneider M, Minder C. Bias in meta‐analysis detected by a simple, graphical test. BMJ 1997;315(7109):629‐34. [DOI] [PMC free article] [PubMed] [Google Scholar]
Gardosi 1998
- Gardosi J, Mul T, Mongelli M, Fagan D. Analysis of birthweight and gestational age in antepartum stillbirths. British Journal of Obstetrics and Gynaecology 1998;105(5):524‐30. [DOI] [PubMed] [Google Scholar]
Grivell 2010
- Grivell RM, Alfirevic Z, Gyte GML, Devane D. Antenatal cardiotocography for fetal assessment. Cochrane Database of Systematic Reviews 2010, Issue 1. [DOI: 10.1002/14651858.CD007863.pub2] [DOI] [PubMed] [Google Scholar]
Harbord 2006
- Harbord RM, Egger M, Sterne JA. A modified test for small‐study effects in meta‐analyses of controlled trials with binary endpoints. Statistics in Medicine 2006;25(20):3443‐57. [DOI] [PubMed] [Google Scholar]
Higgins 2008
- Higgins JPT, Green S, editors. Cochrane Handbook for Systematic Reviews of Interventions Version 5.0.0 [updated February 2008]. The Cochrane Collaboration, 2008. Available from www.cochrane‐handbook.org.
Higgins 2011
- Higgins JPT, Green S, editors. Cochrane Handbook for Systematic Reviews of Interventions Version 5.1.0 [updated March 2011]. The Cochrane Collaboration, 2011. Available from www.cochrane‐handbook.org.
Lalor 2008
- Lalor JG, Fawole B, Alfirevic Z, Devane D. Biophysical profile for fetal assessment in high risk pregnancies. Cochrane Database of Systematic Reviews 2008, Issue 1. [DOI: 10.1002/14651858.CD000038.pub2] [DOI] [PMC free article] [PubMed] [Google Scholar]
Lees 2005
- Lees C, Baumgartner H. The TRUFFLE study‐‐a collaborative publicly funded project from concept to reality: how to negotiate an ethical, administrative and funding obstacle course in the European Union. Ultrasound in Obstetrics and Gynecology 2005;25(2):105‐7. [DOI] [PubMed] [Google Scholar]
RevMan 2008 [Computer program]
- The Nordic Cochrane Centre, The Cochrane Collaboration. Review Manager (RevMan). Version 5.0. Copenhagen: The Nordic Cochrane Centre, The Cochrane Collaboration, 2008.
RevMan 2011 [Computer program]
- The Nordic Cochrane Centre, The Cochrane Collaboration. Review Manager (RevMan). Version 5.1. Copenhagen: The Nordic Cochrane Centre, The Cochrane Collaboration, 2011.
Yanney 2004
- Yanney M, Marlow N. Paediatric consequences of fetal growth restriction. Seminars in Fetal and Neonatal Medicine 2004;9(5):411‐8. [DOI] [PubMed] [Google Scholar]