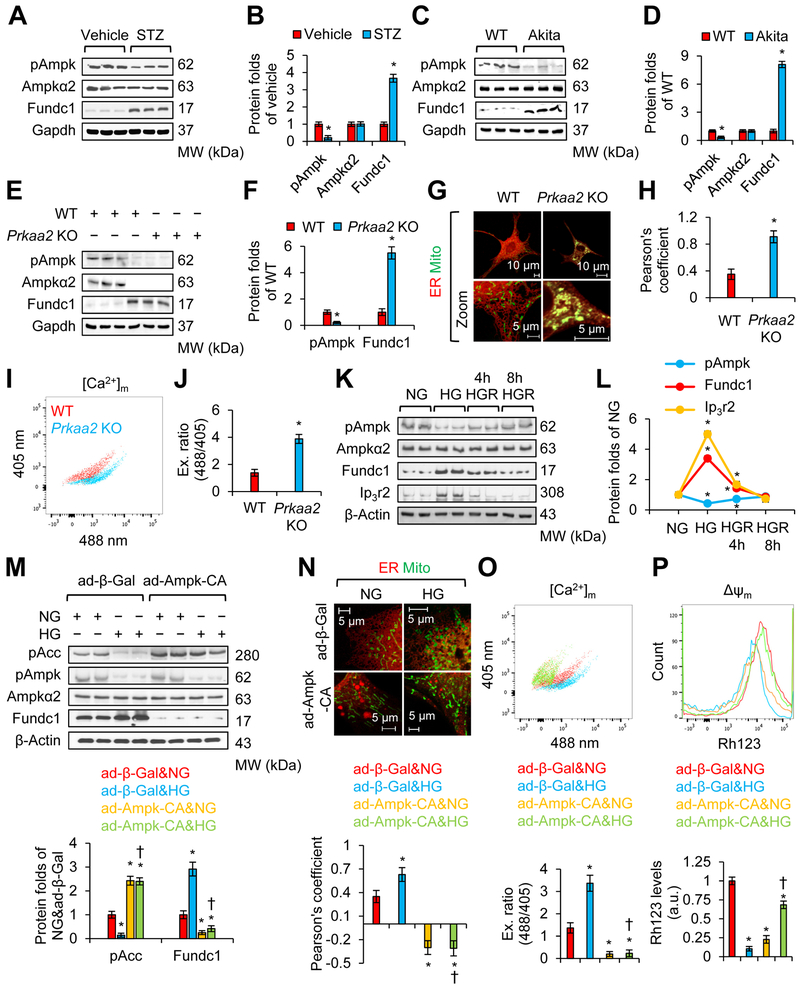
Figure 7. Diabetes increases Fundc1 by downregulating AMP-activated protein kinase (Ampk).
A, Western blot analysis for the interest proteins in cardiac homogenates prepared from the vehicle or STZ-treated mice at 6 months. B, Densitometric analysis of blots in A (mean ± SD, n = 8 mice per group; *P < 0.05 versus vehicle). C, Western blot analysis for the interest proteins of interest in cardiac homogenates prepared from WT and Akita mice at 6 months. D, Densitometric analysis of blots in C (mean ± SD, n = 8 mice per group; *P < 0.05 versus WT). E, Western blot analysis for proteins of interest in cardiac homogenates prepared from WT and Prkaa2 (gene encoding Ampkα2) KO mice at 6 months. F, Densitometric analysis of blots in E (mean ± SD, n = 8 mice per group; *P < 0.05 versus WT). G, Representative confocal images illustrating the association between the ER (DsRed2-ER) and mitochondria (MitoTracker Green) in WT or Prkaa2 KO mouse neonatal cardiomyocytes. H, Quantitation of ER and mitochondrial contacts using Pearson’s coefficient (mean ± SD, n = 5 mice per group; *P < 0.05 versus WT). I, Representative FCM plots illustrating mitochondrial Ca2+ levels using the RPmt indicator. J, Excitation ratio of 488/405 in each group (mean ± SD, n = 8 mice per group; *P < 0.05 versus WT). K, Western blot analysis for the interest proteins in mouse neonatal cardiomyocytes grown in NG (5.5 mmol/L D-glucose), osmotic control (24.5 mmol/L D-mannitol plus 5.5 mmol/L D-glucose), or HG (30 mmol/L D-glucose) conditions for 48 h. HGR group: Forty-eight hours after HG treatment, cells were cultured in NG for the indicated time. L, Densitometric analysis of blots in K (mean ± SD, *P < 0.05 versus NG). M-P, Mouse neonatal cardiomyocytes were infected with ad-β-Gal or constitutively active mutant Ampk (ad-Ampk-CA), and received NG (5.5 mmol/L D-glucose) or HG (30 mmol/L D-glucose) treatment. M, Proteins of interest were assayed by western blot. Lower panel: Densitometric analysis of blots (mean ± SD, *P < 0.05 versus ad-β-Gal & NG; †P < 0.05 versus ad-β-Gal & HG). N, The association between the ER (DsRed2-ER) and mitochondria (MitoTracker Green) was analyzed by confocal microscopy. Upper panel: Representative images are shown. Lower panel: ER and mitochondrial contacts are quantitated using the Pearson’s coefficient (mean ± SD, *P < 0.05 versus ad-β-Gal & NG; †P < 0.05 versus ad-β-Gal & HG). O, Mitochondrial Ca2+ levels were determined by FCM using RPmt indicator. Upper panel: Representative FCM plots. Lower panel: Histogram of the excitation ratio of 488/405 in each group (mean ± SD, *P < 0.05 versus ad-β-Gal & NG; †P < 0.05 versus ad-β-Gal & HG). P, Mitochondrial membrane potential (ΔΨm) was determined by FCM using the Rh123 probe. Upper panel: Representative FCM plots. Lower panel: The intensities of Rh123-stained cells (mean ± SD, *P < 0.05 versus ad-β-Gal & NG; †P < 0.05 versus ad-β-Gal & HG).

