Abstract
We examined the number, distribution and immunoreactivity of the infracortical white matter neuronal population, also termed white matter interstitial cells (WMICs), in the brain of a lesser ape, the lar gibbon. Staining for neuronal nuclear marker (NeuN) revealed WMICs throughout the infracortical white matter, these cells being most numerous and dense close to cortical layer 6, decreasing significantly in density with depth in the white matter. Stereological analysis of NeuN-immunopositive cells revealed a global estimate of approximately 67.5 million WMICs within the infracortical white matter of the gibbon brain, indicating that the WMICs are a numerically significant population, approximately 2.5% of the total cortical gray matter neurons that would be estimated for a primate brain the mass of that of the lar gibbon. Immunostaining revealed subpopulations of WMICs containing neuronal nitric oxide synthase (nNOS, approximately 7 million in number, with both small and large soma volumes), calretinin (approximately 8.6 million in number, all of similar soma volume), very few WMICs containing parvalbumin, and no calbindin-immunopositive neurons. These nNOS, calretinin and parvalbumin immunopositive WMICs, presumably all inhibitory neurons, represent approximately 23.1% of the total WMIC population. As the white matter is affected in many cognitive conditions, such as schizophrenia, autism and also in neurodegenerative diseases, understanding these neurons across species is important for the translation of findings of neural dysfunction in animal models to humans. Furthermore, studies of WMICs in species such as apes provides a crucial phylogenetic context for understanding the evolution of these cell types in the human brain.
Keywords: white matter neurons, neurochemistry, immunohistochemistry, ape brain, cortical evolution, primate brain, RRID - AB_11204707, RRID - AB_10000343, RRID - AB_10000340, RRID - AB_10000321, RRID - AB_91824
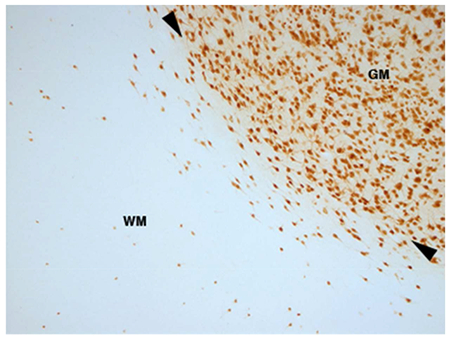
Immunohistochemical staining for neuronal nuclear marker (NeuN) reveals the subcortical white matter neurons, or white matter interstitial cells (WMICs), deep to the grey matter of the cerebral cortex of the superior lateral sulcus of the brain of the lar gibbon. GM – grey matter, WM – white matter, arrowheads indicate the GM/WM border.
The infracortical telencephalic white matter of the brain is primarily composed of myelinated and unmyelinated axons, oligodendrocytes and astrocytes; however, Ramón y Cajal (1911) described neurons dispersed throughout the fibre tracts of the white matter, which he termed “interstitial cells” (white matter interstitial cells, WMICs) (Kostovic & Rakic, 1980; von Engelhardt, Khrulev, Eliava, Wahlster, & Monyer, 2011). These cells are neuronal, with neurochemical studies showing both glutamatergic and GABAergic phenotypes (García-Marin, Blazques-Llorca, Rodrigues, Gonzalez-Soriano, & DeFelipe, 2010; Meyer, Wahle, Castaneyra-Perdomo, & Ferres-Torres, 1992; Suárez-Solá et al., 2009; von Engelhardt et al., 2011). Given their sparse distribution and relative inaccessibility, the function, synaptic relationships and connectivity of WMICs have only been studied sporadically; however, due to more recent findings concerning the relationship of the infracortical telencephalic white matter to cognition and neural dysfunction in humans (Connor, Crawford, & Akbarian, 2011; Fields, 2008; Filley & Fields, 2016), there is a resurgence of interest in various aspects of the morphology and physiology of the white matter, including the WMICs (Kostovic, Judas & Sedmak, 2011; Mortazavi, Wang, Rosene, & Rockland, 2016; Mortazavi, Romano, Rosene, & Rockland, 2017; Suárez-Solá et al., 2009).
WMICs have been observed in adult rats (Case, Lyons, & Broberger, 2017; Clancy, Silva, & Friedlander, 2001; Clancy, Teague-Ross, & Nagarajan, 2009), cats (Chun & Shatz, 1989), nonhuman primates (Clancy et al., 2009; Kostovic & Rakic, 1980, 1990; Smiley, Levey, & Mesulam, 1998; Barone & Kennedy, 2000; Tomioka, & Rockland, 2007), and humans (García-Marin et al., 2010; Meyer et al., 1992). Despite neurochemical and morphological differences between species it is assumed that they are a phylogenetically conserved trait of the mammalian brain (Mortazavi et al., 2016). The density of WMICs decreases during ontogeny from the prenatal to the adult brain (Duque, Krsnik, Kostovic & Rakic, 2016; Kanold & Luhmann, 2010), but this change varies depending on the cortical region examined, brain size and the extent of cortical gyrencephaly (García-Marín et al., 2010; Kostovic & Rakic, 1980, 1990; Suárez-Solá et al., 2009). Hodological studies of WMICs indicate that they are integrated into the circuitry of the overlying region of cortical grey matter (Clancy et al., 2001; Frazer et al., 2017; Shering & Lowenstein, 1994; Tomioka et al., 2005; Tomioka & Rockland, 2007; von Engelhardt et al., 2011), while functionally, subpopulations have been linked to vasodilation (Suárez-Solá et al., 2009), homeostatic sleep regulation (Kilduff, Cauli, & Gerashchenko, 2011), the regulation of information transfer (Colombo, 2018), and the regulation of arousal and transthalamic cortico-cortical communication (Hoerder-Suabedissen et al., 2018; Molnár, 2018). These characteristics of WMICs indicate that they are not just a remnant of the subplate, and form a distinct functional neural system (Colombo, 2018; Hoerder-Suabedissen & Molnár, 2015; Hoerder-Suabedissen et al., 2018; Molnár, 2018; Suárez-Solá et al., 2009).
WMICs across mammalian species are thought to have diverse functional roles (Mortazavi et al., 2016); for example, they express a variety of both excitatory and GABAergic neuronal markers. In addition, variation in WMIC density in humans has led to the suggestion that they may be involved in psychiatric diseases, such as schizophrenia (Akbarian, Kim, Potkin, Hetrick, Bunney, & Jones, 1996; Connor et al., 2011; Fung, Joshi, Fillamn, & Weickert, 2014), autism (Amaral, Mills Schumann, & Wu Nordahl, 2008), and Alzheimer’s disease (Kowall & Beal, 1988). Gene expression studies revealed patterns that show strong overlap with schizophrenia susceptibility gene networks (Hoerder-Suabedissen et al., 2013). Despite these potentially important clinical aspects, there are only limited studies of WMICs in nonhuman primates. Because apes (gibbons, siamangs, orang-utans, gorillas, chimpanzees, and bonobos) are the closest living relatives of humans, studies of the WMICs in these species can provide a crucial phylogenetic context to understand the evolution of these cell types in the human brain. . To this end, the current study outlines the morphology, distribution, number and certain GABAergic phenotypes of WMICs in the brain of a lar gibbon.
Materials and Methods:
Specimen:
The brain from an adult male lar gibbon (Hylobates lar) (body mass 5.5 kg and brain mass of 112 g) was acquired from the Copenhagen Zoo, Denmark. This gibbon was born at the zoo and was under constant surveillance from the keepers and veterinary staff until euthanasia at 5 years and 6 months. No behavioural problems or stereotypies were observed, and the animal was well integrated in the complex social hierarchy of a gibbon family group. The animal was treated and used according to the guidelines of the University of Witwatersrand Animal Ethics Committee, which correspond with those of the NIH for care and use of animals in scientific experimentation. The animal was obtained after being euthanized with sodium pentobarbital (i.v.) in line with management decisions of the zoo independent of the current study. After being killed, the carotid arteries were cannulated and the head was perfused with an initial rinse of 1 l of 0.9% saline solution at a temperature of 4°C followed by 1 l of 4% paraformaldehyde in 0.1M phosphate buffer (PB) at 4°C. The brain was removed from the skull and post-fixed in 4% paraformaldehyde in 0.1M PB (24 h at 4°C) and allowed to equilibrate in 30% sucrose in 0.1M PB before being stored in an antifreeze solution (Manger et al., 2009).
Immunostaining:
The entire brain was allowed to equilibrate in 30% sucrose in 0.1M PB, and then frozen in crushed dry ice. The frozen brain was mounted to an aluminium stage and coronal sections of 50 μm thickness were cut using a sliding microtome. Seven consecutive series of 1 in 20 sections were used for staining in the current study. The remaining series were placed in antifreeze solution and stored at −20°C for later use. The seven series used were stained for Nissl, myelin, neuronal nuclear marker (NeuN), parvalbumin (PV), calbindin (CB), calretinin (CR) and neuronal nitric oxide (nNOS). Sections used for Nissl staining were mounted on 1% gelatine coated glass slides and then cleared in a solution of 1:1 chloroform and 100% alcohol overnight, after which the sections were then stained with 1% cresyl violet. The myelin series sections were refrigerated for two weeks in 5% formalin then mounted on 2% gelatine coated slides and stained with a modified silver stain (Gallyas, 1979).
The sections used for immunohistochemistry were initially treated for 30 min with an endogenous peroxidase inhibitor (49.2% methanol: 49.2% 0.1M PB: 1.6% of 30% H2O2), followed by three 10 min rinses in 0.1 M PB. The sections were then preincubated at room temperature for 3 h in a blocking buffer solution containing 3% normal serum (normal goat serum, NGS, BioWest, for NeuN, PV, CB, CR, and nNOS sections), 2% bovine serum albumin (BSA, Sigma) and 0.25% Triton X-100 (Merck) in 0.1M PB. The sections were then placed in a primary antibody solution (blocking buffer with appropriately diluted primary antibody) and incubated at 4°C for 48 hours under gentle shaking. Anti-NeuN (ABN78C3, Merck-Millipore, raised in rabbit, at a dilution of 1:500) was used to reveal all WMICs that are neurons. To identify calbinin, calretinin and parvalbumin containing neurons we used anti-calbindin (CB) (CB38a, Swant, raised in rabbit), anti-calretinin (CR) (7699/3H, Swant, raised in rabbit) and anti-parvalbumin (PV) (PV28, Swant, raised in rabbit), all at a dilution of 1:10000. To reveal nNOS neurons we used anti-nNOS (AB5380, Merck-Millipore, raised in rabbit, at a dilution of 1:6000). For all series, this was followed by three 10 min rinses in 0.1M PB, after which the sections were incubated in a secondary anti-rabbit antibody solution for 2 h at room temperature. The secondary antibody solution contained a 1:1000 dilution of biotinylated anti-rabbit IgG (BA-1000, Vector Labs,) in a solution containing 3% NGS and 2% BSA in 0.1M PB. This was followed by three 10 min rinses in 0.1M PB after which the sections were incubated in AB solution (Vector Labs) for 1 h. After three further 10 min rinses in 0.1M PB, the sections were placed in a solution of 0.05% diaminobenzidine in 0.1M PB for five minutes (2 ml/section), followed by the addition of 3 μl of 30% H2O2 to each 1 ml of solution in which each section was immersed. Chromatic precipitation of the sections was monitored visually under a low power stereomicroscope. This process was allowed to continue until the background staining of the sections was appropriate for architectonic analysis without obscuring any immunopositive neurons. The precipitation process was stopped by immersing the sections in 0.1M PB and then rinsing them twice more in 0.1M PB. To check for non-specific staining from the immunohistochemistry protocol, we omitted the primary antibody and the secondary antibody in selected sections, which produced no evident staining. The immunohistochemically stained sections were mounted on 1% gelatine coated slides and left to dry overnight. The sections were then dehydrated in graded series of alcohols, cleared in xylene and cover slipped with Depex.
Antibody characterization and specificity
The antibodies used and associated details are listed in Table 1.
Table 1:
Sources and dilution of antibodies used in the current study.
| Antibody | Host | Immunogen | Manufacturer | Catalogue No. | Reference | Dilution | RRID |
|---|---|---|---|---|---|---|---|
| NeuN | Rabbit | GST-tagged recombinant protein corresponding to mouse NeuN | Merck-Millipore | ABN78C3 | Ngwenya et al., 2016 | 1:500 | AB_11204707 |
| PV | rabbit | Rat muscle parvalbumin | Swant | PV28 | Hirano et al., 2011 | 1:10000 | AB_10000343 |
| CB | rabbit | Rat recombinant calbindin D-28k | Swant | CB38a | Bunce et al., 2013 | 1:10000 | AB_10000340 |
| CR | rabbit | Recombinant human calretinin containing a 6-his tag at the N-terminal | Swant | 7699/3H | Adrio et al., 2011 | 1:10000 | AB_10000321 |
| nNOS | rabbit | Recombinant human neuronal nitric oxide synthase | Merck-Millipore | AB5380 | Russo et al., 2013 | 1:6000 | AB_91824 |
Neuronal nuclear marker (NeuN)
The NeuN rabbit polyclonal antibody was raised against the GST-tagged recombinant protein corresponding to mouse NeuN (ABN78C3; Merck-Millipore; RRID AB_11204707) (Ngwenya, Patzke, Manger, & Herculano-Houzel, 2016). This antibody stained neurons throughout the gibbon brain, but as with other NeuN antibodies it was absent from cerebellar Purkinje cells. This antibody was used at a dilution of 1:500.
Parvalbumin (PV)
To reveal neurons containing the calcium-binding protein parvalbumin, we used the PV28 anti-parvalbumin rabbit polyclonal antibody from Swant (PV28, Swant; RRID AB_10000343) at a dilution of 1:10000. The pattern of immunoreactivity throughout the gibbon brain was similar to that seen in other mammals (e.g. Bhagwandin, Gravett, Bennett, & Manger, 2013; Gritti, Manns, Mainville, & Jones, 2003; Hirano, Brandstatter, Morgans, & Brecha, 2011)
Calbindin (CB)
To reveal neurons containing the calcium-binding protein calbindin, we used the CB38a anti-calbindin rabbit polyclonal antibody from Swant (CB38a, Swant; RRID AB_10000340) at a dilution of 1:10000. The pattern of immunoreactivity throughout the gibbon brain was similar to that seen in other mammals (e.g. Bhagwandin et al., 2013; Bunce, Zikopoulos, Feinberg, & Barbas, 2013; Gritti et al., 2003).
Calretinin (CR)
To reveal neurons containing the calcium-binding protein calretinin, we used the 7699/3H anti-calretinin rabbit polyclonal antibody from Swant (7699/3H, Swant; RRID AB_10000321) at a dilution of 1:10000. The pattern of immunoreactivity throughout the gibbon brain was similar to that seen in other mammals (e.g. Adrio, Rodriguez-Moldes, & Anadon, 2011; Bhagwandin et al., 2013; Gritti et al., 2003).
Neuronal nitric oxide synthase (nNOS)
To reveal neurons containing neuronal nitric oxide synthase we used the AB5380 anti-nNOS rabbit polyclonal antibody from Merck-Millipore (AB5380, Merck-Millipore, RRID AB_91824) at a dilution of 1:6000 (Russo et al., 2013).
Stereological analysis:
For the quantification of WMICs as revealed by NeuN, nNOS, and CR immunohistochemistry we employed an unbiased design-based systematic random sampling stereological protocol. We used an MBF Bioscience (Colchester, Vermont, USA) system with three plane motorised stage, Zeiss.Z2 vario axioimager and StereoInvestigator software (MBF, version 2018.1.1; 64-bit). Separate pilot studies for each immunohistochemical stain were conducted to optimise sampling parameters, such as the counting frame and sampling grid sizes, and to achieve a coefficient of error (CE) below 0.1 (Dell, Patzke, Spocter, Siegel, & Manger, 2016; Gundersen, 1988; West, Slomianka, & Gundersen, 1991). In addition, we measured the tissue section thickness at every sampling site, and the vertical guard zones were determined according to tissue thickness to avoid errors/biases due to sectioning artifacts (Dell et al., 2016; West et. al., 1991). We decided to maintain consistency amongst sampling parameters between the immunohistochemical stained tissue to reduce unfavourable stereological estimation biases. Table 2 provides a detailed summary of the parameters used for each immunohistochemical stain in the current study. One specific concern with counting the WMICs is the determination of the border between the white matter and the deep border of layer 6, or other structures such as the putamen or claustrum. These borders were determined using the rapid decrease in neuronal density, the change in neuronal soma morphologies (as outlined in Mortavazi et al., 2016) and dendritic orientations, the dissolution of the microcolumnar organization of cortical neurons, and the significant decrease of any neuropil or background staining.
Table 2:
Stereological parameters used for estimating neuronal numbers in the white matter of the lar gibbon. NeuN – neuronal nuclear marker; nNos – neuronal nitric oxide synthase; CR – calretinin.
| Stain | Sectioning Plane | Counting frame size (μm) | Sampling grid size (μm) | Disector height (μm) | Section cut thickness (μm) | Measured mounted thickness (μm) | Upper and lower guard zones (μm) | Section interval | Number of sections | Number of sampling sites | Number of objects counted |
|---|---|---|---|---|---|---|---|---|---|---|---|
| NeuN | Coronal | 200 × 200 | 1500 × 1500 | 19 | 50 | 26.5 | 2 | 120 | 10 | 662 | 2843 |
| nNOS | Coronal | 200 × 200 | 1500 × 1500 | 20 | 50 | 25.4 | 2 | 120 | 10 | 763 | 299 |
| CR | Coronal | 200 × 200 | 1500 × 1500 | 20 | 50 | 25.9 | 2 | 120 | 10 | 820 | 403 |
To estimate the total number of WMIC NeuN-immunoreactive neurons, nNOS-immunoreactive neurons, and CR-immunoreactive neurons, we used the optical fractionator probe and the following equation (Dell et al., 2016; West et al., 1991):
Where N was the total estimated neuronal number, Q was the number of neurons counted, SSF was the fraction of the sections sampled, ASF was the area subfraction (which is calculated by the ratio of the size of the counting frame to the size of the sampling grid), and TSF was the thickness subfraction (which is calculated by the ratio of the disector height relative to the section thickness).
To determine WMIC volumes, we used the nucleator probe. For all tissue sampled this probe was used concurrently with the optical fractionator while maintaining strict criteria, e.g. only neurons with complete cell bodies were counted, and obeying all common stereological rules. As the samples violated the assumption of normality and homogeneity of variance, a Mann-Whitney test was used to determine whether the CR+ and nNOS+ WMIC volumes were significantly different. Likewise, we report the median for neuronal volumes of WMICs as revealed by NeuN, nNOS and CR immunostaining. All statistical analyses were carried out using PAST statistical software (version 3.12; Hammer, Harper, & Ryan, 2001).
To estimate the volume of the white matter in the brain of the gibbon studied, the surface area of regions of interest demarcated in each section during the process used to estimate total WMIC numbers were used to generate an estimated cumulative volume for the white matter using automated algorithms installed as part of the StereoInvestigator software (MBF, version 2018.1.1; 64-bit). Brain volume was estimated by dividing the brain mass by the specific gravity of brain tissue (1.036) (Stephan, Frahm & Baron, 1981). To quantitatively assess variations in densities of WMICs throughout the white matter, “spot densities” were calculated at each disector sampling site used for the optical fractionator probe for the NeuN stained tissue (662 sampling sites). This was not undertaken for the CR and nNOS stained sections, as the number of objects identified at each sampling site was too low to provide adequate resolution. The number of objects observed in each disector was divided by the volume of the disector probe (100 μm × 100 μm × section cut thickness minus guard zones, approximately 40 μm but this varied between sites) and converted to a density per cubic millimetre. These data were divided into three groups, with appropriate subsets, for further analysis: (1) in relation to distance from the inner border of the cerebral cortex (measured as the distance between the nearest cortical border and the centre of the sampling site); (2) in relation to the lobe in which the sampling site was located; and (3) in relation to when the sampling site was located within 400 μm of a gyral crown or a fundus. The relationship between distance from the inner cortical border and spot density (1) and the spot densities between different lobes (2) were assessed using a Kruskal-Wallis test and, where significant, with Bonferroni corrected Mann-Whitney U tests. The difference between crown and fundus spot densities (3) was assessed using a Mann-Whitney U test. The results are presented as violin plots.
Results:
The telencephalic white matter of the lar gibbon brain occupies a significant portion of each cerebral hemisphere (Figs. 1a, 2a, 3a, 4a). The general appearance of the white matter, including shape, does not differ from that generally observed in other primate species. We estimated that the volume of the white matter in both cerebral hemispheres (uncorrected for shrinkage) was approximately 15.6 cm3, being approximately 13% of the total volume of the brain, thereby representing a substantial portion of the brain. Throughout the telencephalic white matter immunohistochemical staining for NeuN, nNOS, calretinin and parvalbumin revealed the presence of WMICs, being observed as most dense close to the deep surface of the cerebral cortex and decreasing in density with depth in the brain. No WMICs were observed to be immunoreactive to calbindin.
Figure 1:
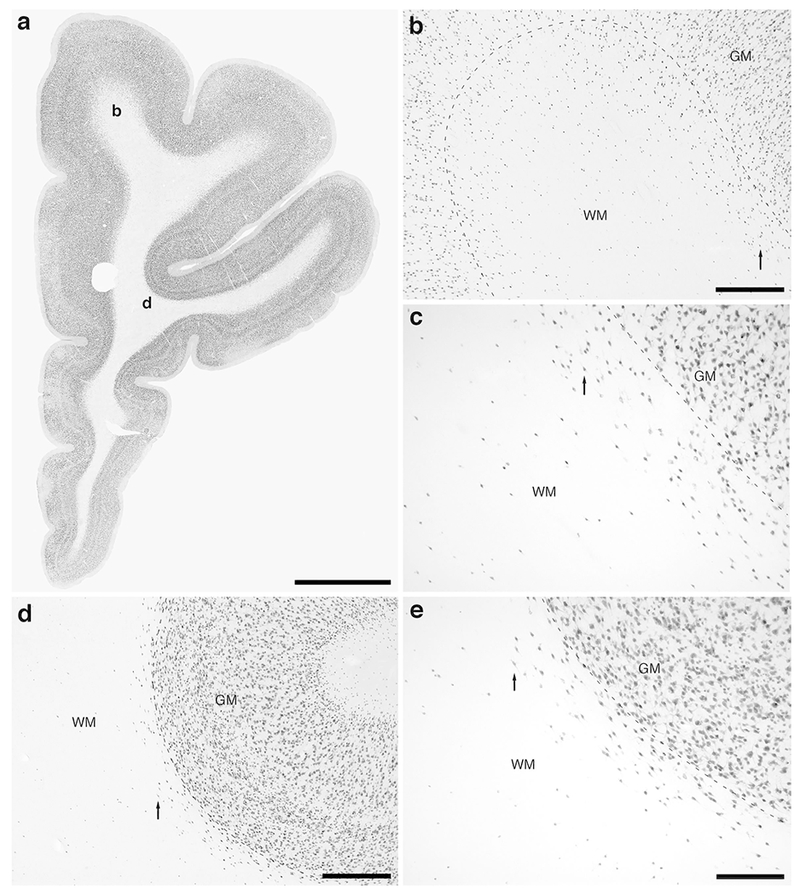
Photomicrographs of neuronal nuclear marker (NeuN) immunostaining in a coronal section through the rostral portion of the frontal lobe of the lar gibbon, deep to the granular prefrontal cortex, showing the distribution of infracortical white matter interstitial cells (WMICs), presumably neurons. (a) Low magnification image of the entire section through the right frontal lobe of the lar gibbon stained with NeuN, showing the presence of numerous cells deep to the cortex. (b) Moderately magnified image of the superior frontal gyrus (from the region indicated by the b in image a), showing the numerous WMICs deep to the cerebral cortex (grey matter, GM) within the infracortical white matter (WM). The approximate boundary of the deep border of cortical layer VI and the WM is marked by a dashed line. (c) High magnification image of the cortical/white matter boundary (marked by a dashed line) of the superior frontal gyrus, showing the WMICs deep to the cerebral cortex within the WM. Arrows in b and c indicate the same neuron for orientation of image location. (d) Moderately magnified image of the fundus of the inferior frontal gyrus (from the region indicated by the d in image a), showing WMICs deep to the cerebral cortex (GM) within the WM. The approximate boundary of the deep border of cortical layer VI and the WM is marked by a dashed line. (e) High magnification image of the cortical/white matter boundary (marked by a dashed line) of the fundus of the inferior frontal gyrus, showing the WMICs deep to the cerebral cortex within the WM. Arrows in d and e indicate the same neuron for orientation of image location. Scale bar in a = 5 mm and applies to a only. Scale bars in b and d = 500 μm and apply to b and d only. Scale bar in e = 250 μm and applies to c and e. In all images dorsal is to the top of the image and medial to the left.
Figure 2:
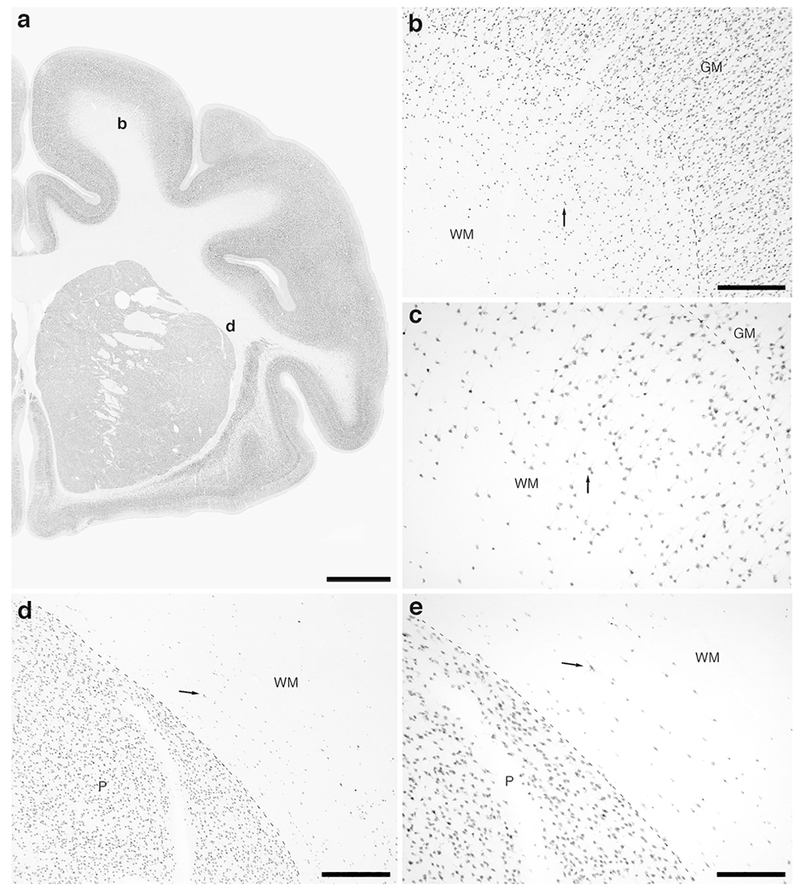
Photomicrographs of NeuN immunostaining in a coronal section through the caudal portion of the frontal lobe of the lar gibbon, showing WMICs. All conventions as in Fig. 1. (a) Low magnification image of the entire section through the right frontal lobe of the lar gibbon stained with NeuN, showing the high density of cells within the cerebral cortex and the presence of numerous cells deep to the cortex. (b) Moderately magnified image of the primary motor cortex (from the region indicated by the b in image a), showing the numerous WMICs deep to the cerebral cortex (grey matter, GM) within the infracortical white matter (WM). (c) High magnification image of the cortical/white matter boundary (marked by a dashed line) of the primary motor cortex, showing the WMICs below the cerebral cortex. (d) Moderately magnified image of the base of the WM adjacent to the putamen nucleus (P, from the region indicated by the d in image a), showing WMICs within the deep WM. (e) High magnification image of the P/WM boundary (marked by a dashed line), showing the WMICs in the deep WM. Scale bar in a= 5 mm and applies to a only. Scale bars in b and d = 500 μm and apply to b and d only. Scale bar in e = 250 μm and applies to c and e. In all images dorsal is to the top of the image and medial to the left.
Figure 3:
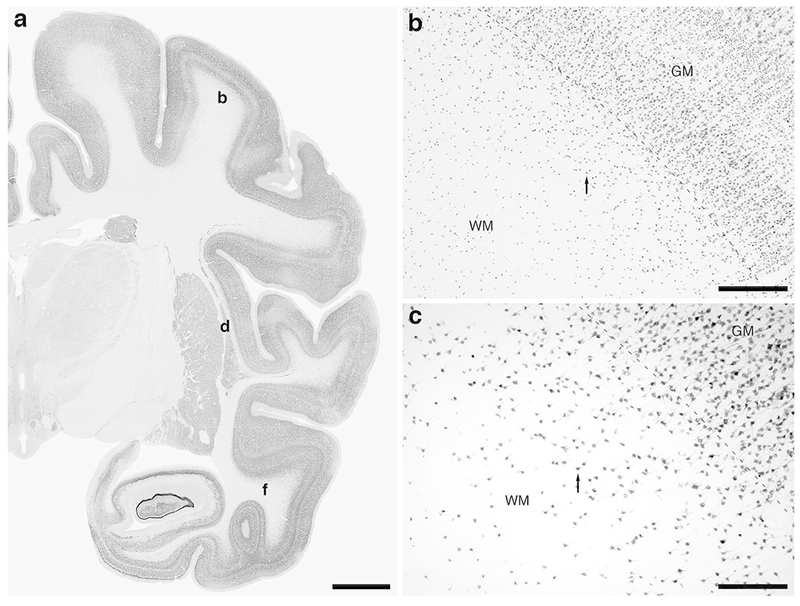
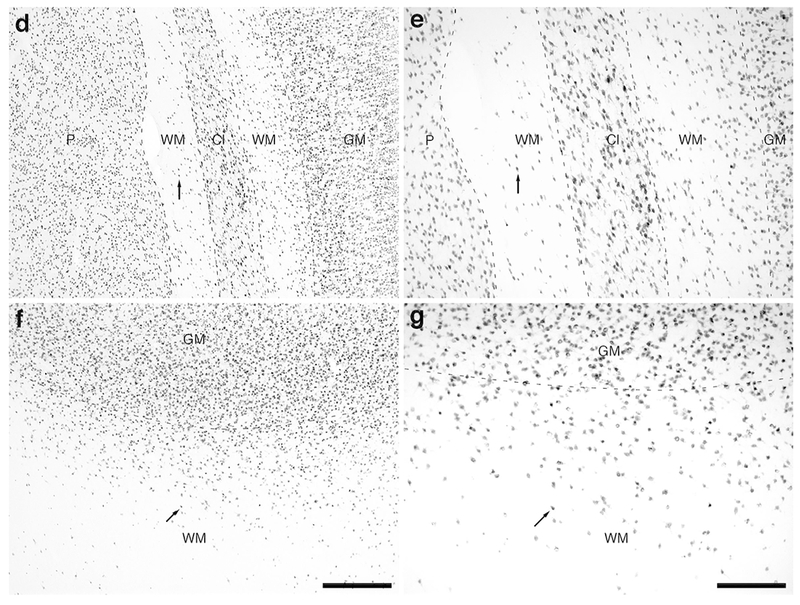
Photomicrographs of NeuN immunostaining in a coronal section through the rostral portion of the parietal lobe, the claustrum/insular cortex and the temporal lobe of the lar gibbon, showing the distribution of WMICs. All conventions as in Fig. 1. (a) Low magnification image of the entire section stained with NeuN, showing the high density of cells within the cerebral cortex and the presence of numerous cells deep to the cortex. (b) Moderately magnified image of the somatosensory cortex (from the region indicated by the b in image a), showing the numerous WMICs deep to the cerebral cortex (grey matter, GM). (c) High magnification image of the cortical/white matter boundary (marked by a dashed line) of the somatosensory cortex, showing the WMICs. (d) Moderately magnified image showing the putamen nucleus (P), claustrum (Cl) and insular cortex (GM), from the region indicated by the d in image a, showing WMICs within the deep WM. (e) High magnification image of the claustrum and surrounding white matter, showing the WMICs in the deep WM. (f) Moderately magnified image of the temporal cortex (from the region indicated by the f in image a), showing WMICs deep to the cerebral cortex within the WM. The approximate boundary of the deep border of cortical layer VI and the WM is marked by a dashed line. (g) High magnification image of the cortical/white matter boundary (marked by a dashed line) of the base of the temporal cortex, showing the WMICs deep to the temporal cortex within the WM. Scale bar in a = 5 mm and applies to a only. Scale bars in b and f = 500 μm and applies to b, d and f. Scale bars in c and g = 250 μm and applies to c, e and g. In all images dorsal is to the top of the image and medial to the left.
Figure 4:
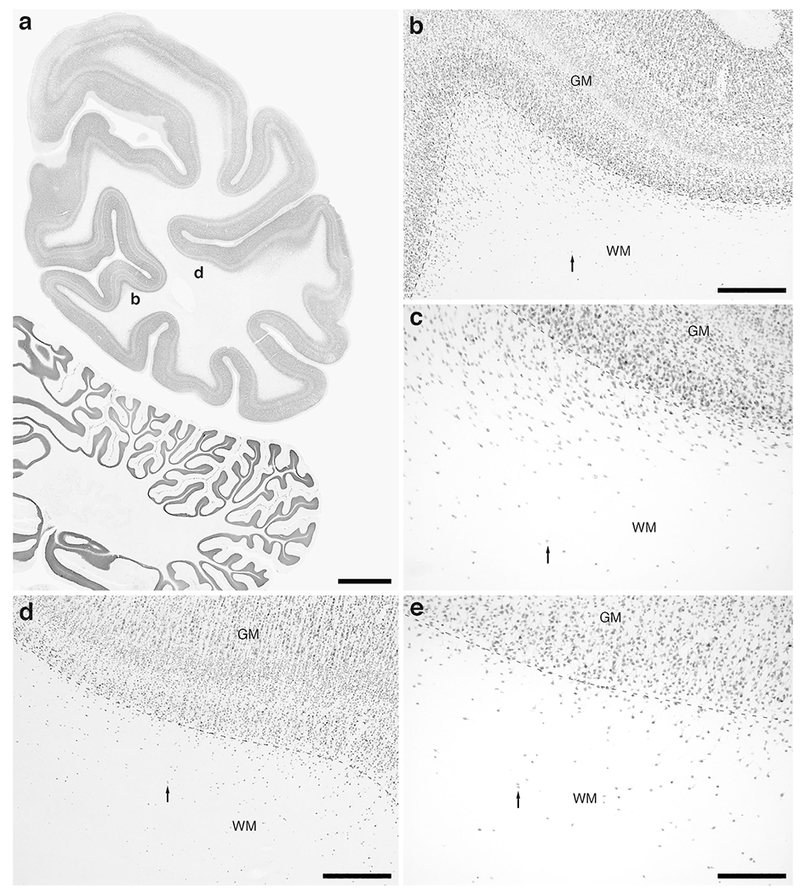
Photomicrographs of NeuN immunostaining in a coronal section through the occipital lobe of the lar gibbon, showing the distribution of WMICs. All conventions as in Fig. 1. (a) Low magnification image of the entire section through the right occipital lobe of the lar gibbon stained with NeuN, showing the high density of cells within the cerebral cortex and the presence of numerous cells deep to the cortex. (b) Moderately magnified image of the striate cortex, presumably primary visual cortex (from the region indicated by the b in image a), showing the numerous WMICs deep to the cerebral cortex (grey matter, GM) within the infracortical white matter (WM). (c) High magnification image of the cortical/white matter boundary (marked by a dashed line) of the striate cortex, showing the WMICs deep to the cerebral cortex within the WM. (d) Moderately magnified image of the extrastriate cortex, presumably secondary visual cortex (from the region indicated by the d in image a), showing the numerous WMICs deep to the cerebral cortex (grey matter, GM) within the infracortical white matter (WM). (e) High magnification image of the cortical/white matter boundary (marked by a dashed line) of the extrastriate cortex, showing the WMICs deep to the cerebral cortex within the WM. Scale bar in a = 5 mm and applies to a only. Scale bars in b and d = 500 μm and apply to b and d only. Scale bar in e = 250 μm and applies to c and e. In all images dorsal is to the top of the image and medial to the left.
Distribution, numbers and cell volumes and densities of white matter interstitial cells (WMIC) as revealed with neuronal nuclear marker immunostaining
Immunohistochemical staining for NeuN revealed immunopositive WMICs throughout the infracortical white matter in the brain of the lar gibbon (Figs. 1–4). Stereological analysis of WMICs immunostained with NeuN produced an estimate of a total of 67 642 736 neurons (Table 3). As the distribution of the WMIC somal volumes revealed with NeuN staining was not normal, we report the median volume. The median volume of the somata of WMICs immunostained with NeuN was 615.6 μm3, with a range of 63.6 – 3 716.6 μm3 (Table 3; Fig. 5). Frequency distribution analysis did not reveal clearly different distribution peaks, which would be suggestive of the presence of different cell-size classes, despite using a range of bin sizes for analysis (Fig. 5a). A broad variety of somal shapes was observed, including pyramidal, ovoid and stellate, with most of these neurons being either bipolar or multipolar.
Table 3:
Stereological results for neuronal numbers and volumes of subcortical white matter interstitial cells in the lar gibbon. n = number
| Stain | Estimate of cell numbers | CE (Gunderson m = 1) | Median cell volume (μm3) (n) | Cell volume range (μm3) | CE |
|---|---|---|---|---|---|
| NeuN | 67,642,736 | 0.03 | 615.9 (2843) | 63.6 – 3716.6 | 0.0001 |
| nNOS | 7,016,456 | 0.06 | 817.8 (299) | 110.6 – 2899.8 | 0.001 |
| CR | 8,601,078 | 0.05 | 619.4 (403) | 56.2 – 1952.7 | 0.001 |
Figure 5:
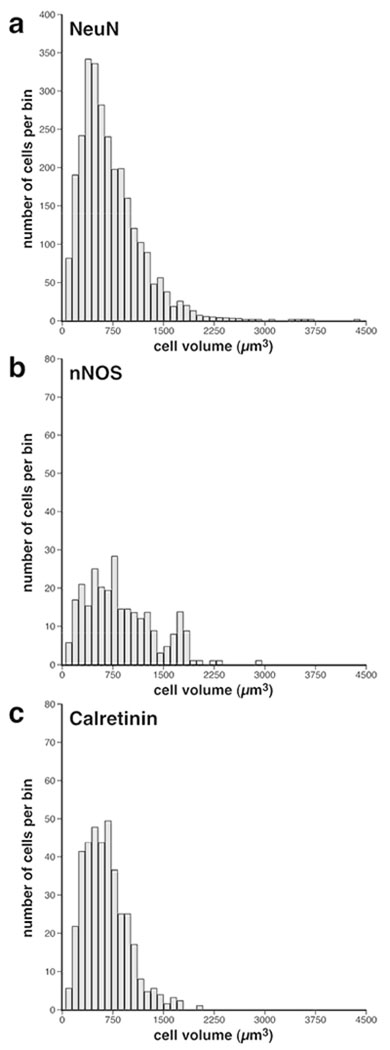
Frequency distribution bar plots of somal volumes of WMICs in the brain of the lar gibbon. (a) Volumes of the soma of WMICs immunoreactive to neuronal nuclear marker (NeuN). Note the median volume is 615.9 μm3, with a range from 63.6 to 3 716.6 μm3. (b) Volumes of the soma of WMICs immunoreactive to neuronal nitric oxide synthase (nNOS). Note the median volume is 817.8 μm3, with a range from 110.6 to 2 899.8 μm3. (c) Volumes of the soma of WMICs immunoreactive to calretinin. Note the median volume is 619.4 μm3, with a range from 56.2 to 1 952.7 μm3. In all plots the bin width = 92.9 μm3.
The majority of the NeuN-immunoreactive WMICs were found in close proximity to the inner border of cortical layer 6, with a qualitatively observable decrease in density of stained neurons with depth in the white matter (Figs. 1, 6a). This decrease in density was supported with analyses of “spot densities” at different distances from the inner cortical border (Fig. 6a). The density of WMICs decreased with distance from the grey matter (Hc = 86.02; p = 9.202×10⁻¹⁸), with the post-hoc analyses (Bonferroni corrected Mann-Whitney U tests) revealing that the median density of sites sampled between 100-200 μm from the inner cortical border (x̃ = 12500 neurons/mm3) was not different from that of the sampled sites between 200-400 μm from the inner cortical border (x̃ = 18700 neurons/mm3, p = 0.9821). However, a significant decrease in density was noted in the sites 400-600 μm deep to the cortical border (x̃ = 6300 neurons/mm3, p = 0.0490). A similar significant decrease in neuronal density was noted when comparing sites 400-600 μm deep to the inner cortical border with sites located 600-800 μm deep to the inner cortical border (x̃ = 6300 neurons/mm3, p = 0.0008). As the median neuronal densities observed in sampling sites located 400-600 and 600-800 μm deep to the inner cortical border were identical, the significance of the Mann-Whitney U test suggests that the distribution of densities in site located 400-600 μm deep to the inner cortical surface was significantly more variable and possessed many more points of higher density than in sites sampled 600-800 μm deep to the inner cortical border (Hart, 2001). There was no difference between the median neuronal densities observed in sampling sites located between 600-800 and 800+ deep to the inner cortical surface (x̃ = 6300 neurons/mm3, p =0.8957). Thus, the qualitative impression that the density of neurons decreases with distance from the inner cortical border is supported with the analysis of spot densities taken at a range of distances from the inner cortical border.
Figure 6:
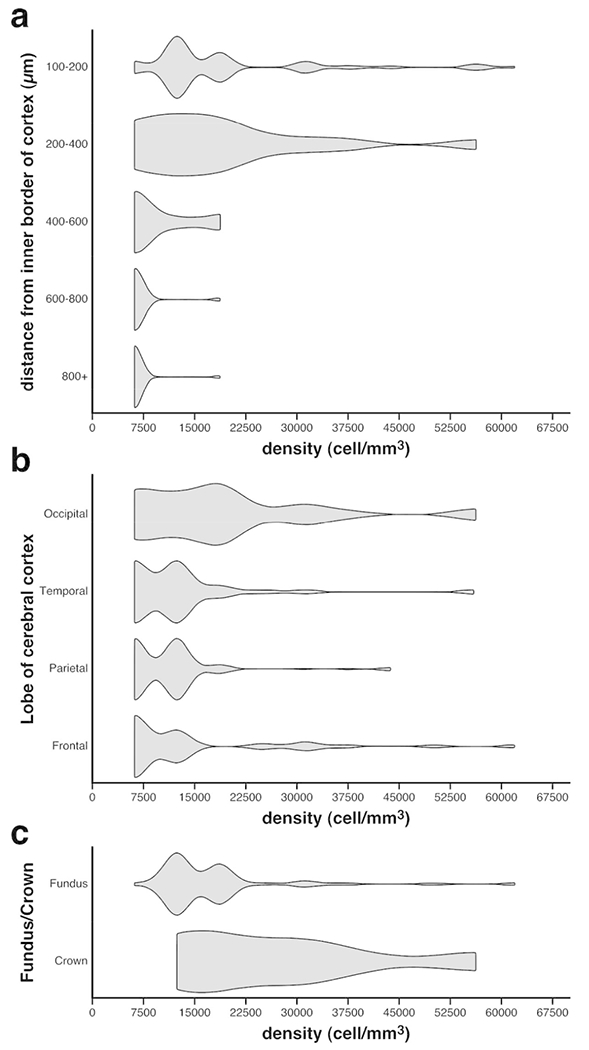
Violin plots of the relationship between the spot densities of WMICs immunoreactive to NeuN against the depth in the white matter (a), within the different cortical lobes (b) and in the white matter deep to gyral crowns and sulcal fundi (c). Note (a) the decrease in WMIC densities with increasing depth in the white matter, (b) that the occipital lobe appears to have higher overall densities of WMICs than the other lobes, with the frontal lobe having the lowest overall densities, and (c) that the densities of WMICs are higher beneath gyral crowns than beneath sulcal fundi.
As assessed qualitatively, the white matter deep to the occipital lobe appeared to have more NeuN+ neurons than the frontal, parietal and temporal lobes (Figs. 1–4). Specifically, the white matter surrounding the claustrum (the external and extreme capsules, Figs. 3d,e) and the white matter deep to the primary visual cortex (Figs. 4b,c) appeared to have the highest densities of NeuN+ neurons. Our analysis of spot densities in each lobe, using a Kruskal-Wallis test, suggests that WMIC densities indeed significantly vary between the different lobes (Hc = 35.55; p = 9.318×10⁻⁸) (Fig. 6b). Bonferroni corrected Mann-Whitney post-hoc analyses showed the occipital lobe to possess a higher median WMIC density (x̃ = 18800 neurons/mm3) than the frontal (x̃ = 6300 neurons/mm3, p = 0.0017), parietal (x̃ = 12500 neurons/mm3, p = 2.342×10⁻⁸), and temporal lobes (x̃ = 12500 neurons/mm3, p = 0.0003); however, the WMIC densities in the frontal, parietal and temporal lobes did not differ from one another (p > 0.05) (Fig. 6b). In addition, there appeared to be more neurons located deep to the gyral crowns, while deep to the sulcal fundi the number of stained neurons appears lower (see Fig. 4b for example). A Mann-Whitney U test of spot densities located within 400 μm of the inner cortical border revealed that the white matter deep to the gyral crowns possessed a significantly greater median density of cells than the white matter located deep to the sulcal fundi (x̃ = 25000 neurons/mm3 and x̃ = 12500 neurons/mm3, respectively; p = 3.986×10⁻⁵) (Fig. 6c).
Distribution, numbers and cells volumes of white matter interstitial cells as revealed with neuronal nitric oxide synthase immunostaining
WMICs immunoreactive to neuronal nitric oxide synthase (nNOS+) were observed throughout the infracortical white matter of the gibbon brain, from deep to the prefrontal granular cortex through to the striate cortex (Figs. 7–10). While the majority of these nNOS+ WMICs were found close to the deep border of the cerebral cortex, they were also observed in substantial numbers in the very deep aspects of the white matter in close apposition to other infracortical telencephalic structures (Figs. 8c, 8d, 9c, 9d). The majority of the nNOS+ WMICs observed were bipolar with ovoid shaped soma, although occasional multipolar WMICs were noted. The nNOS immunostaining revealed that the dendrites of these WMICs branched extensively and often within close proximity to the soma, with tertiary dendritic branches often observed (Figs. 7–10).
Figure 7:
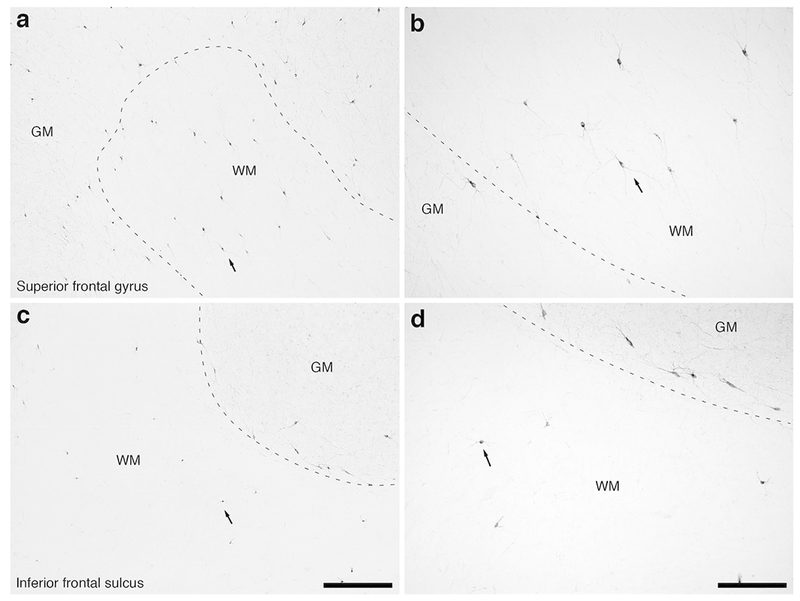
Photomicrographs of neuronal nitric oxide synthase (nNOS) immunostaining in the rostral portion of the frontal lobe of the lar gibbon showing the distribution of WMICs immunoreactive to nNOS. (a) Moderately magnified image of the superior frontal gyrus (from the region indicated by the b in Fig. 1a), showing the numerous nNOS-immunoreactive WMICs deep to the cerebral cortex (grey matter, GM, white matter, WM). The approximate boundary of the deep border of cortical layer VI and the WM is marked by a dashed line. (b) High magnification image of the cortical/white matter boundary (marked by a dashed line) of the superior frontal gyrus, showing the nNOS-immunoreactive WMICs deep to the cerebral cortex. Arrows in a and b indicate the same neuron for orientation of image location. (c) Moderately magnified image of the fundus of the inferior frontal gyrus (from the region indicated by the d in Fig. 1a), showing the nNOS-immunoreactive WMICs deep to the cerebral cortex (GM) within the WM. The approximate boundary of the deep border of cortical layer VI and the WM is marked by a dashed line. (d) High magnification image of the cortical/white matter boundary (marked by a dashed line) of the fundus of the inferior frontal gyrus, showing the nNOS-immunoreactive WMICs deep to the cerebral cortex within the WM. Arrows in c and d indicate the same neuron for orientation of image location. Scale bar in c = 500 μm and apply to a and c. Scale bar in d = 250 μm and applies to b and d. In all images dorsal is to the top of the image and medial to the left.
Figure 10:
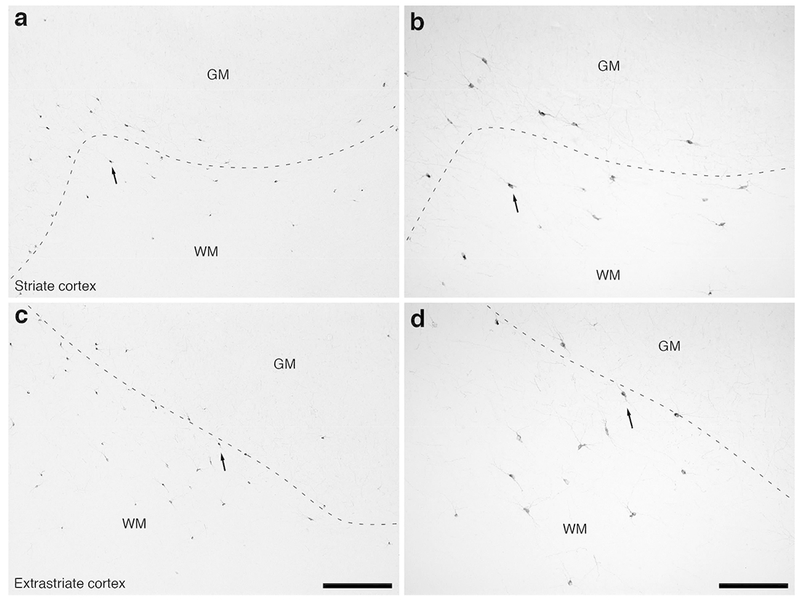
Photomicrographs of nNOS immunostaining in the occipital lobe of the lar gibbon, showing the distribution of WMICs immunoreactive to nNOS. All conventions as in Fig. 7. (a) Moderately magnified image of the striate cortex, presumably primary visual cortex (from the region indicated by the b in Fig. 4a), showing the nNOS-immunoreactive WMICs. (b) High magnification image of the cortical/white matter boundary (marked by a dashed line) of the striate cortex, showing the nNOS-immunoreactive WMICs deep to the cerebral cortex. (c) Moderately magnified image of the extrastriate cortex, presumably secondary visual cortex (from the region indicated by the d in Fig. 4a), showing the numerous nNOS-immunoreactive WMICs. (d) High magnification image of the cortical/white matter boundary (marked by a dashed line) of the extrastriate cortex, showing the nNOS-immunoreactive WMICs. Scale bars in c = 500 μm and applies to a and c. Scale bar in d = 250 μm and applies to b and d. In all images dorsal is to the top of the image and medial to the left.
Figure 8:
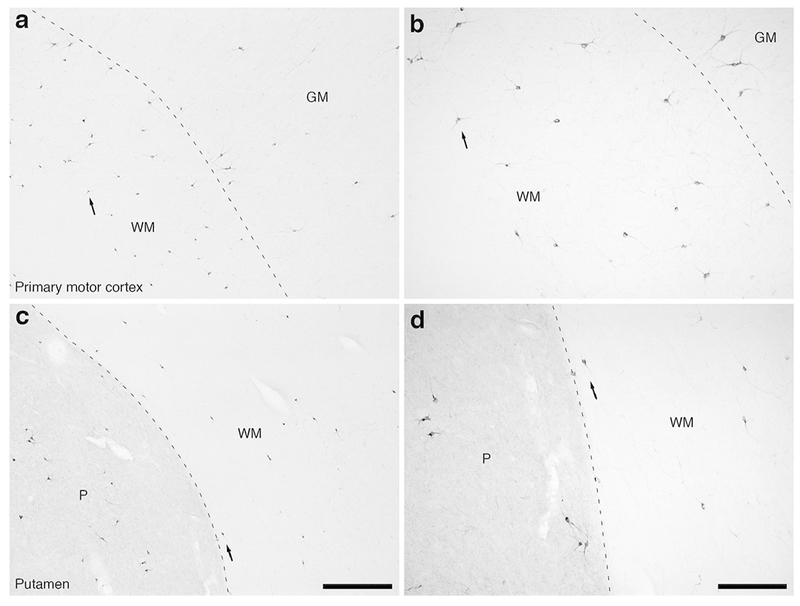
Photomicrographs of nNOS immunostaining in the caudal portion of the fronta lobe of the lar gibbon, showing the distribution of WMICs immunoreactive to nNOS. All conventions as in Fig. 7. (a) Moderately magnified image of the primary motor cortex (from the region indicated by the b in Fig. 2a), showing the numerous nNOS-immunoreactive WMICs within the infracortical white matter (WM). (b) High magnification image of the cortical/white matter boundary (marked by a dashed line) of the primary motor cortex, showing the nNOS-immunoreactive WMICs deep to the cerebral cortex. Arrows in a and b indicate the same neuron for orientation of image location. (c) Moderately magnified image of the WM adjacent to the putamen nucleus (P, from the region indicated by the d in Fig. 2a), showing the nNOS-immunoreactive WMICs within the deep WM. (d) High magnification image of the WM adjacent to the putamen nucleus showing the nNOS-immunoreactive WMICs within the deep WM. Arrows in c and d indicate the same neuron for orientation of image location. Scale bar in c = 500 μm and apply to a and c. Scale bar in d = 250 μm and applies to b and d. In all images dorsal is to the top of the image and medial to the left.
Figure 9:
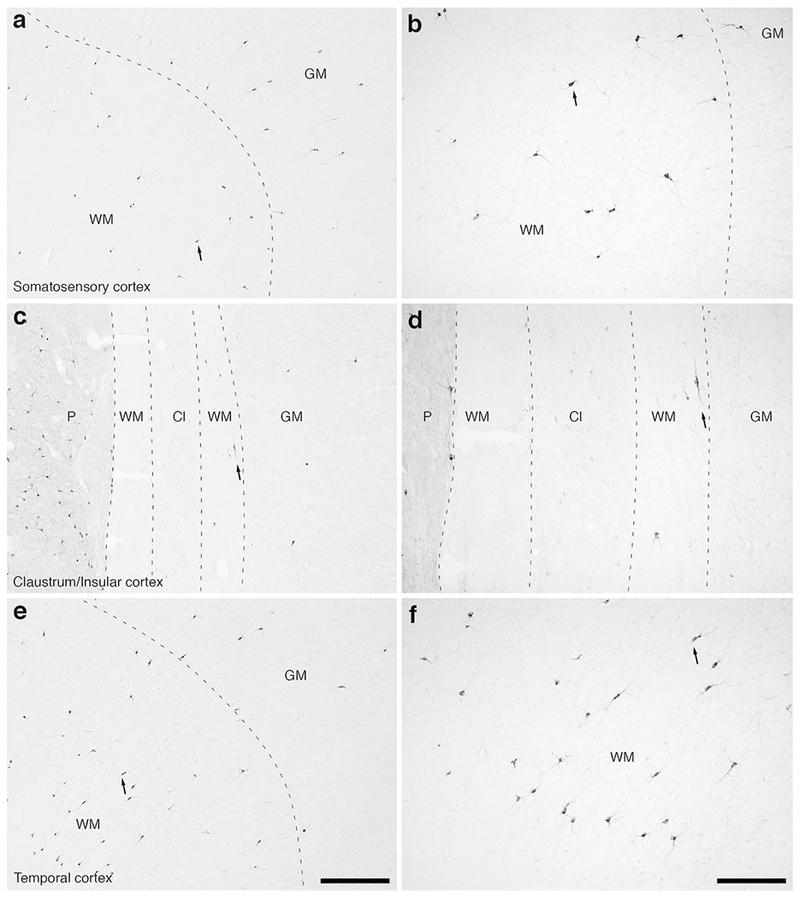
Photomicrographs of nNOS immunostaining in the rostral portion of the parietal lobe, the claustrum/insular cortex and the temporal lobe of the lar gibbon, showing the distribution of WMICs immunoreactive to nNOS. All conventions as in Fig. 7. (a) Moderately magnified image of the somatosensory cortex (from the region indicated by the b in Fig. 3a), showing the numerous nNOS-immunoreactive WMICs. (b) High magnification image of the cortical/white matter boundary (marked by a dashed line) of the somatosensory cortex, showing the nNOS-immunoreactive WMICs. (c) Moderately magnified image showing the putamen nucleus (P), claustrum (Cl) and insular cortex (GM), from the region indicated by the d in Fig. 3a, showing nNOS immunoreactive WMICs within the deep WM. (d) High magnification image of the claustrum and surrounding white matter, showing the nNOS-immunoreactive WMICs in the deep WM. (e) Moderately magnified image of the temporal cortex (from the region indicated by the f in Fig. 3a), showing nNOS-immunoreactive WMICs. (f) High magnification image of the cortical/white matter boundary (marked by a dashed line) of the base of the temporal cortex, showing the nNOS-immunoreactive WMICs within the WM. Scale bar in e = 500 μm and applies to a, c and e. Scale bar in f = 250 μm and applies to b, d and f. In all images dorsal is to the top of the image and medial to the left.
Stereological analysis of WMICs immunostained with nNOS found a total number of 7 016 456 nNOS+ WMICs, thereby representing approximately 10.4% of the total WMIC neuronal population (Table 3). The median volume of the soma of the WMICs immunostained with nNOS was 817.8 μm3, with a range of 110.6 – 2 899.8 μm3 (Table 3; Fig. 5). Frequency distribution analysis revealed the possibility of two peaks in the volumes of nNOS+ soma, one around 750 μm3 and another around 1 800 μm3 (Fig. 5b).
Distribution, numbers and cells volumes of white matter interstitial cells as revealed with calretinin immunostaining
Neurons immunopositive for calretinin staining (CR+) were found throughout the infracortical white matter of the lar gibbon brain, from the frontal lobe through the parietal and temporal lobes to the occipital lobe (Figs. 11–14). As with the other neurons revealed through immunostaining in this study, the majority of these neurons were located close to the inner surface of the cerebral cortex, decreasing in density with depth in the white matter from the cortex. Additionally, our qualitative impression indicated that the numbers of CR+ WMICs were higher in the frontal lobe and lower in the occipital lobe (compare Fig. 11 with Fig. 14). The one exception to this general trend was the slightly higher density of these CR+ neurons in the white matter surrounding the claustrum, especially in the extreme capsule (Fig. 13c,d). All the CR+ WMICs observed appeared to be bipolar, with an ovoid shaped soma. In the majority of cases, the dendrites of the CR+ neurons appeared to be oriented parallel with the predominant direction of the axonal pathways, although in some cases the dendrites were observed to run orthogonal to these pathways (Figs. 11–14). The dendrites revealed with CR immunostaining did not show significant ramifications.
Figure 11:
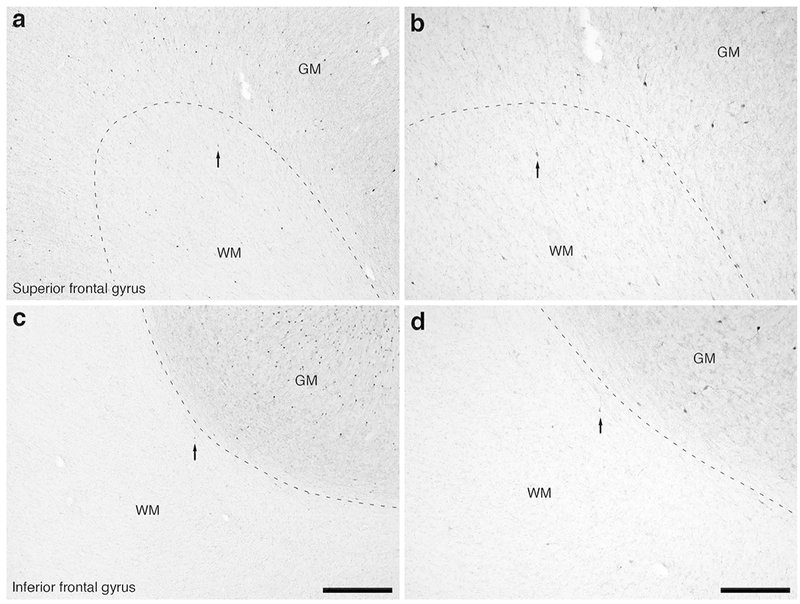
Photomicrographs of calretinin (CR) immunostaining in the rostral portion of the frontal lobe of the lar gibbon showing the distribution of WMICs immunoreactive to CR. (a) Moderately magnified image of the superior frontal gyrus (from the region indicated by the b in Fig. 1a), showing the numerous CR-immunoreactive WMICs. (b) High magnification image of the cortical/white matter boundary (marked by a dashed line) of the superior frontal gyrus, showing the CR-immunoreactive WMICs deep to the cerebral cortex within the WM. Arrows in a and b indicate the same neuron for orientation of image location. (c) Moderately magnified image of the fundus of the inferior frontal gyrus (from the region indicated by the d in Fig. 1a), showing the CR-immunoreactive WMICs. (d) High magnification image of the cortical/white matter boundary of the fundus of the inferior frontal gyrus, showing the CR-immunoreactive WMICs deep to the cerebral cortex. Arrows in c and d indicate the same neuron for orientation of image location. Scale bar in c = 500 μm and apply to a and c. Scale bar in d = 250 μm and applies to b and d. In all images dorsal is to the top of the image and medial to the left.
Figure 14:
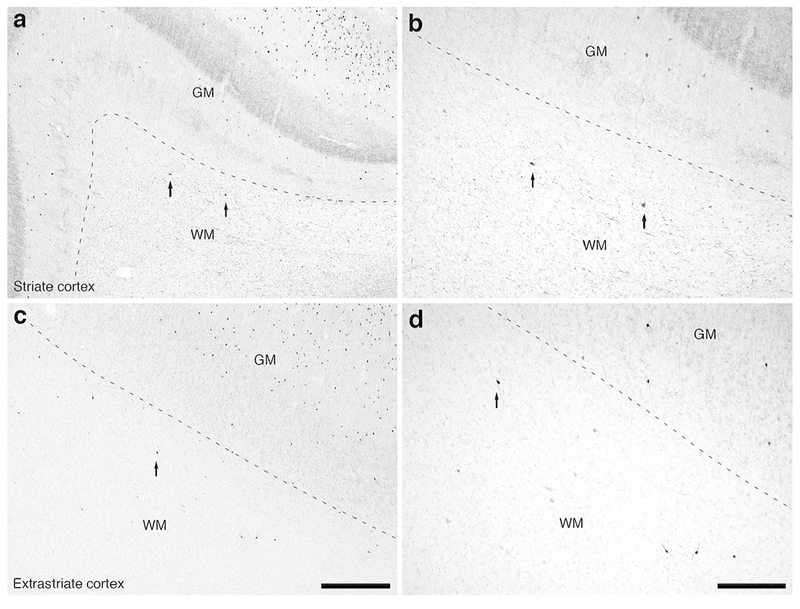
Photomicrographs of CR immunostaining in the occipital lobe of the lar gibbon, showing the distribution of WMICs immunoreactive to CR. (a) Moderately magnified image of the striate cortex, presumably primary visual cortex (from the region indicated by the b in Fig. 4a), showing the occasional CR-immunoreactive WMIC. (b) High magnification image of the cortical/white matter boundary (marked by a dashed line) of the striate cortex, showing the CR-immunoreactive WMICs deep to the cerebral cortex. (c) Moderately magnified image of the extrastriate cortex, presumably secondary visual cortex (from the region indicated by the d in Fig. 4a), showing the more numerous CR-immunoreactive WMICs. (d) High magnification image of the cortical/white matter boundary (marked by a dashed line) of the extrastriate cortex, showing the CR-immunoreactive WMICs. Scale bar in c = 500 μm and applies to a and c. Scale bar in d = 250 μm and applies to b and d. In all images dorsal is to the top of the image and medial to the left.
Figure 13:
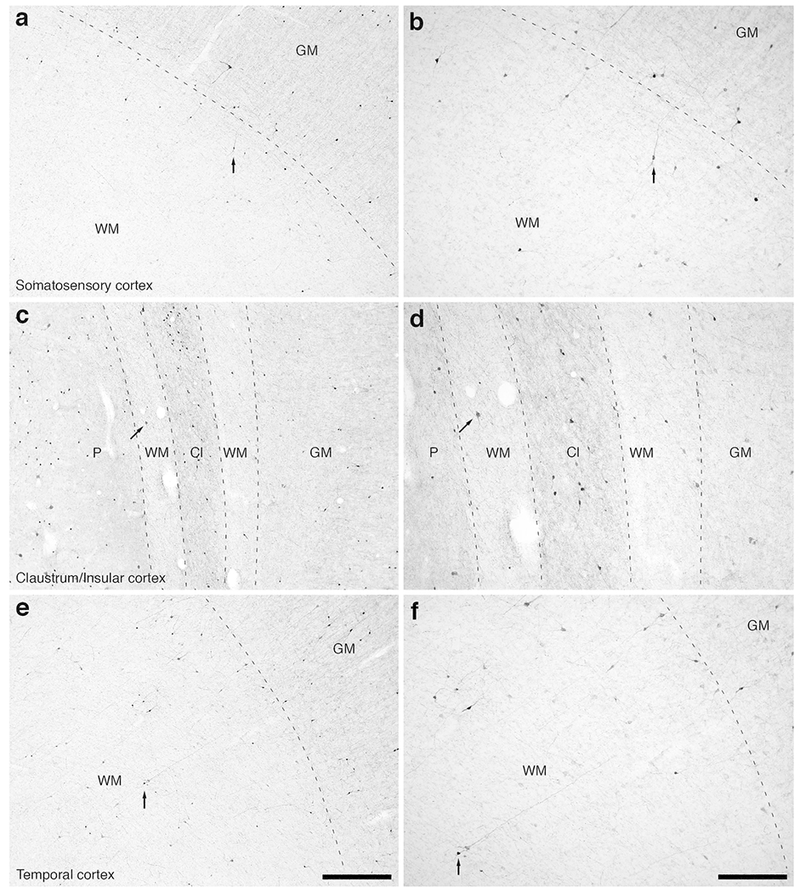
Photomicrographs of CR immunostaining in the rostral portion of the parietal lobe, the claustrum/insular cortex and the temporal lobe of the lar gibbon, showing the distribution of WMICs immunoreactive to CR. (a) Moderately magnified image of the somatosensory cortex (from the region indicated by the b in Fig. 3a), showing the numerous CR-immunoreactive WMICs. (b) High magnification image of the cortical/white matter boundary (marked by a dashed line) of the somatosensory cortex, showing the CR-immunoreactive WMICs. (c) Moderately magnified image showing the putamen nucleus (P), claustrum (Cl) and insular cortex (GM), from the region indicated by the d in Fig. 3a, showing CR-immunoreactive WMICs within the deep WM. (d) High magnification image of the claustrum and surrounding white matter, showing the CR-immunoreactive WMICs in the deep WM. (e) Moderately magnified image of the temporal cortex (from the region indicated by the f in Fig. 3a), showing CR-immunoreactive WMICs. (f) High magnification image of the cortical/white matter boundary (marked by a dashed line) of the base of the temporal cortex, showing the CR-immunoreactive WMICs. Scale bar in e = 500 μm and applies to a, c and e. Scale bar in f= 250 μm and applies to b, d and f. In all images dorsal is to the top of the image and medial to the left.
Stereological analysis of WMICs immunostained with calretinin (CR+) estimated the total number of CR+ WMICs as 8 601 078, thereby representing approximately 12.7% of the total WMIC neuronal population (Table 3). The median volume of the soma of the WMICs immunostained with CR, based on analysis of 403 measurements of soma volumes, was 619.4 μm3, with a range of 56.2 – 1 952.7 μm3 (Table 3; Fig. 5). Frequency distribution analysis did not reveal clearly different distribution peaks (Fig. 5c). Thus, the CR+ WMICs were, on average, the smallest neurons quantified in the current study and appear to represent a distinct single neuronal size class. The result of the Mann-Whitney test supports the suggestion that the CR+ soma volumes were significantly smaller than those of the nNOS+ neurons (U.025[299,403] = 44428, P = 2.6117×10−09), indicating that both neurochemically and morphologically, the CR+ and nNOS+ neurons form different neuronal populations.
Distribution of white matter interstitial cells as revealed with parvalbumin immunostaining
Parvalbumin immunoreactive (PV+) WMICs evinced a very sparse distribution throughout the infracortical white matter (Figs. 15, 16), often with only one or two cells observed in each coronal section. Due to the small numbers of cells immunopositive for PV, no quantification was undertaken. The majority of WMICs observed to be PV+ were located in the frontal lobe, being found mostly deep to the motor cortical regions (Fig. 15c, d), but were also present deep to the granular prefrontal cortex (Fig. 15a) and in the white matter of the temporal lobe (Fig. 16a). The majority of the PV+ WMICs were found near to the cerebral cortex, being observed in the white matter deep to the gyral crowns, with only a few PV+ WMICs being observed in the deeper aspects of the white matter. The more superficial WMICs were observed to be lightly stained multipolar cells of moderate somal size (Fig. 16a inset), while those observed in the deeper white matter had smaller somal sizes, were also multipolar, but were more intensely stained.
Figure 15:
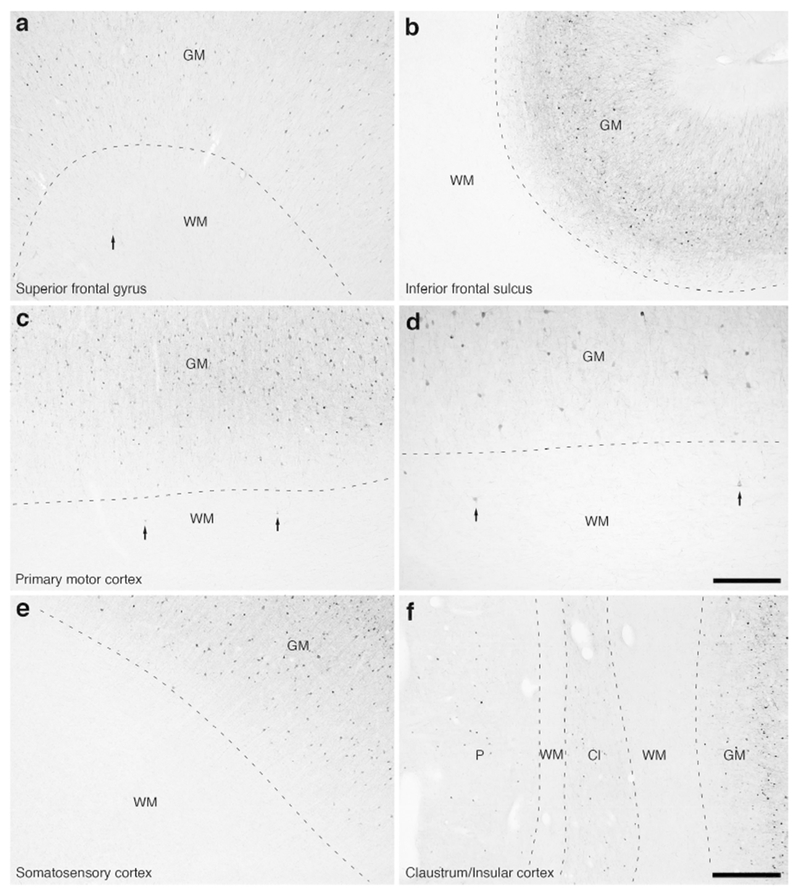
Photomicrographs of parvalbumin (PV) immunostaining in the white matter of the lar gibbon, showing the distribution of occasional WMICs immunoreactive to PV. (a) White matter (WM) deep to the cortex of the superior frontal gyrus, with an arrow indicating a single PV-immunoreactive WMIC. (b) PV-immunoreactive WMICs were not observed in the white matter deep to the fundus of the inferior frontal sulcus. (c and d) WM deep to the primary motor cortex, with arrows showing two PV-immunoreactive WMICs. (e) PV-immunoreactive WMICs were not observed in the white matter deep to the somatosensory cortex. (f) PV-immunoreactive WMICs were not observed in the deep white matter surrounding the claustrum (Cl). GM – grey matter, P – putamen nucleus. Scale bar in d = 250 μm and applies to d only. Scale bar in f = 500 μm and applies to a, b, c, e and f. In all images dorsal is to the top of the image and medial to the left.
Figure 16:
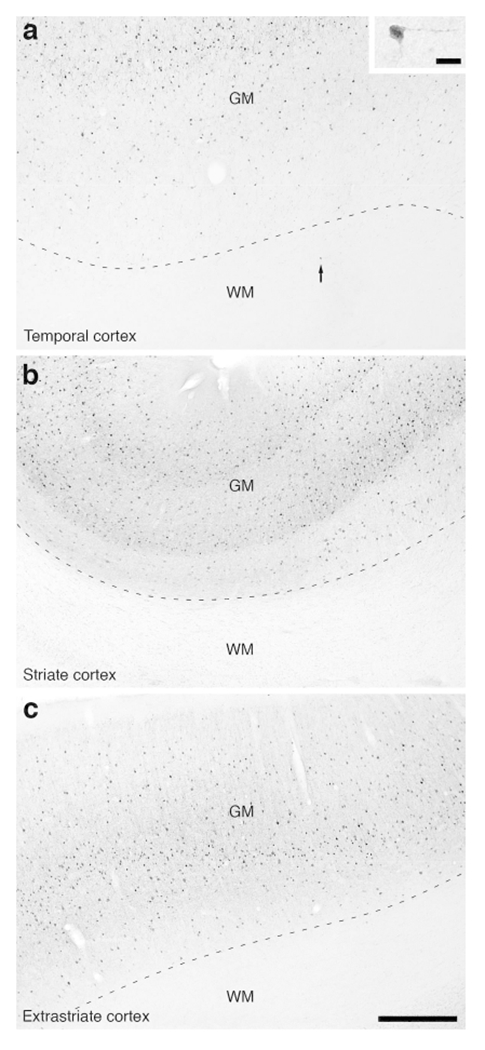
Photomicrographs of PV immunostaining in the white matter of the lar gibbon, showing the distribution of occasional WMICs immunoreactive to PV. (a) White matter (WM) deep to the temporal cortex, with an arrow indicating a single PV-immunoreactive WMIC. The inset in a shows this solitary stained neuron at a higher magnification. (b) PV-immunoreactive WMICs were not observed in the white matter deep to the striate cortex. (c) PV-immunoreactive WMICs were not observed in the deep white matter surrounding the extrastriate cortex. Scale bar in c = 500 μm and applies to a, b and c. Scale bar in inset of a = 20 μm and applies to the inset only. In all images dorsal is to the top of the image and medial to the left.
Discussion:
The current study details the distribution, neurochemical identities, numbers and somal volumes of white matter interstitial cells (WMICs) in the brain of a lar gibbon. While the current study is based on a single specimen, this individual showed no neuropathologies and was in excellent condition when euthanized. Moreover, our results regarding the distribution, neurochemistry and density gradients of WMICs in the lar gibbon are generally consistent with those previously reported in other mammalian species, including other primates (Barbaresi, Fabri, & Mensa, 2014; Barone & Kennedy, 2000; Chun & Shatz, 1989; Clancy et al., 2001, 2009; García-Marin et al., 2010; Meyer et al., 1992; Mortazavi et al., 2016, 2017; Reep, 2000; Tomioka & Rockland, 2007). Thus, we assume that the description provided herein is likely to be representative of the lar gibbon as a species, but temper the strength of our conclusions according to the limitation of only having examined a single specimen.
Numbers and densities of white matter interstitial cells in the lar gibbon
Stereological analysis of NeuN immunostaining revealed that there were approximately 67.5 million WMICs within the infracortical white matter of the lar gibbon. This is not an insignificant number of neurons, as many neural systems within the brain with far fewer neurons, for example the locus coeruleus complex (e.g. Aston-Jones & Cohen, 2005; Chan-Palay & Asan, 1989; Sharma et al., 2010), exert a tremendous influence over function across the entire brain. Moreover, the number of WMIC in the lar gibbon is three times the number of neurons found in the entire cerebral cortex of one of the smallest primates, Microcebus murinus (Herculano-Houzel, Catania, Manger, & Kaas, 2015). Finally, given the location and widespread connectivity of at least some of these neurons, they are well positioned to exert a wide-ranging effect over normal cortical function and dysfunction in illness, as well as homeostasis of the cortex (Clancy et al., 2001; Colombo, 2018; Frazer et al., 2017; Hoerder-Suabedissen & Molnár, 2015; Kilduff et al., 2011; Mortazavi et al., 2016; Suárez-Solá et al., 2009; Tomioka & Rockland, 2007; von Engelhardt et al., 2011).
No estimates of total cortical neuronal numbers for lar gibbons are available in the literature, but an estimate derived from the data of other primates can be made (Herculano-Houzel et al., 2015). Based on the allometric scaling of brain mass and cortical neuronal number of primates provided in Herculano-Houzel et al. (2015) (n = 11, brain masses ranging from 1.8 to 1 500 g; #cortical neurons = 30 000 000 × brain mass0.9329, R2 = 0.95), for a primate with a brain mass of 122 grams, as for the specimen of lar gibbon investigated here, the total number of cortical neurons is estimated to be 2 651 467 699. Thus, the estimated number of 67 642 736 WMICs that are immunoreactive to NeuN from the current study would appear to represent approximately 2.55% of the total cortical neuronal numbers in the lar gibbon.
Our analysis showed significant decreases in WMIC densities with depth in the white matter, that the densities are higher deep to gyral crowns rather than sulcal fundi, and that of all the subcortical white matters regions examined, that deep to the primary visual cortex exhibited the highest densities. While these findings are, for the most part, in agreement with previous qualitative assessments of the variation in WMIC densities (Barbaresi, Fabri, & Mensa, 2014; Barone & Kennedy, 2000; Chun & Shatz, 1989; Clancy et al., 2001, 2009; García-Marin et al., 2010; Meyer et al., 1992; Mortazavi et al., 2016, 2017; Reep, 2000; Tomioka & Rockland, 2007), the increased density beneath primary visual cortex is of particular interest. It is well known that the primary visual cortex in primates exhibits a cell density at least two times higher than other cortical regions (e.g. Rockel, Hiorns & Powell, 1974; Collins et al., 2016; Turner et al., 2016). This doubling cell density in the primary visual cortex appears to be reflected in the white matter deep to this cortical area, but not to the same extent, as the median WMIC density deep to the primary visual cortex while approximately three times more than the median densities observed in the white matter of the frontal lobe (reflecting the lower cortical cell densities in motor cortical regions, e.g. Collins et al., 2016; Turner et al., 2016) are only 1.5 times the median densities observed in the parietal and temporal lobes. Thus, while there is an association between cortical neuronal densities and WMIC densities, the relationship does not appear to be tightly constrained. This observation, if supported with more individuals from the same species and other primate species, indicates that while the densities of WMICs are related to cortical neuronal densities, there is also independence between the regions. This would add weight to the concept that the WMICs form an independent neuronal system in the mammalian brain, while still being closely associated with the cerebral cortex (Colombo, 2018; Suárez-Solá et al., 2009).
Differing types and proportions of white matter interstitial cells
The presence of nNOS, calretinin, parvalbumin or somatostatin within a neuron is a standard indication that the majority of these neurons are likely to be inhibitory or GABAergic (Gonchar & Burkhalter, 1997; Valtshcanoff, Weinberg, Kharazia, Schmidt, Nakane, & Rustioni, 1993; Xu, Roby, & Callaway, 2010). Within the cerebral cortex, it has been estimated that approximately 15-30% of the total number of neurons are inhibitory GABAergic neurons, depending on species and region (Gabbott & Bacon, 1996a,b; Ren, Aika, Heizmann, & Kosaka, 1992; Sherwood, Holloway, Erwin, & Hof, 2004; Sherwood et al., 2007, 2010; Xu et al., 2010). The immunostaining and somal volumetric analysis undertaken in the current study has revealed that there are different morphological and neurochemical neuronal types found in the infracortical white matter of the lar gibbon. Four of these are inhibitory in nature, with the largest population being calretinin immunopositive, the next most numerous being nNOS immunopositive, and a very small population being parvalbumin immunopositive. In addition, it is likely that there would be a population of neurons expressing somatostatin. Combined, the nNOS and calretinin immunopositive neurons account for approximately 23.1% of the total WMIC population (Table 3), indicating that the proportion of WMICs that are inhibitory is likely to be slightly higher than this number if the small number of parvalbumin immunopositive neurons and the potential somatostatin immunopositive neurons (that were not investigated in the current study) were included. This is consistent with reports in rodents, that GABAergic cells represent 15-25% of WMICs (Clancy et al., 2009) and in human brains, where about 25% of WMICs are found to be GABAergic (García-Marin et al., 2010). In addition, this is well within the range that has been described for the cerebral cortex in general, and specifically in primates (Gabbott, & Bacon, 1996a,b; Ren et al., 1992; Sherwood et al., 2004, 2007, 2010; Xu et al., 2010). Thus, the excitatory versus inhibitory proportions of WMICs in the lar gibbon appears to be what would be expected for a neuronal population affiliated with the cerebral cortex. A recent study (Boon, Clarke, Kassaris, Goffinet, Molnár & Hoerder-Suabedissen, 2018) suggests that the mouse subplate is very sparsely populated with GABAergic neurons during development. It will be important to conduct similar studies in primates, potentially using some of the markers that are shared between these species (Wang et al., 2010; 2011).
Other putative inhibitory subtypes might be identified, for example, by double or triple labelling for GABA and various neuropeptides (e.g. somatostatin, neuropeptide Y, or neurotensin; Barbaresi et al., 2015; Tomioka & Rockland, 2007). It is of interest to note that we did not find any WMICs immunopositive to calbindin, despite clearly labelled neurons in the cerebral cortex and other regions of the brain. The current study could not distinguish the potential range of excitatory neuronal types, thus further analysis using appropriate markers may reveal several excitatory neuronal types. An efficient and comprehensive way to determine the full range of cell types within the infracortical white matter within and across species would be the application of single cell transcriptomics (e.g. Darmanis et al., 2015; Tasic et al., 2016). At a finer level of resolution, their distribution and number could be determined using multiple fluorescence in situ hybridization (e.g. Levsky & Singer, 2003; Nederlof et al., 1990). Applying these methods across mammalian species, especially in the Euarchontoglire lineage, would enhance our understanding of ontogenetic and phylogenetic variability and possibly species-specific functioning of these neurons, such as occurs in the subplate, where there are both similarities and differences between mouse and human (Wang et al., 2010, 2011).
While data concerning the total numbers of WMIC populations are uncommon, some data regarding the proportions of certain inhibitory neuronal subpopulations is available, indicating that the proportions of WMIC neuronal types are to some extent species-specific. One study in human, based on the sampling of four cortical areas, reported the main GABAergic WMIC population was calretinin-immunopositive (14%), followed by NOS (6%), with a smaller proportion being parvalbumin-immunopositive (García-Marin et al., 2010). In contrast, Meyer et al. (1992) report that only 3% of the total WMICs (visualized by MAP2) in their human sample displayed NADPHd activity. These observations in the human brain are in accord with our finding that the majority of putative GABAergic neurons in the infracortical white matter of the lar gibbon are calretinin-immunopositive (12.7%). Interestingly, the proportion of WMICs that are nNOS-immunoreactive in the lar gibbon (10.4%) appears to be somewhat higher than observed in humans, reflecting a potential species-specific feature, although this possibility should be further examined with larger sample sizes. Unfortunately, comparable data on other non-human primates is not available, but in the white matter deep to rat visual cortex, neurons expressing NADPHd were reported to comprise, at P4, 8% of the total WMICs (visualized by MAP2), increasing to 37% at P35 (Clancy et al., 2001). This indicates that there may be a significant difference in the proportions of the inhibitory interneuronal types between rodents and primates as groups (or mammalian orders), given the stronger similarity in proportions between the gibbon and human.
Future studies of WMICs across mammalian species
To date the WMICs have been mostly explored in commonly studied species (Chun & Shatz, 1989; Clancy et al., 2009; Kanold & Luhman, 2010; Tomioka, & Rockland, 2007; but see Reep, 2000). The current report provides the first detailed quantitative analysis of these neurons in an ape, which is of particular interest due to its phylogenetic proximity to humans. A more complete survey of these neurons across a range of mammalian species will be important to obtain a more comprehensive understanding of cortical evolution, variation and potential links to behaviour. The more detailed characterization of WMICs in primate species, including humans, will contribute to better understanding of how to translate potential therapeutic findings from model species, such as laboratory rodents and macaque monkeys, to humans (Cohen, 2018; Perrin, 2014). WMICs in particular have been highlighted as potentially vulnerable cell subpopulations in the context of schizophrenia (Connor et al., 2011; Fung et al., 2014; Hoerder-Suabedissen et al., 2013; Kostovic et al., 2011), autism (Amaral et al., 2008), and neurodegenerative diseases (Mortazavi et al., 2016; Suárez-Solá et al., 2009).
WMICs could be considered a distinct neural system in their own right (Colombo, 2018; Suárez-Solá et al., 2009), or, alternatively, as closely affiliated with the cerebral cortex, and/or as a distinct deep cortical layer (distinct and deep to cortical layer VII as discussed by Reep, 2000). In vitro studies in rodents have shown that WMICs have action potentials and are interconnected with the overlying gray matter (Case et al., 2017; Clancy et al., 2001; Frazer et al., 2017; von Engelhardt et al., 2011). Among other issues, further work might address how these neurons are developmentally related to specific cortical layers, for example, through the use of specific cortical layer markers (Bakken et al., 2016; Hevner, 2007; Hoerder-Suabedissen et al., 2009, 2013). For example, a study examining specific markers of supragranular and infragranular cortical layers demonstrated that WMICs expressed both the supragranular marker CUTL2 and the infragranular marker CHN2 (Arion, Unger, Lewis, & Mirnics, 2007). Further analysis of layer-specific markers within these WMICs would clarify their relationship to other cortical layers and the neuronal types that make up the WMICs.
The current study lays an important foundation by describing WMICs in an ape. With comparable data from other species, it can be determined whether the numbers of the WMICs scale allometrically or isometrically with brain mass, cortical neuronal numbers, and/or infracortical white matter volume, and whether subtype specific distributions change across phylogeny. These and related issues will help establish a broader cross-species database important for understanding area and cellular aspects of brain evolution.
Figure 12:
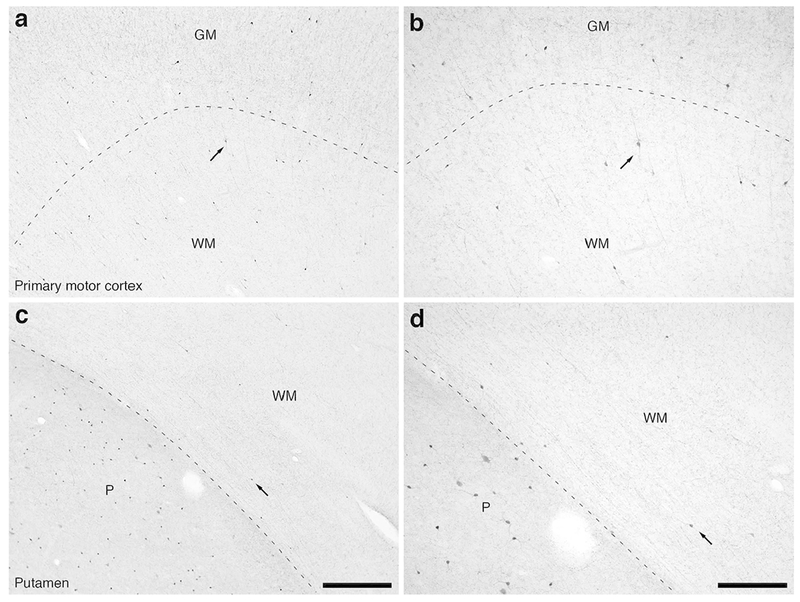
Photomicrographs of CR immunostaining in the caudal portion of the frontal lobe of the lar gibbon, showing the distribution of WMICs immunoreactive to CR. (a) Moderately magnified image of the primary motor cortex (from the region indicated by the b in Fig. 2a), showing the numerous CR-immunoreactive WMICs within the infracortical white matter (WM). (b) High magnification image of the cortical/white matter boundary (marked by a dashed line) of the primary motor cortex, showing the CR-immunoreactive WMICs deep to the cerebral cortex. Arrows in a and b indicate the same neuron for orientation of image location. (c) Moderately magnified image of the WM adjacent to the putamen nucleus (P, from the region indicated by the d in Fig. 2a), showing the CR-immunoreactive WMICs. (d) High magnification image of the WM adjacent to the putamen nucleus showing the CR-immunoreactive WMICs within the deep WM. Arrows in c and d indicate the same neuron for orientation of image location. Scale bar in c = 500 μm and apply to a and c. Scale bar in d = 250 μm and applies to b and d. In all images dorsal is to the top of the image and medial to the left.
Acknowledgements:
We thank Ms. Victoria Williams and Mr. Aminu Imam for their assistance during the immunohistochemical staining of the specimen analysed in the current study. We thank the Leakey Foundation for supporting this research.
Grant sponsors: The Leakey Foundation (PRM, CCS), National Research Foundation of South Africa (PRM), Royal Society International Exchanges award (PRM and ZM), Medical Research Council (G00900901; ZM), and partial support from NIH grant MH107456 (KSR).
Footnotes
Conflict of Interest: The authors declare no conflicts of interest.
References:
- Adrio F, Rodriguez-Moldes I, & Anadon R (2011). Distribution of glycine immunoreactivity in the brain of the Siberian sturgeon (Acipenser baeri): comparison with γ-aminobutyric acid. Journal of Comparative Neurology, 519, 1115–1142. doi: 10.1002/cne.22556 [DOI] [PubMed] [Google Scholar]
- Akbarian S, Kim JJ, Potkin SG, Hetrick WP, Bunney WE, & Jones EG (1996). Maldistribution of interstitial neurons in prefrontal white matter of the brains of schizophrenic patients. Archives of General Psychiatry, 53, 425–436. doi: 10.1001/archpsyc.1996.01830050061010 [DOI] [PubMed] [Google Scholar]
- Amaral DG, Mills Schumann C, & Wu Nordahl C (2008). Neuroanatomy of autism. Trends in Neuroscience, 31, 137–145. doi: 10.1016/j.tins.2007.12.005 [DOI] [PubMed] [Google Scholar]
- Arion D, Unger T, Lewis DA, & Mirnics K (2007). Molecular markerss distinguishing supragranular and infragranular layers in the human prefrontal cortex. European Journal of Neuroscience, 25, 1843–1854. doi: 10.1111/j.1460-9568.2007.05396.x [DOI] [PubMed] [Google Scholar]
- Aston-Jones G, & Cohen JD (2005). An integrative theory of locus coeruleus-norepinephrine function: adaptive gain and optimal performance. Annual Review of Neuroscience, 28, 403–450. doi: 10.1146/annurev.neuro.28.061604.135709 [DOI] [PubMed] [Google Scholar]
- Bakken TE, Miller JA, Ding SL, Sunkin SM, Smith KA, Ng L, Szafer A, Dalley RA, Royall JJ, Lemon T, Shapouri S, Aiona K, Arnold J, Bennett JL, Bertagnolli D, Bickley K, Boe A, Brouner K, Butler S, Byrnes E, Caldejon S, Carey A, Cate S, Chapin M, Chen J, Dee N, Desta T, Dolbeare TA, Dotson N, Ebbert A, Fulfs E, Gee G, Gilbert TL, Goldy J, Gourley L, Gregor B, Gu G, Hall J, Haradon Z, Haynor DR, Hejazinia N, Hoerder-Suabedissen A, Howard R, Jochim J, Kinnunen M, Kriedberg A, Kuan CL, Lau C, Lee CK, Lee F, Luong L, Mastan N, May R, Melchor J, Mosqueda N, Mott E, Ngo K, Nyhus J, Oldre A, Olson E, Parente J, Parker PD, Parry S, Pendergraft J, Potekhina L, Reding M, Riley ZL, Roberts T, Rogers B, Roll K, Rosen D, Sandman D, Sarreal M, Shapovalova N, Shi S, Sjoquist N, Sodt AJ, Townsend R, Velasquez L, Wagley U, Wakeman WB, White C, Bennett C, Wu J, Young R, Youngstrom BL, Wohnoutka P, Gibbs RA, Rogers J, Hohmann JG, Hawrylycz MJ, Hevner RF, Molnár Z, Phillips JW, Dang C, Jones AR, Amaral DG, Bernard A, & Lein ES (2016). A comprehensive transcriptional map of primate brain development. Nature, 535, 367–375. doi: 10.1038/nature18637 [DOI] [PMC free article] [PubMed] [Google Scholar]
- Barbaresi P, Fabri M, & Mensa E (2014). Characterization of NO-producing neurons in the rat corpus callosum. Brain and Behavior, 4, 317–336. doi: 10.1002/brb3.218 [DOI] [PMC free article] [PubMed] [Google Scholar]
- Barone P, & Kennedy H (2000). Non-uniformity of neocortex: areal heterogeneity of NADPH-diaphorase reactive neurons in adult macaque monkeys. Cerebral Cortex, 10, 160–174. doi: 10.1093/cercor/10.2.160 [DOI] [PubMed] [Google Scholar]
- Bhagwandin A, Gravett N, Bennett NC, & Manger PR (2013). Distribution of parvalbumin, calbindin and calretinin containing neurons and terminal networks in relation to sleep associated nuclei in the brain of the giant Zambian mole-rat (Fukomys mechowii). Journal of Chemical Neuroanatomy, 52, 69–79. doi: 10.1016/j.jchemneu.2013.06.002 [DOI] [PubMed] [Google Scholar]
- Boon J, Clarke E, Kassaris N, Goffinet A, Molnár Z, & Hoerder-Suabedissen A (2018). Long-range projections from sparse populations of GABAergic neurons in murine subplate. Journal of Comparative Neurology, in press. doi: no available. [DOI] [PMC free article] [PubMed] [Google Scholar]
- Bunce JG, Zikopoulos B, Feinberg M, & Barbas H (2013). Parallel prefrontal pathways reach distinct excitatory and inhibitory systems in memory-related rhinal cortices. Journal of Comparative Neurology, 521, 4260–4283. doi: 10.1002/cne.23413 [DOI] [PMC free article] [PubMed] [Google Scholar]
- Case L, Lyons DJ, & Broberger C (2017). Desynchronization of the rat cortical network and excitation of white matter neurons by neurotensin. Cerebral Cortex, 27, 2671–2685. doi: 10.1093/cercor/bhw100 [DOI] [PubMed] [Google Scholar]
- Chan-Palay V, & Asan E (1989). Quantitation of catecholamine neurons in the locus coeruleus on human brains of normal young and older adults and in depression. Journal of Comparative Neurology, 287, 357–372. doi: 10.1002/cne.902870307 [DOI] [PubMed] [Google Scholar]
- Chun JJ, & Shatz CJ (1989). The earliest-generated neurons of the cat cerebral cortex: characterization by MAP2 and neurotransmitter immunohistochemistry during fetal life. Journal of Neuroscience, 9, 1648–1667. doi: 10.1523/JNEUROSCI.09-05-01648.1989 [DOI] [PMC free article] [PubMed] [Google Scholar]
- Clancy B, Silva M, & Friedlander MJ (2001). Structure and projections of white matter neurons in the postnatal rat visual cortex. Journal of Comparative Neurology, 434, 233–252. doi: 10.1002/cne.1174 [DOI] [PubMed] [Google Scholar]
- Clancy B, Teague-Ross TJ, & Nagarajan R (2009). Cross-species analyses of the cortical GABAergic and subplate neural populations. Frontiers in Neuroanatomy, 3, 20. doi: 10.3389/neuro.05.020.2009 [DOI] [PMC free article] [PubMed] [Google Scholar]
- Cohen D (2018). Oxford TB vaccine study calls into question selective use of animal data. The British Medical Journal, 360, j5845. doi: 10.1136/bmj.j5845 [DOI] [PubMed] [Google Scholar]
- Collins CE, Turner EC, Sawyer EK, Reed JL, Young NA, Flaherty DK, & Kaas JH (2016). Cortical cell and neuron density estimates in one chimpanzee hemisphere. Proceedings of the National Academy of Sciences of the United States of America, 113, 740–745. doi: 10.1073/pnas.1524208113 [DOI] [PMC free article] [PubMed] [Google Scholar]
- Colombo JA (2018). Cellular complexity in subcortical white matter: a distributed control circuit? Brain Structure and Function, 223, 981–985. doi: 10.1007/s00429-018-1609-1 [DOI] [PubMed] [Google Scholar]
- Connor CM, Crawford BC, & Akbarian S (2011). White matter neuron alterations in schizophrenia and related disorders. International Journal of Developmental Neurosciences, 29, 325–334. doi: 10.1016/j.ijdevneu.2010.07.236 [DOI] [PMC free article] [PubMed] [Google Scholar]
- Darmanis S, Sloan SA, Zhang Y, Enge M, Caneda C, Shuer LM, Hayden Gephart MG, Barres BA, & Quake SR (2015). A survey of human brain transcriptome diversity at the single cell level. Proceedings of the National Academy of Science, USA, 112, 7285–7290. doi: 10.1073/pnas.1507125112 [DOI] [PMC free article] [PubMed] [Google Scholar]
- Dell LA, Patzke N, Spocter MA, Siegel JM, & Manger PR (2016). Organization of the sleep-related neural systems in the brain of the harbour porpoise (Phocoena phocoena). Journal of Comparative Neurology, 524, 1999–2017. doi: 10.1002/cne.23929 [DOI] [PMC free article] [PubMed] [Google Scholar]
- Duque A, Krsnik Z, Kostovic I, & Rakic P (2016). Secondary expansion of the transient subplate zone in the developing cerebrum of human and nonhuman primates. Proceedings of the National Academy of Science, USA, 113, 9892–9897. doi: 10.1073/pnas.1610078113 [DOI] [PMC free article] [PubMed] [Google Scholar]
- Fields RD (2008). White matter in learning, cognition and psychiatric disorders. Trends in Neurosciences, 31, 361–370. doi: 10.1016/j.tins.2008.04.001 [DOI] [PMC free article] [PubMed] [Google Scholar]
- Filley CM, & Fields RD (2016). White matter and cognition: making the connection. Journal of Neurophysiology, 116, 2093–2104. doi: 10.1152/jn.00221.2016 [DOI] [PMC free article] [PubMed] [Google Scholar]
- Frazer S, Prados J, Niquille M, Cadilhac C, Markopoulos F, Gomez L, Tomasello U, Telley L, Holtmaat A, Jabaudon D, & Dayer A (2017). Transcriptomic and anatomic parcellation of 5-HT3AR expressing cortical interneuron subtypes revealed by single-cell RNA sequencing. Nature Communications, 8, 14219. doi: 10.1038/ncomms14219 [DOI] [PMC free article] [PubMed] [Google Scholar]
- Fung SJ, Joshi D, Fillamn SG, & Weickert CS (2014). High white matter neuron density with elevated cortical cytokine expression in schizophrenia. Biological Psychiatry, 75, E5–E7. doi: 10.1016/j.biopsych.2013.05.031 [DOI] [PubMed] [Google Scholar]
- Gabbott PL, & Bacon SJ (1996a). Local circuit neurons in the medial prefrontal cortex (areas 24a,b,c, 25 and 32) in the monkey: I. Cell morphology and morphometrics. Journal of Comparative Neurology, 364, 567–608. doi: 10.1002/(SICI)1096-9861(19960122)364:4<567::AID-CNE1>3.0.CO [DOI] [PubMed] [Google Scholar]
- Gabbott PL, & Bacon SJ (1996b). Local circuit neurons in the medial prefrontal cortex (areas 24a,b,c, 25 and 32) in the monkey: II. Quantitative areal and laminar distributions. Journal of Comparative Neurology, 364, 609–636. doi: 10.1002(SICI)1096-9861(19960122)364:4%3C609::AID-CNE2%3E3.0.CO [DOI] [PubMed] [Google Scholar]
- Gallyas F (1979). Silver staining of myelin by means of physical development. Neurological Research, 1, 203–209. doi: 10.1080/01616412.1979.11739553 [DOI] [PubMed] [Google Scholar]
- García-Marin V, Blazquez-Llorca L, Rodriguez JR, Gonzalez-Soriano J, & DeFelipe J (2010). Differential distribution of neurons in the gyral white matter of the human cerebral cortex. Journal of Comparative Neurology, 518, 4740–4759. doi: 10.1002/cne.22485 [DOI] [PubMed] [Google Scholar]
- Gonchar Y, & Burkhalter A (1997). Three distinct families of GABAergic neurons in rat visual cortex. Cerebral Cortex, 7, 347–358. doi: 10.1093/cercor/7.4.347 [DOI] [PubMed] [Google Scholar]
- Gritti I, Manns ID, Mainville L, & Jones BE (2003). Parvalbumin, calbindin, or calretinin in cortically projecting and GABAergic, cholinergic, or glutaminergic basal forebrain neurons of the rat. Journal of Comparative Neurology, 458, 11–31. doi: 10.1002/cne.10505 [DOI] [PubMed] [Google Scholar]
- Gundersen HJ (1988). The nucleator. Journal of Microscopy - Oxford, 151, 3–21. doi: 10.1111/j.1365-2818.1988.tb04609.x [DOI] [PubMed] [Google Scholar]
- Hammer Ø, Harper DAT, Ryan PD (2001). PAST: Paleontological Statistics software package for education and data analysis. Paleontologica Electronica, 4, 9. doi: not available [Google Scholar]
- Hart A (2001). Mann-Whitney test is not just a test of medians: differences in spread can be important. British Medical Journal, 323, 391. doi: 10.1136/bmj.323.7309.391 [DOI] [PMC free article] [PubMed] [Google Scholar]
- Herculano-Houzel S, Catania K, Manger PR, & Kaas JH (2015). Mammalian brains are made of these: a dataset of the numbers and densities of neuronal and nonneuronal cells in the brain of Glires, Primates, Scandentia, Eulipotyphlans, Afrotherians and Artiodactyls, and their relationship with body mass. Brain Behavior and Evolution, 86, 145–163. doi: 10.1159/000437413 [DOI] [PubMed] [Google Scholar]
- Hevner RF (2007). Layer-specific markers as probes for neuron type identity in human neocortex and malformations of cortical development. Journal of Neuropathology and Experimental Neurology, 66, 101–109. doi: 10.1097/nen.0b013e3180301c06 [DOI] [PubMed] [Google Scholar]
- Hirano AA, Brandstatter JH, Morgans CW, & Brecha NC (2011). SNAP25 expression in mammalian retinal horizontal cells. Journal of Comparative Neurology, 519, 972–988. doi: 10.1002/cne.22562 [DOI] [PMC free article] [PubMed] [Google Scholar]
- Hoerder-Suabedissen A, & Molnár Z (2015). Development, evolution and pathology of neocortical subplate neurons. Nature Reviews Neuroscience, 16, 133–146. doi: 10.1038/nrn3915 [DOI] [PubMed] [Google Scholar]
- Hoerder-Suabedissen A, Wang WZ, Lee S, Davies KE, Goffient AM, Rakic S, Parnavelas J, Reim K, Nicolic M, Paulsen O, & Molnár Z (2009). Novel markers reveal subpopulations of subplate neurons in Murine cerebral cortex. Cerebral Cortex, 19, 1738–1750. doi: 10.1093/cercor/bhn195 [DOI] [PubMed] [Google Scholar]
- Hoerder-Suabedissen A, Oeschger FM, Krishnan ML, Belgard TG, Wang WZ, Lee S, Webber C, Petretto E, Edwards AD, & Molnár Z (2013). Expression profiling of mouse subplate reveals a dynamic gene network and disease association with autism and schizophrenia. Proceedings of the National Academy of Science USA, 110, 3555–2560. doi: 10.1073/pnas.1218510110 [DOI] [PMC free article] [PubMed] [Google Scholar]
- Hoerder-Suabedissen A, Hayashi S, Upton L, Nolan Z, Casas-Torremocha D, Grant E, Viswanathan S, Kanold PO, Clasca F, Kim Y, & Molnár Z (2018). Subset of cortical layer 6b neurons selectively innervates higher order thalamic nuclei in mice. Cerebral Cortex, 28, 1882–1897. doi: 10.1093/cercor/bhy036 [DOI] [PMC free article] [PubMed] [Google Scholar]
- Kanold PO, & Luhmann HJ (2010). The subplate and early cortical circuits. Annual Review of Neuroscience, 33, 23–48. doi: 10.1146/annurev-neuro-060909-153244 [DOI] [PubMed] [Google Scholar]
- Kilduff TS, Cauli B, & Gerashchenko D (2011). Activation of cortical interneurons during sleep: an anatomical link to homeostatic sleep regulation? Trends in Neuroscience, 34, 10–19. doi: 10.1016/j.tins.2010.09.005 [DOI] [PMC free article] [PubMed] [Google Scholar]
- Kostovic I, & Rakic P (1980). Cytology and time of origin of interstitial neurons in the white matter in infant and adult human and monkey telencephalon. Journal of Neurocytology, 9, 219–242. doi: 10.1007/BF01205159 [DOI] [PubMed] [Google Scholar]
- Kostovic I, & Rakic P (1990). Developmental history of the transient subplate zone in the visual and somatosensory cortex of the macaque monkey and human brain. Journal of Comparative Neurology, 297, 441–470. doi: 10.1002/cne.902970309 [DOI] [PubMed] [Google Scholar]
- Kostovic I, Judas M, & Sedmak G (2011). Developmental history of the subplate zone, subplate neurons and interstitial white matter neurons: relevance for schizophrenia. International Journal of Developmental Neuroscience, 29, 193–205. doi: 10.1016/j.ijdevneu.2010.09.005 [DOI] [PubMed] [Google Scholar]
- Kowall NW, & Beal MF (1988). Cortical somatostatin, neuropeptide-Y, and NADPH diaphorase neurons – normal anatomy and alterations in Alzheimer’s disease. Annals of Neurology, 23, 105–114. doi: 10.1002/ana.410230202 [DOI] [PubMed] [Google Scholar]
- Levsky JM, & Singer RH (2003). Fluorescence in situ hybridization: past, present and future. Journal of Cell Science, 116, 2833–2838. doi: 10.1242/jcs.0063 [DOI] [PubMed] [Google Scholar]
- Manger PR, Pillay P, Maseko BC, Bhagwandin A, Gravett N, Moon DJ, Jillani N, & Hemingway J (2009). Acquisiton of brains from the African elephant (Loxodonta africana): perfusion-fixation and dissection. Journal of Neuroscience Methods, 179, 16–21. doi: 10.1016/j/jneumeth.2009.01.001 [DOI] [PubMed] [Google Scholar]
- Meyer G, Wahle P, Castaneyra-Perdomo A, & Ferres-Torres R (1992). Morphology of neurons in the white matter of the adult human neocortex. Experimental Brain Research, 88, 204–212. doi: 10.1007/BF02259143 [DOI] [PubMed] [Google Scholar]
- Molnár Z (2018). Cortical layer with no known function. European Journal of Neuroscience, published online. doi: 10.1111/ejn.13978 [DOI] [PMC free article] [PubMed] [Google Scholar]
- Mortazavi F, Wang XY, Rosene DL, & Rockland KS (2016). White matter neurons in young adult and aged rhesus monkey. Frontiers in Neuroanatomy, 10, 15. doi: 10.3389/fnana.2016.00015 [DOI] [PMC free article] [PubMed] [Google Scholar]
- Mortazavi F, Romano SE, Rosene DL, & Rockland KS (2017). A survey of white matter neurons at the gyral crowns and sulcal depths in the Rhesus monkey. Frontiers in Neuroanatomy, 11, 69. doi: 10.3389/fnana.2017.00069 [DOI] [PMC free article] [PubMed] [Google Scholar]
- Nederlof PM, van der Flier S, Wiegant J, Raap AK, Tanke HJ, Ploem JS, van der Ploeg M (1990). Multiple fluorescence in situ hybridization. Cytometry, 11, 126–131. doi: 10.1002/cyto.990110115 [DOI] [PubMed] [Google Scholar]
- Ngwenya A, Patzke N, Manger PR, & Herculano-Houzel S (2016). Continued growth of the central nervous system without mandatory addition of neurons in the Nile crocodile (Crocodylus niloticus). Brain, Behavior and Evolution, 87, 19–38. doi: 10.1159/000443201 [DOI] [PubMed] [Google Scholar]
- Perrin S (2014) Make mouse studies work. Nature, 507, 423–425. doi: 10.1038/507423a [DOI] [PubMed] [Google Scholar]
- Ramón y Cajal S (1911). Histologie du système nerveux de l’homme et des vertébrés. Paris: Maloine. [Google Scholar]
- Reep RL (2000). Cortical layer VII and persistent subplate cells in mammalian brains. Brain Behavior and Evolution, 56, 212–234. doi: 10.1159/000047206 [DOI] [PubMed] [Google Scholar]
- Ren JQ, Aika Y, Heizmann CW, & Kosaka T (1992). Quantitative analysis of neurons and glial cells in the rat somatosensory cortex with special reference to GABAergic neurons and parvalbumin containing neurons. Experimental Brain Research, 92, 1–14. doi: 10.1007/BF00230378 [DOI] [PubMed] [Google Scholar]
- Rockel AJ, Hiorns RW, & Powell TP (1974). Numbers of neurons through full depth of neocortex. Journal of Anatomy, 118, 371–372. doi: not available [PubMed] [Google Scholar]
- Russo D, Clavenzani P, Sorteni C, Minelli LB, Botti M, Gazza F, Panu R, Ragionieri L, & Chiocchetti R (2013). Neurochemical features of boar lumbosacral dorsal root ganglion neurons and characterization of sensory neurons innervating the urinary bladder trigone. Journal of Comparative Neurology, 521, 342–366. doi: 10.1002/cne.23177 [DOI] [PubMed] [Google Scholar]
- Sharma Y, Xu T, Graf WM, Fobbs A, Sherwood CC, Hof PR, Allman JM, & Manaye KF (2010). Comparative anatomy of the locus coeruleus in humans and nonhuman primates. Journal of Comparative Neurology, 518, 963–971. doi: 10.1002/cne.22249 [DOI] [PMC free article] [PubMed] [Google Scholar]
- Shering AF, & Lowenstein PR (1994). Neocortex provides direct synaptic input to interstitial neurons of the intermediate zone of kittens and white matter of cats: a light and electron microscopic study. Journal of Comparative Neurology, 347, 433–443. doi: 10.1002/cne.903470309 [DOI] [PubMed] [Google Scholar]
- Sherwood CC, Holloway RL, Erwin JM, & Hof PR (2004). Cortical orofacial motor representation in Old World monkeys, great apes, and humans. II. Stereological analysis of chemoarchitecture. Brain, Behavior and Evolution, 63, 82–106. doi: 10.1159/000082289 [DOI] [PubMed] [Google Scholar]
- Sherwood CC, Raghanti MA, Stimpson CD, Bonar CJ, de Sousa AA, Preuss TM, & Hof PR (2007). Scaling of inhibitory interneurons in areas v1 and v2 of anthropoid primates as revealed by calcium-binding protein immunohistochemistry. Brain, Behavior and Evolution, 69, 176–195. doi: 10.1159/000096986 [DOI] [PubMed] [Google Scholar]
- Sherwood CC, Raghanti MA, Stimpson CD, Spocter MA, Uddin M, Boddy AM, Wildman DE, Bonar CJ, Lewandowski AH, Phillips KA, Erwin JM, & Hof PR (2010). Inhibitory interneurons of the human prefrontal cortex display conserved evolution of the phenotype and related genes. Proceedings of the Royal Society B: Biological Sciences, 277, 1011–1020. doi: 10.1098/rspb.2009.1831 [DOI] [PMC free article] [PubMed] [Google Scholar]
- Smiley JF, Levey AI, & Mesulam MM (1998). Infracortical interstitial cells concurrently expressing m2-muscarinic receptors, acetylcholinesterase and nicotinamide adenine dinucleotide phosphate diaphorase in the human and monkey cerebral cortex. Neuroscience, 84, 755–769. doi: 10.1016/S0306-4522(97)00524-1 [DOI] [PubMed] [Google Scholar]
- Stephan H, Frahm H, & Baron G (1981). New and revised data on volumes of brain structures in Insectivores and Primates. Folia Primatologica, 35, 1–29. doi: 10.1159/000155963 [DOI] [PubMed] [Google Scholar]
- Suárez-Solá ML, González-Delgado FJ, Pueyo-Morlans M, Medina-Bolívar OC, Hernández-Acosta NC, González-Gómez M, & Meyer G (2009). Neurons in the white matter of the adult human neocortex. Frontiers in Neuroanatomy 3, 7. doi: 10.3389/neuro.05.007.2009 [DOI] [PMC free article] [PubMed] [Google Scholar]
- Tasic B, Menon V, Nguyen TN, Kim TK, Jarsky T, Yao Z, Levi B, Gray LT, Sorensen SA, Dolbeare T, Bertagnolli D, Goldy J, Shapovalova N, Parry S, Lee C, Smith K, Bernard A, Madisen L, Sunkin SM, Hawrylycz M, Koch C, & Zeng H (2016). Adult mouse cortical cell taxonomy revealed by single cell transcriptomics. Nature Neuroscience, 19, 335–346. doi: 10.1038/nn.4216 [DOI] [PMC free article] [PubMed] [Google Scholar]
- Tomioka R, Okamoto K, Furuta T, Fujiyama F, Iwasato T, Yanagawa Y, Obata K, Kaneko T, & Tamamaki N (2005). Demonstration of long-range GABAergic connections distributed throughout the mouse neocortex. European Journal of Neuroscience, 21, 1587–1600. doi: 10.1111/j.1460-9568.2005.03989.x [DOI] [PubMed] [Google Scholar]
- Tomioka R, & Rockland KS (2007). Long-distance corticocortical GABAergic neurons in the adult monkey white and gray matter. Journal of Comparative Neurology, 505, 526–538. doi: 10.1002/cne.21504 [DOI] [PubMed] [Google Scholar]
- Turner EC, Young NA, Reed JL, Collins CE, Flaherty DK, Gabi M, & Kaas JH (2016). Distributions of cells and neurons across the cortical sheet in old world macaques. Brain, Behavior and Evolution, 88, 1–13. doi: 10.1159/000446762 [DOI] [PubMed] [Google Scholar]
- Valtshcanoff JG, Weinberg RJ, Kharazia VN, Schmidt HW, Nakane M, & Rustioni A (1993). Neurons in rat cerebral cortex that synthesize nitric oxide: NADPH-diaphorase histochemistry, NOS immunocytochemistry and colocalization with GABA. Neuroscience Letters, 157, 157–161. doi: 10.1016/0304-3940(93)90726-2 [DOI] [PubMed] [Google Scholar]
- von Engelhardt J, Khrulev S, Eliava M, Wahlster S, & Monyer H (2011). 5-HT3A receptor-bearing white matter interstitial GABAergic interneurons are functionally integrated into cortical and subcortical networks. Journal of Neuroscience, 31, 16844–16854. doi: 10.1523/JNEUROSCI.0310-11.2011 [DOI] [PMC free article] [PubMed] [Google Scholar]
- Wang WZ, Hoerder-Suabedissen A, Oeschger FM, Bayatti N, Ip BK, Lindsay S, Supramaniam V, Srinivasan L, Rutherford M, Mollgárd K, Clowry GJ, & Molnár Z (2010). Subplate in the developing cortex of mouse and human. Journal of Anatomy, 217, 368–380. doi: 10.1111/j.1469-7580.2010.01274.x [DOI] [PMC free article] [PubMed] [Google Scholar]
- Wang WZ, Oeschger FM, Montiel JF, Garcia-Moreno F, Hoerder-Suabedissen A, Krubitzer L, Ek CJ, Saunders NR, Reim K, Villalón A, & Molnár Z (2011). Comparative aspects of subplate zone studied with gene expression in sauropsids and mammals. Cerebral Cortex, 21, 2187–2203. doi: 10.1093/cercor/bhq278 [DOI] [PubMed] [Google Scholar]
- West MJ, Slomianka L, & Gundersen HJ (1991). Unbiased stereological estimation of the total number of neurons in the subdivisions of the rat hippocampus using the optical fractionator. Anatomical Record, 231, 482–497. doi: 10.1002/ar.1092310411 [DOI] [PubMed] [Google Scholar]
- Xu X, Roby KD, & Callaway EM (2010). Immunochemical characterization of inhibitory mouse cortical neurons: three chemical distinct classes of inhibitory cells. Journal of Comparative Neurology, 518, 389–404. doi: 10.1002/cne.22229 [DOI] [PMC free article] [PubMed] [Google Scholar]


