

Abstract
Background
This is an update of the Cochrane review published in 2002.
Colorectal cancer (CRC) is a major cause of morbidity and mortality in industrialised countries. Experimental evidence has supported the hypothesis that dietary fibre may protect against the development of CRC, although epidemiologic data have been inconclusive.
Objectives
To assess the effect of dietary fibre on the recurrence of colorectal adenomatous polyps in people with a known history of adenomatous polyps and on the incidence of CRC compared to placebo. Further, to identify the reported incidence of adverse effects, such as abdominal pain or diarrhoea, that resulted from the fibre intervention.
Search methods
We identified randomised controlled trials (RCTs) from Cochrane Colorectal Cancer's Specialised Register, CENTRAL, MEDLINE and Embase (search date, 4 April 2016). We also searched ClinicalTrials.gov and WHO International Trials Registry Platform on October 2016.
Selection criteria
We included RCTs or quasi‐RCTs. The population were those having a history of adenomatous polyps, but no previous history of CRC, and repeated visualisation of the colon/rectum after at least two‐years' follow‐up. Dietary fibre was the intervention. The primary outcomes were the number of participants with: 1. at least one adenoma, 2. more than one adenoma, 3. at least one adenoma greater than or equal to 1 cm, or 4. a new diagnosis of CRC. The secondary outcome was the number of adverse events.
Data collection and analysis
Two reviewers independently extracted data, assessed trial quality and resolved discrepancies by consensus. We used risk ratios (RR) and risk difference (RD) with 95% confidence intervals (CI) to measure the effect. If statistical significance was reached, we reported the number needed to treat for an additional beneficial outcome (NNTB) or harmful outcome (NNTH). We combined the study data using the fixed‐effect model if it was clinically, methodologically, and statistically reasonable.
Main results
We included seven studies, of which five studies with 4798 participants provided data for analyses in this review. The mean ages of the participants ranged from 56 to 66 years. All participants had a history of adenomas, which had been removed to achieve a polyp‐free colon at baseline. The interventions were wheat bran fibre, ispaghula husk, or a comprehensive dietary intervention with high fibre whole food sources alone or in combination. The comparators were low‐fibre (2 to 3 g per day), placebo, or a regular diet. The combined data showed no statistically significant difference between the intervention and control groups for the number of participants with at least one adenoma (5 RCTs, n = 3641, RR 1.04, 95% CI 0.95 to 1.13, low‐quality evidence), more than one adenoma (2 RCTs, n = 2542, RR 1.06, 95% CI 0.94 to 1.20, low‐quality evidence), or at least one adenoma 1 cm or greater (4 RCTs, n = 3224, RR 0.99, 95% CI 0.82 to 1.20, low‐quality evidence) at three to four years. The results on the number of participants diagnosed with colorectal cancer favoured the control group over the dietary fibre group (2 RCTS, n = 2794, RR 2.70, 95% CI 1.07 to 6.85, low‐quality evidence). After 8 years of comprehensive dietary intervention, no statistically significant difference was found in the number of participants with at least one recurrent adenoma (1 RCT, n = 1905, RR 0.97, 95% CI 0.78 to 1.20), or with more than one adenoma (1 RCT, n = 1905, RR 0.89, 95% CI 0.64 to 1.24). More participants given ispaghula husk group had at least one recurrent adenoma than the control group (1 RCT, n = 376, RR 1.45, 95% CI 1.01 to 2.08). Other analyses by types of fibre intervention were not statistically significant. The overall dropout rate was over 16% in these trials with no reasons given for these losses. Sensitivity analysis incorporating these missing data shows that none of the results can be considered as robust; when the large numbers of participants lost to follow‐up were assumed to have had an event or not, the results changed sufficiently to alter the conclusions that we would draw. Therefore, the reliability of the findings may have been compromised by these missing data (attrition bias) and should be interpreted with caution.
Authors' conclusions
There is a lack of evidence from existing RCTs to suggest that increased dietary fibre intake will reduce the recurrence of adenomatous polyps in those with a history of adenomatous polyps within a two to eight year period. However, these results may be unreliable and should be interpreted cautiously, not only because of the high rate of loss to follow‐up, but also because adenomatous polyp is a surrogate outcome for the unobserved true endpoint CRC. Longer‐term trials with higher dietary fibre levels are needed to enable confident conclusion.
Plain language summary
Does dietary fibre prevent the recurrence of colorectal adenomas and carcinomas?
We asked
Does nutritional supplement of dietary fibre prevent recurrence of precancerous polyps and cancer in the bowel in participants with a history of polyps having been removed to achieve a polyp‐free colon at baseline for the intervention.
Background
Colorectal (bowel) cancer is common worldwide but is especially prevalent in industrialised countries. Genes, diet and lifestyle all seem to be important in the development of bowel cancer. Several communities with low bowel cancer rates have diets that are rich in fibre. Increasing the levels of fibre in the diet in industrialised countries might therefore help to reduce the rate of bowel cancer.
Search Date
The evidence is current to 4 April 2016.
Study characteristics
Seven studies met the inclusion criteria. However, only five studies with 4798 participants provided data for this review. The mean ages of the participants ranged from 56 to 66 years. The participants all had a history of adenomas and would have had at least one procedure to remove them to achieve a polyp‐free colon at baseline.The interventions in the included studies were wheat bran fibre, ispaghula husk, or a comprehensive dietary intervention with high fibre whole food sources used alone or in combination. These were compared to low‐fibre (2 to 3 g per day), placebo, or a regular diet.
Key results
This review found that increasing fibre in a Western diet for two to eight years did not lower the risk of bowel cancer. Paradoxically, after four years participants receiving dietary fibre had higher rates of bowel cancer compared with the control group, with the absolute increase in risk being one percent.
Quality of evidence
The quality of evidence was low. The high risk of bias of included studies, small sample size, large number of missing data and the use of indirect measures gave us little confidence on the findings of this review.
Summary of findings
Summary of findings for the main comparison. Dietary fibre (all study interventions) versus control for the prevention of colorectal adenomas and carcinomas.
| Dietary fibre (all study interventions) versus control for the prevention of colorectal adenomas and carcinomas | ||||||
| Patient or population: people with a history of colorectal adenomas Settings: out‐patient setting Intervention: dietary fibre (all study interventions) versus control | ||||||
| Outcomes | Illustrative comparative risks* (95% CI) | Relative effect (95% CI) | No of participants (studies) | Quality of the evidence (GRADE) | Comments | |
| Assumed risk | Corresponding risk | |||||
| Control | Dietary fibre (all study interventions) versus control | |||||
| Number of participantswith at least one recurrent adenoma Follow‐up: 2 to 4 years | Study population | RR 1.04 (0.95 to 1.13) | 3641 (5 studies) | ⊕⊕⊝⊝ lowa,b | ||
| 349 per 1000 | 363 per 1000 (332 to 395) | |||||
| Moderate | ||||||
| 295 per 1000 | 307 per 1000 (280 to 333) | |||||
| Number of participantswith more than one adenoma Follow‐up: 3 to 4 years | Study population | RR 1.06 (0.94 to 1.20) | 2542 (2 studies) | ⊕⊕⊝⊝ lowa,b | ||
| 250 per 1000 | 265 per 1000 (235 to 300) | |||||
| Moderate | ||||||
| 340 per 1000 | 360 per 1000 (320 to 408) | |||||
|
Number of participantswith at least one adenoma 1 cm or greater Follow up: 3 to 4 years |
Study population | RR 0.99 (0.82 to 1.20) | 3224 (4 studies) | ⊕⊕⊝⊝ lowa,b | ||
| 102 per 1000 | 101 per 1000 (84 to 122) | |||||
| Moderate | ||||||
| 60 per 1000 | 59 per 1000 (49 to 72) | |||||
| Number of participantsdiagnosed with colorectal cancer Follow‐up: 3 to 4 years | Study population | RR 2.70 (1.07 to 6.85) | 2794 (2 studies) | ⊕⊕⊝⊝ lowa,c | The incidence of colorectal cancer is very low, so when risk was calculated by risk difference (RD), the difference between groups was very small. RD = 0.01, 95% CI 0.00 to 0.01 | |
| 4 per 1000 | 12 per 1000 (4 to 14) | |||||
| Moderate | ||||||
| 5 per 1000 | 14 per 1000 (5 to 16) | |||||
| *The basis for the assumed risk (e.g. the median control group risk across studies) is provided in footnotes. The corresponding risk (and its 95% confidence interval) is based on the assumed risk in the comparison group and the relative effect of the intervention (and its 95% CI). CI: Confidence interval; RD: Risk difference; RR: Risk ratio | ||||||
| GRADE Working Group grades of evidence High quality: Further research is very unlikely to change our confidence in the estimate of effect. Moderate quality: Further research is likely to have an important impact on our confidence in the estimate of effect and may change the estimate. Low quality: Further research is very likely to have an important impact on our confidence in the estimate of effect and is likely to change the estimate. Very low quality: We are very uncertain about the estimate. | ||||||
a Risk of bias: downgraded by one level due to high risk of detection/performance bias and attrition bias. b Indirectness: downgraded by one level as adenoma was a surrogate outcome for CRC. c Imprecision: downgraded by one level as the data was under powered and the sample size was below the optimal information size.
Background
Description of the condition
Colorectal cancer (CRC) is a leading cause of morbidity and mortality in industrialised nations, and is the third most common cancer worldwide with an estimated 1.24 million new cases of CRC diagnosed in 2008 (CRUK 2012). Globally, the incidence of CRC varies 10‐fold with the highest rates found in Australia and New Zealand, North America and Europe; the lowest rates are found in South‐Central Asia and Africa (Jemal 2011). Incidence rates from 27 European Union countries found that the highest incidences occur in Slovakia for men (91 cases per 100,000) and Denmark for women (50 cases per 100,000), while the lowest rates are in Greece for both sexes (24 cases per 100,000 for men and 17 per 100,000 for women) (GLOBOCAN 2008). These geographical differences are thought to be due to dietary and environmental factors, with the disease occurring mainly in high‐income countries with a Western culture (Boyle 2000, Center 2009), although these figures may be affected by ascertainment bias, due to underreporting in low‐ and middle‐income countries. Age is an important risk factor with the risk of CRC increasing in people after the age of 40, and increasing markedly at 50 years, with more than 90% of CRC occurring in those aged 50 or older and the prevalence rising across all five‐year age categories, reaching a peak at 70 to 74 years of age (Corley 2013; Giovannucci 2006;Ries 2008).
Colorectal cancers mostly arise from dysplastic adenomatous polyps, and develop from the cumulative effect of sequential genetic alterations (multistep carcinogenesis), which can develop sporadically, or develop due to an inherited genetic cancer predisposition (Arnold 2005; Shussman 2014). It is estimated that 70% of CRCs develop sporadically, whilst 30% of CRCs are due to an inherited form of the disease (Jasperson 2010). Sporadic forms of CRC are thought to be related to lifestyle factors, and the geographical variation in CRC incidence and findings from migrant studies (McCredie 1999; Winkels 2014) suggest that diet (Gonzalez 2006;Terry 2001; Winkels 2014), and other lifestyle factors (Fu 2012; Potter 1993) play an important role in the aetiology of the disease. In 1971, based on the observation that CRC was rare in rural areas of many African countries, Burkitt hypothesized that the consumption of dietary fibre in those regions was protective (Burkitt 1971). Further, he postulated that the high intake of refined carbohydrates in Western countries increased the risk of developing CRC.
Description of the intervention
At present, there is no consensus on how dietary fibre should be defined. The original standard classification (Trowell 1976) describes dietary fibre as being composed of remnants of plant cells that are resistant to hydrolysis by human alimentary enzymes. This includes all indigestible polysaccharides such as celluloses, hemicelluloses, oligosaccharides, pectins, gums and waxes as well as lignin, a chemical compound most commonly derived from wood that is also present in plants. Dietary fibre is further classified as soluble (i.e. pectin, agar) or insoluble (cellulose, heteroxylans and lignified cell walls (wheat bran)), with the soluble form being less protective against cancer (Bunzel 2005; Ferguson 1996; Murphy 2012). Some have suggested that resistant starch, the portion of starch that remains undigested in the small intestine, actually functions as a dietary fibre (Prosky 2000), though it is not part of the standard definition. More recently, the European Food and Safety Authority (EFSA) defined dietary fibre as non‐digestible carbohydrates plus lignin, including non‐starch polysaccharides: cellulose; hemicelluloses; pectins; hydrocolloids (i.e. gums, mucilages, glucans); resistant oligosaccharides, fructo‐oligosaccharides, galacto‐oligosaccharides, other resistant oligosaccharides; resistant starch, consisting of physically enclosed starch, some types of raw starch granules, retrograded amylose, chemically or physically modified starches, or both; and lignin associated with the dietary fibre polysaccharides (EFSA 2010). Another limitation in examining the relationship between dietary fibre and the risk of CRC is that individuals with high fibre content in their diet are likely to have healthier diets and lifestyles in general, and this can result in residual confounding, especially as the effect of this factor is difficult to separate in epidemiological studies (Huxley 2013).
Most, but not all, experimental studies in humans and animals support the protective effects of dietary fibre in the development of CRC (Alberts 1996a; Aune 2011a; Egeberg 2010; Fung 2010; Kritchevsky 1999; Reddy 1999). Protection is thought to be mediated through two main mechanisms referred to as direct and indirect (Ferguson 1996; Lupton 1999; Sowa 2000). The direct mechanism postulates that dietary fibre reduces exposure of the gastrointestinal mucosa to carcinogens or tumour promoters through absorption, increased nutrient dilution and shortening faecal transit time. The indirect mechanism addresses the protective role that bacteria in the colon may play through a number of enzymatic processes. For instance butyrate, a chemical formed in the colon by bacterial fermentation of dietary fibre, is thought to reduce the activity of tumour promoters. In addition to these proposed mechanisms, the source of dietary fibres has also been identified as an important contributing factor. Data from studies in humans and other animals has consistently shown wheat bran to be superior to pectin, oat or corn bran (Dhingra 2012).
Two previously published meta‐analyses reported a similar protective effect of fibre and other dietary consumption on the incidence of CRC. In 1990, the first meta‐analysis examined the effects of dietary fibre and vegetables on the incidence of CRC. A search of all epidemiologic studies published between 1970 and 1988 was carried out. The authors critically assessed 23 case‐control studies, 15 correlation studies, two cohort studies and three time‐trend studies. The combined odds ratio for data that were combined from 12 case‐control studies was 0.57 (95% CI 0.50 to 0.64) (Trock 1990). Studies that demonstrated "equivocal support for protective effect" were excluded. In 1992, a second meta‐analysis reviewed studies that were published between 1975 and 1988 and examined the effects of fibre, vitamin C, and beta‐carotene on CRC risk (Heine‐Broring 2015; Howe 1992; Jung 2013). Thirteen case control studies were identified, and data from a total of 5287 people with CRC and 10,470 controls were combined. Using logistic regression analysis, the risk ratio (RR) of CRC for the highest versus lowest quintile of fibre intake was 0.53 (95% CI 0.47 to 0.61). However, when the authors included only studies in which the participants used validated diet questionnaires and in which qualitative data on dietary habits and cooking methods were reported, consumption of dietary fibre was not shown to be protective (Friedenreich 1994; Wrieden 2007). The findings from both meta‐analyses are tempered by the presence of a number of methodological weaknesses as well as the problem of selection and recall bias commonly associated with case control studies.
In a population‐based cohort study in which 61,463 Swedish women were followed for 9.6 years, a weak association was found between increased fruit consumption and a decreased risk of CRC, though there was no association between cereal fibre intake and CRC (Aoyama 2014; Aune 2011b; Terry 2001). These results persisted after known confounders such as the use of multivitamins, exercise and decreased smoking and alcohol intake were adjusted for. The authors also noted a positive association between several healthy lifestyle changes and increased consumption of fibre, fruits and vegetables. Other large observational studies, however, have reported that dietary fibre and consumption of fruits and vegetables were not associated with a reduced risk of CRC (Fuchs 1999; Michels 2000). Two American cohort studies, the Nurses Health Study, that followed 88,757 women, and the Health Professionals' Follow‐up Study, that followed 47,325 men for 16 and 10 years respectively, found that CRC risk was unaffected by the intake of dietary fibre, fruits and vegetables. Asano and colleagues (Asano 2002) carried out a Cochrane review (which is the original version of the current review) investigating the effect of dietary fibre on the incidence or recurrence of colorectal adenomas, the incidence of CRC, and incidence of adverse effects that resulted from the fibre intervention. This review included five studies with 4349 participants, and reported a range of interventions including wheat bran fibre, ispaghula husk, or a comprehensive dietary intervention with high fibre whole food sources alone or in combination. The findings of the review by Asano 2002 is consistent with those of Fuchs 1999 and Michels 2000.
How the intervention might work
Mechanisms underlying how dietary fibre might reduce the risk of CRC are unclear. Proposed theories include that fibre may play a role in binding potential carcinogens in the colon and its ability to absorb larger quantities of water thereby increasing faecal bulk and shortening transit time. In addition, bacterial fermentation may lower the pH of the colon through the production of short‐chain fatty acids (Harris 1993).
Why it is important to do this review
To date, the results from observational studies assessing the effects of dietary fibre on the development of CRC have been inconclusive, despite some evidence with large sample size supporting a reduction in risk (Kunzmann 2015; Song 2015). In addition, the methodological limitations inherent in these observational studies make it difficult to interpret the findings. A systematic review of randomised controlled trials is therefore required in order to better evaluate data surrounding this important issue.
Objectives
To assess the effect of dietary fibre on the recurrence of colorectal adenomatous polyps in people with a known history of adenomatous polyps and on the incidence of CRC compared to placebo. Further, to identify the reported incidence of adverse effects, such as abdominal pain or diarrhoea, that resulted from the fibre intervention.
Methods
Criteria for considering studies for this review
Types of studies
We included randomised controlled trials (RCTs; parallel or cluster) and quasi‐RCTs comparing dietary fibre supplementation to a control.
Types of participants
We included participants with a history of adenomatous polyps, but not CRC in this review. All participants had to have undergone at least one documented procedure that directly visualised the colon and rectum at baseline and was repeated at least two years from the baseline investigation. The polyps could be either new incidences or recurrent adenomatous polyps, however, once detected by the colonoscopy test, appropriate procedures had to have been performed (i.e. polypectomy) to ensure that the colon or rectum were free of polyps at baseline.
Types of interventions
Studies included in this review had an intervention of dietary fibre. Dietary fibre is composed of the remnants of plant cells resistant to hydrolysis by human alimentary enzymes and included all indigestible polysaccharides (celluloses, hemicelluloses, oligosaccharides, pectins, gums, waxes) and lignin. We have also included resistant starches in the definition of dietary fibre for the purposes of this review.
Types of outcome measures
Primary outcomes
Number of participants with at least one adenomatous polyp
Number of participants with more than one adenomatous polyp
Number of participants with at least one adenomatous polyp that is 1 cm or greater
Number of participants with a new diagnosis of CRC
The diagnosis of adenomatous polyps or CRC was confirmed pathologically.
Secondary outcomes
Number of participants that reported at least one adverse event
Search methods for identification of studies
Electronic searches
We identified RCTs from Cochrane Colorectal Cancer's Specialised Register (4 April 2016), the Cochrane Central Register of Controlled Trials (CENTRAL, 2016, Issue 4 in the Cochrane Library) (Appendix 1), MEDLINE (Ovid), 1950 to 4 April 2016 (Appendix 2) and Embase (Ovid), 1974 to 4 April 2016 (Appendix 3). No language or publication status restrictions were applied.
Searching other resources
We handsearched reference lists from published studies, journal articles and bibliographies of relevant systematic reviews. We also searched ClinicalTrials.gov and WHO International Trials Registry Platform to identify any ongoing trials. See Figure 1.
1.
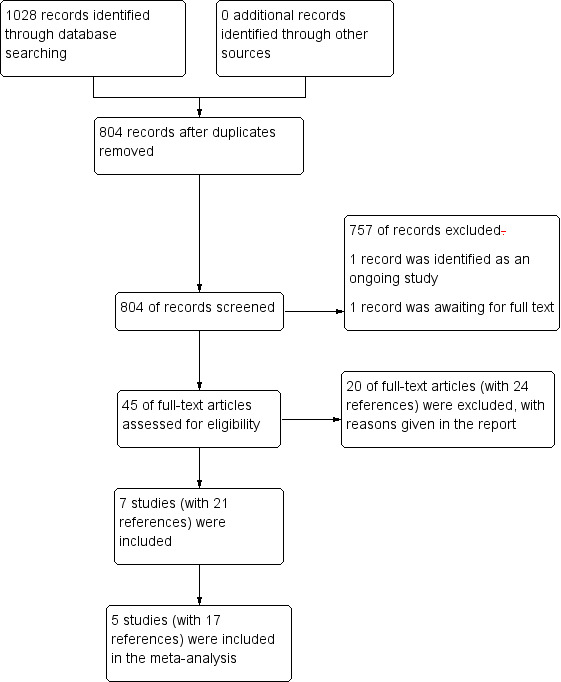
Study flow diagram
Data collection and analysis
Selection of studies
Two reviewers (YY and JL) independently performed two stages of screenings. First, titles and abstracts of all references identified through the searches were screened and clearly irrelevant reports were excluded. Second, full texts of potentially eligible studies and abstracts that were difficult to determine inclusion for were retrieved for further assessment and assessed according to the pre‐defined inclusion criteria. We excluded reports that did not meet the inclusion criteria and listed reasons for their exclusion. We resolved any discrepancies by discussion. We included all eligible studies irrespective of whether measured outcomes were reported on.
Data extraction and management
In this update, two reviewers (CW and YQC) independently extracted data on methods, participants, interventions and outcomes using a standardised data extraction form, which we piloted prior to the data extraction. Data was then entered into Review Manager 5 (RevMan 5) software for analysis (RevMan 2014). We resolved any disagreements by discussion and where uncertainty remained we consulted a third person (TS/RA).
Assessment of risk of bias in included studies
Two authors (EC and YY) assessed the quality of the trials using the Cochrane 'Risk of bias' tool described in the Cochrane Handbook for Systematic Reviews of Interventions (Higgins 2011).
We independently evaluated the quality of the included trials and assessed the following risk of bias domains:
random sequence generation;
allocation concealment;
blinding of participants and personnel;
blinding of outcome assessment:
incomplete outcome data:
selective reporting bias; and
other potential sources of bias (such as recruitment rate, limited frequency of colonoscopy follow ups).
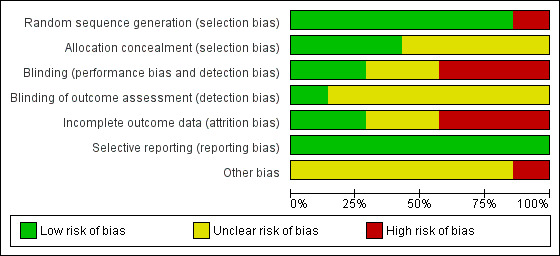
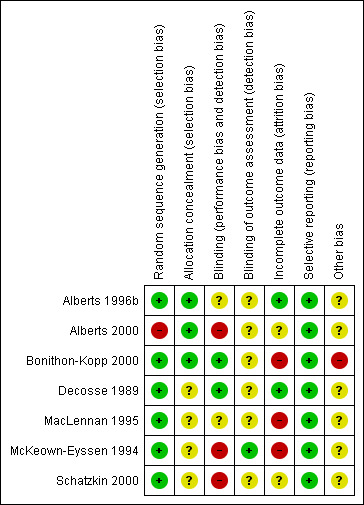
We judged each domain as high risk, low risk or unclear risk according to criteria used in the Cochrane 'Risk of bias' tool (see Appendix 4) (Higgins 2011). We sought clarification from the trialists if the published data provided inadequate information for the review. We tried to retrieve trial protocols of included studies to assess selective reporting bias. We presented the results of the risk of bias assessment in two figures (Figure 2; Figure 3).
2.
3.
Measures of treatment effect
As the outcomes were binary, we reported the risk ratio (RR) and risk difference (RD) with 95% confidence intervals (CI). If the RD was statistically significant, we calculated the number needed to treat for an additional beneficial outcome (NNTB) or the number needed to treat for an additional harmful outcome (NNTH). We assessed the studies clinically and methodologically to see if it was reasonable to consider combining data. If so, we used a fixed‐effect model for the analysis.
Unit of analysis issues
The unit of analysis was the individual participant. There were no unit of analysis issues. However, if there had been cluster‐randomised trials (such as randomisations by clinician or practice), in which the clustering effect had not been incorporated by study authors, we would have accounted for this by dividing binary data by a design effect using the mean number of participants per cluster (m) and the intra‐class correlation coefficient (ICC) (Design effect = 1 + (m‐1)*ICC) (Donner 2002).
Dealing with missing data
Where data were missing, we attempted to contact study authors for further information. The current update reported data from original trials regardless of whether the trialists had employed intention‐to‐treat (ITT) analysis. However, for those data derived from completers only, we conducted best/worst case scenario sensitivity analyses to assess the impact of missing data on the estimates of effect.
Assessment of heterogeneity
We evaluated the statistical heterogeneity in the data using the I2 statistic (Higgins 2003). If the I2 statistic for heterogeneity was significant (i.e. 50% or greater), we scrutinised the studies to identify potential factors that could explain the heterogeneity (e.g. variations in mean age of participants between studies). We evaluated clinical heterogeneity in included studies by assessment of study population characteristics.
Assessment of reporting biases
If there had been 10 or more studies, we would have used funnel plots to investigate reporting bias as described in the Cochrane Handbook for Systematic Reviews of Interventions (Sterne 2011). However, as we identified only five relevant studies, and fewer than 10 studies has limited power to detect small‐study effects (Egger 1997), we did not produce any funnel plots.
Data synthesis
We performed the meta‐analysis using the RevMan 5 software provided by Cochrane (RevMan 2014). Despite the differences between the trials, we used a fixed‐effect model meta‐analysis that uses the assumption that there was one true effect size underlying all the studies in the analysis, and that all differences in observed effects were due to sampling error (Borenstein 2010), as random‐effects models produce poor estimates when there are small numbers of studies (Higgins 2011).
Summary of findings
We evaluated the quality of evidence using the Grading of Recommendation Assessment, Development and Evaluation (GRADE) approach for all primary outcomes for the comparison of dietary fibre (all study interventions) versus control (Schünemann 2011) (see Table 1). The quality of evidence could be downgraded by one (serious concern) or two levels (very serious concern) for the following reasons: risk of bias, inconsistency (unexplained heterogeneity, inconsistency of results), indirectness (indirect population, intervention, control, outcomes), imprecision (wide confidence interval, single trials), or publication bias. The quality could also be upgraded by one level due to a large summary effect.
Results
Description of studies
Details of the included and excluded studies are listed in the tables of Characteristics of included studies and of Characteristics of excluded studies.
Results of the search
The 2012 search of the databases yielded 781 references (Figure 1), and the subsequent update search performed in April 2016 yielded additional 247 references. The number was reduced to 804 records after duplicates were removed. Of these, we excluded 757 at title and abstract level. We identified one record to be an ongoing study and another record was a conference abstract, which we were unable to trace as a full publications. Forty‐five full‐text articles were short‐listed for further scrutiny, out of which we excluded 20 studies (with 24 references). Finally, we included seven studies (encompassing 21 references), of which five studies (encompassing 17 references) contributed data to meta‐analysis.
Included studies
Study design and length
All included studies were described as being randomised. The study length ranged from one year (Alberts 1996b) to four years (Schatzkin 2000), with the latter being subject to a further follow‐up at eight years.
Study participants
Seven studies with 4960 participants met the inclusion criteria, however, only five studies with 4798 participants provided data for this review. The two largest studies were both conducted in USA (Alberts 2000; Schatzkin 2000), and the other five included studies were conducted in USA (Alberts 1996b; Decosse 1989), 10 European countries (Bonithon‐Kopp 2000), Australia (MacLennan 1995), and Canada (McKeown‐Eyssen 1994). The mean ages of the participants ranged from 56 to 66 years. The participants all had a known history of adenomas and would have had at least one procedure to remove them to achieve a polyp‐free colon at baseline.
Types of Interventions
Three of the studies included wheat bran fibre (WBF) supplementation as the sole intervention or a supplement to a low fat diet/calcium or ascorbic acid (4 g a day) and alpha‐tocopherol (400 mg a day) intake. The doses ranged from 13.5 g a day WBF (Alberts 1996b; Alberts 2000), 22.5 g a day WBF (Decosse 1989), 25 g a day WBF (MacLennan 1995), and 20 g WBF per 100 g snack to supplement the diet to reach a goal of 50 g of dietary fibre a day (McKeown‐Eyssen 1994). One study included 3.5 g a day of ispaghula husk supplementation as a fibre intervention (Bonithon‐Kopp 2000). Another study used a comprehensive dietary intervention that obtained a high fibre diet through whole foods (Schatzkin 2000). These are relatively high fibre intake compared to the average Western diet, as the average fibre intake is 12.8 g a day for women and 14.8 g a day for men in the UK (British Nutrition Foundation 2015).
The control groups were characterised by low‐fibre (2 to 3 g a day) (Alberts 1996b; Alberts 2000; Decosse 1989; McKeown‐Eyssen 1994 ), placebo (Bonithon‐Kopp 2000; MacLennan 1995), or a regular diet (Schatzkin 2000).
Types of outcome measures
All of the included studies reported the number of participants with at least one recurrent adenoma. Two studies reported the number of participants with more than one adenomatous polyp (Alberts 2000; Schatzkin 2000) and four studies reported the number of participants that had at least one adenomatous polyp of 1 cm or greater (Alberts 2000; Bonithon‐Kopp 2000; MacLennan 1995; Schatzkin 2000). Two studies reported the number of participants that developed colorectal cancer (CRC) although this was not a pre‐defined endpoint (Alberts 2000; Schatzkin 2000). Adverse events (other than CRC) were reported in two studies (Alberts 2000; Bonithon‐Kopp 2000). Only one of these two studies reported the number of participants that reported at least one adverse event (Bonithon‐Kopp 2000). Two studies reported outcomes that were not predefined in our protocol including compliance, [3H]thymidine labeling, dietary analysis and polyp number ratios (Alberts 1996b; Decosse 1989). Therefore we did not extract data from these two studies.
Excluded studies
We excluded 20 studies, out of which 15 were not RCTs. One study had a minority of participants who had had a procedure to remove polyps and data were unavailable for these participants, and furthermore, the control group received aspirin rather than placebo (Burn 2011a). One study (Lanza 2001) focused only on the changes in dietary intake for the included study Schatzkin 2000. In one study (Limburg 2011), the intervention was a prebiotic supplement, and not dietary fibre. One article (Vitanzo 2000) was only a summary of existing evidence. In Kunzmann 2015, the author compared flexible sigmoidoscopy with usual medical care, which did not meet our inclusion criteria for interventions.
Studies awaiting classification
We identified one conference abstract (Macrae 2014), but we were unable to locate the full‐text report or unpublished data for interim analysis.
Ongoing studies
We identified one ongoing study (Ishikawa 2000), but we were unable to retrieve unpublished data for interim analysis.
Risk of bias in included studies
The risk of bias assessment across studies is shown in Figure 2 and Figure 3.
Allocation
All studies were randomised. Six studies described the random sequence generation (Alberts 1996b; Bonithon‐Kopp 2000; Decosse 1989; MacLennan 1995; McKeown‐Eyssen 1994; Schatzkin 2000) and were judged at low risk of selection bias; In Alberts 2000 there was a large discrepancy in the number (175) of people randomised to the intervention and control group. Therefore we suspected the randomisation procedure may have been unsuccessful, and consequently rated this domain as high risk of bias.
Allocation concealment was described in two studies (Alberts 1996b; Bonithon‐Kopp 2000) and judged as low risk of bias, whilst no details were available in the remaining studies.
Blinding
Participants were aware of their treatment regimes in three studies (Alberts 2000; McKeown‐Eyssen 1994; Schatzkin 2000). Another study (MacLennan 1995) described the trial as being partially double‐blinded, with no further details. One study (Bonithon‐Kopp 2000) blinded participants and investigators, but it was unclear if the assessors were blinded. There were no details on the blinding of outcome assessment for six studies (Alberts 1996b; Alberts 2000; Bonithon‐Kopp 2000; Decosse 1989; MacLennan 1995; Schatzkin 2000). We judged detection bias to be low in one study (McKeown‐Eyssen 1994).
Incomplete outcome data
We rated three studies (Bonithon‐Kopp 2000; MacLennan 1995; McKeown‐Eyssen 1994) as high risk of attrition bias due to high dropout rates (ranging from 17% to 27.8% of the total sample size), in total 267 out of 1290 participants. We considered it possible that the proportion of missing outcomes compared with observed events could have had a clinically relevant impact on the intervention effect estimate. Two studies (Alberts 2000; Decosse 1989) reported moderate dropout rates (8.4% and 8.8% respectively), in total 300 out of 3508 participants. However, the reasons for loss to follow‐up were not reported, thus we judged these studies as unclear risk of attrition bias. We rated two studies (Alberts 1996b; Decosse 1989) as low risk of attrition bias due to low (5% to 6%) dropout rates (9 out of 162 participants in total); one of these two studies used intention‐to‐treat analysis (Decosse 1989).
Selective reporting
We rated all the included studies as low risk of selective reporting bias, as all pre‐defined primary outcomes appeared to have been reported.
Other potential sources of bias
For one study (Bonithon‐Kopp 2000), the recruitment was lower than intended as the original intended sample size to detect a 15% difference in new adenoma formation rate was 210 participants in each arm, but the number of people who completed the study in the treatment arm was 198, and 178 in the placebo arm. Another potential source of bias in this study was the limited frequency of colonoscopy follow‐ups, as over half of the participants failed to provide data at follow‐up as they did not receive colonoscopy. These (i.e. recruitment rate or limited frequency of colonoscopy follow‐up) were not an issue in the other six studies (Alberts 1996b; Alberts 2000; Decosse 1989; MacLennan 1995; McKeown‐Eyssen 1994; Schatzkin 2000).
Effects of interventions
See: Table 1
1. Dietary fibre versus control
1.1 Number of participants with at least one recurrent adenoma (within two to four years)
All five included studies reported an outcome of the number of participants with at least one recurrent adenoma. There were no statistically significant differences between the treatment and the control (Analysis 1.1: n = 3641, 5 RCTs, RR 1.04, 95% CI 0.95 to 1.13). We rated the quality of evidence as low due to high risk of detection/attrition bias and adenoma being as a surrogate outcome for CRC (Table 1). The best/worst case scenario sensitivity analysis that includes participants who were lost to follow‐up by making assumptions as to the outcomes they had, showed that the pooled estimates were not robust as the conclusions drawn from the three analyses would differ, and therefore these missing data had an important impact on our findings (Analysis 7.1).
1.1. Analysis.
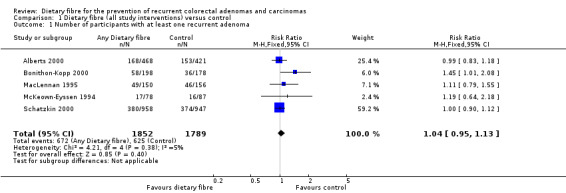
Comparison 1 Dietary fibre (all study interventions) versus control, Outcome 1 Number of participants with at least one recurrent adenoma.
7.1. Analysis.
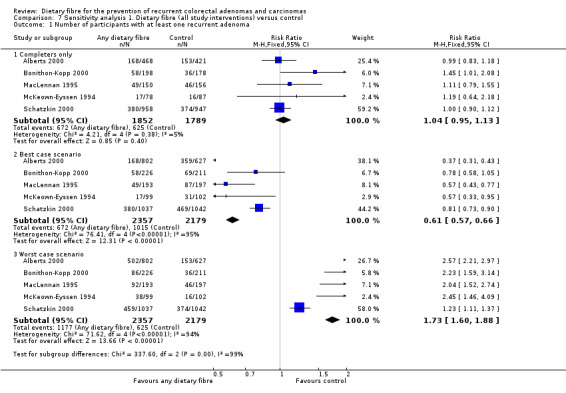
Comparison 7 Sensitivity analysis 1. Dietary fibre (all study interventions) versus control, Outcome 1 Number of participants with at least one recurrent adenoma.
1.2 Number of participants with more than one adenoma (within three to four years)
No statistically significant difference was found between the treatment and the control groups for the number of participants with more than one adenoma (Analysis 1.2: n = 2542, 2 RCTs, RR 1.06, 95% CI 0.94 to 1.20). We rated the quality of evidence as low due to high risk of detection/attrition bias and adenoma being as a surrogate outcome for CRC (Table 1). The sensitivity analysis incorporating missing data in a best scenario favoured dietary fibre in lowering the risk of more than one adenoma (Analysis 7.2), however, the sensitivity analysis in a worst case scenario had a contrary result (Analysis 7.2) indicating that the missing data had an important impact on our findings.
1.2. Analysis.
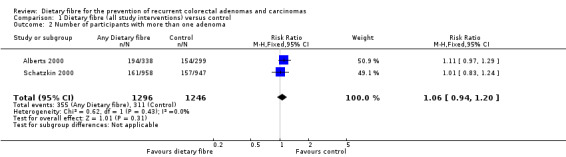
Comparison 1 Dietary fibre (all study interventions) versus control, Outcome 2 Number of participants with more than one adenoma.
7.2. Analysis.
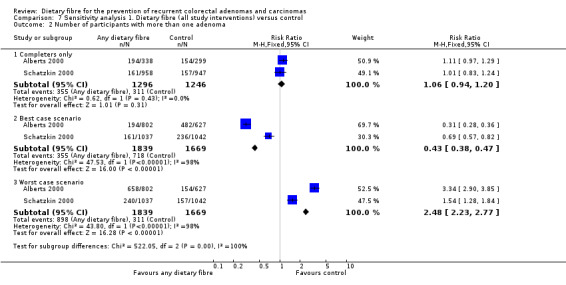
Comparison 7 Sensitivity analysis 1. Dietary fibre (all study interventions) versus control, Outcome 2 Number of participants with more than one adenoma.
1.3 Number of participants with at least one adenoma 1 cm or greater (within three to four years)
There was no statistically significant difference between the treatment and the control in the number of participants with at least one adenoma 1 cm or greater (Analysis 1.3: n = 3224, 4 RCTs, RR 0.99, 95% CI 0.82 to 1.20). We rated the quality of evidence as low due to high risk of detection/attrition bias and adenoma being as a surrogate outcome for CRC (Table 1). The best/worst case scenario sensitivity analysis showed contrary results indicating that missing data had an important impact on our findings (Analysis 7.3).
1.3. Analysis.

Comparison 1 Dietary fibre (all study interventions) versus control, Outcome 3 Number of participants with at least one adenoma 1 cm or greater.
7.3. Analysis.
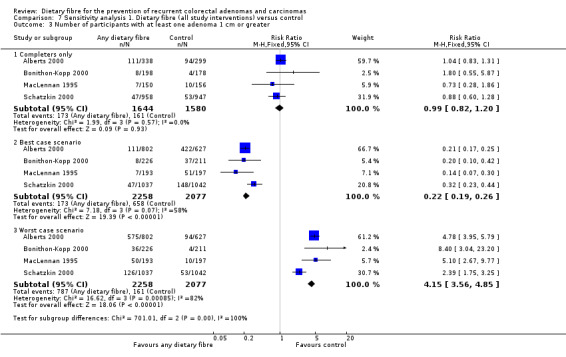
Comparison 7 Sensitivity analysis 1. Dietary fibre (all study interventions) versus control, Outcome 3 Number of participants with at least one adenoma 1 cm or greater.
1.4 Number of participants diagnosed with colorectal cancer (within three to four years)
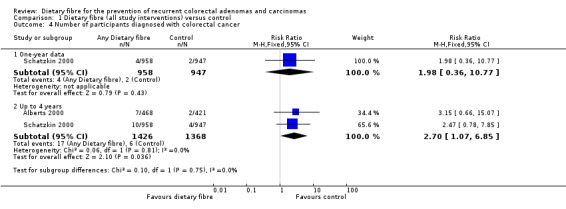
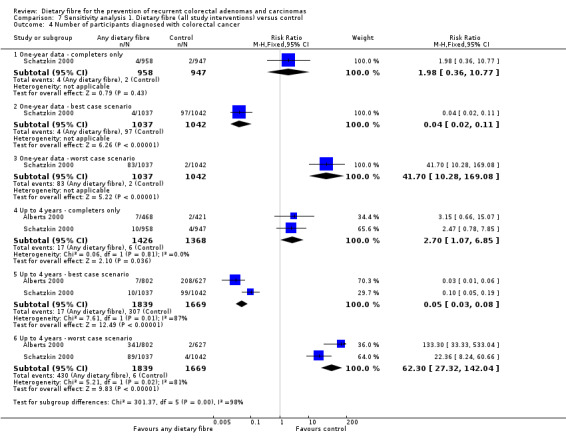
A statistically significantly higher number of participants were diagnosed with CRC in the dietary fibre group compared with the control group (Analysis 1.4: n = 2794, 2 RCTs, RR 2.70, 95% CI 1.07 to 6.85, NNTH 134, 95% CI 39 to 3247). The risk of being diagnosed with CRC was increased by 170% in the dietary fibre group relative to the control group. Calculated as the absolute risk increase, CRC was 1% higher in the dietary fibre group (RD 0.01, 95% CI 0.00 to 0.01). One‐year data by Schatzkin 2000 revealed no significant difference in CRC rates (n = 1905, RR 1.98, 95% CI 0.36 to 10.77). We rated the quality of evidence as low due to high risk of detection/attrition bias, and under‐powered data (Table 1). The best/worst case scenario sensitivity analysis showed that the pooled estimate of effect was not robust, and the missing data had an important impact on our findings (Analysis 7.4).
1.4. Analysis.
Comparison 1 Dietary fibre (all study interventions) versus control, Outcome 4 Number of participants diagnosed with colorectal cancer.
7.4. Analysis.
Comparison 7 Sensitivity analysis 1. Dietary fibre (all study interventions) versus control, Outcome 4 Number of participants diagnosed with colorectal cancer.
1.5 Number of participants that reported at least one adverse event
In this subgroup, no study reported data for this outcome.
2. Wheat bran fibre (WBF) versus control
2.1 Number of participants with at least one recurrent adenoma (within three to four years)
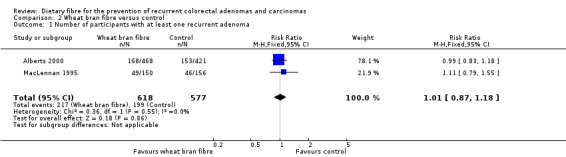
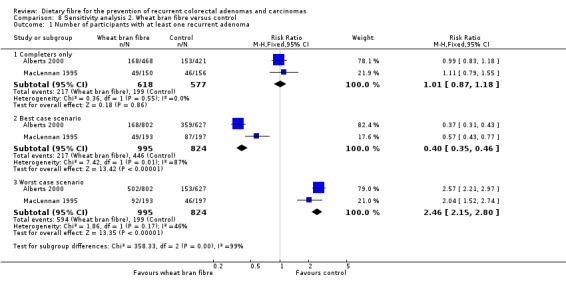
The data available from two studies on wheat bran fibre showed no statistically significant difference between this treatment and the control group (Analysis 2.1: n = 1195, 2 RCTs, RR 1.01, 95% CI 0.87 to 1.18). The best/worst case scenario sensitivity analysis showed that the pooled estimate of effect was not robust. The missing data had important impact on our findings (Analysis 8.1).
2.1. Analysis.
Comparison 2 Wheat bran fibre versus control, Outcome 1 Number of participants with at least one recurrent adenoma.
8.1. Analysis.
Comparison 8 Sensitivity analysis 2. Wheat bran fibre versus control, Outcome 1 Number of participants with at least one recurrent adenoma.
2.2 Number of participants with more than one adenoma (within three to four years)
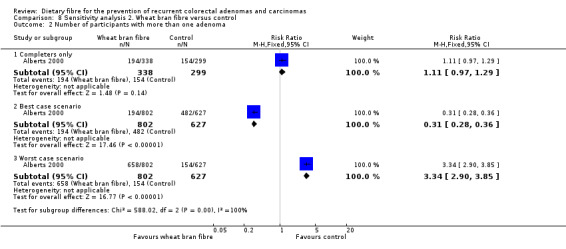
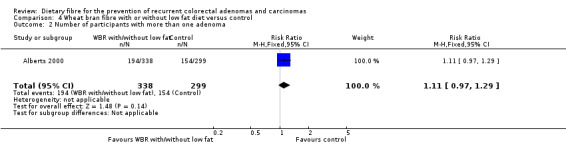
We found no statistically significant difference between the treatment groups for the number of participants with more than one adenoma (Analysis 2.2: n = 637, 1 RCT, RR 1.11, 95% CI 0.97 to 1.29). The best/worst case scenario sensitivity analysis showed contrary results indicating that missing data had an important impact on our findings (Analysis 8.2).
2.2. Analysis.
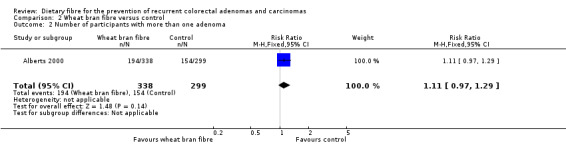
Comparison 2 Wheat bran fibre versus control, Outcome 2 Number of participants with more than one adenoma.
8.2. Analysis.
Comparison 8 Sensitivity analysis 2. Wheat bran fibre versus control, Outcome 2 Number of participants with more than one adenoma.
2.3 Number of participants with at least one adenoma 1 cm or greater (within three to four years)
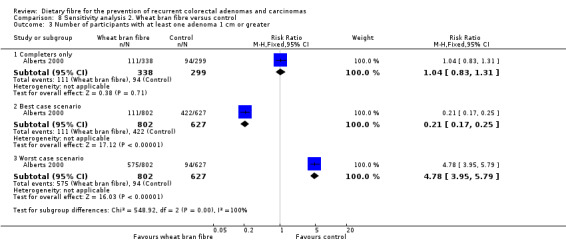
No statistically significant difference was found between the wheat bran fibre and control groups in the number of participants with at least one adenoma 1 cm or greater (Analysis 2.3: n = 637, 1 RCT, RR 1.04, 95% CI 0.83 to 1.31). The best/worst case scenario sensitivity analysis showed contrary results indicating that missing data had an important impact on our findings (Analysis 8.3).
2.3. Analysis.
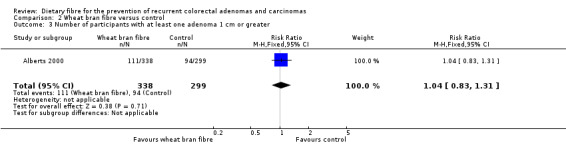
Comparison 2 Wheat bran fibre versus control, Outcome 3 Number of participants with at least one adenoma 1 cm or greater.
8.3. Analysis.
Comparison 8 Sensitivity analysis 2. Wheat bran fibre versus control, Outcome 3 Number of participants with at least one adenoma 1 cm or greater.
2.4 Number of participants diagnosed with colorectal cancer
In this subgroup, no study reported data for this outcome.
2.5 Number of participants that reported at least one adverse event
In this subgroup, no study reported data for this outcome.
3. Wheat bran fibre (WBF) and low fat diet versus control
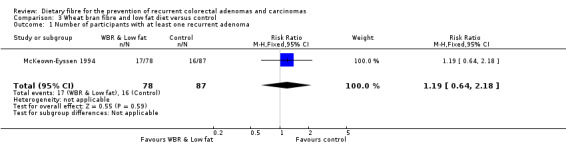
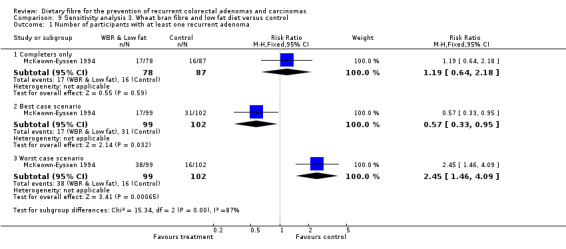
3.1 Number of participants with at least one recurrent adenoma (within two years)
There was no significant difference between the treatment groups in the number of participants with at least one recurrent adenoma (Analysis 3.1: n = 165, 1 RCT, RR 1.19, 95% CI 0.64 to 2.18). The best/worst case scenario sensitivity analysis showed contrary results indicating that missing data had an important impact on our findings (Analysis 9.1).
3.1. Analysis.
Comparison 3 Wheat bran fibre and low fat diet versus control, Outcome 1 Number of participants with at least one recurrent adenoma.
9.1. Analysis.
Comparison 9 Sensitivity analysis 3. Wheat bran fibre and low fat diet versus control, Outcome 1 Number of participants with at least one recurrent adenoma.
3.2 Number of participants with more than one adenoma
In this subgroup, no study reported data for this outcome.
3.3 Number of participants with at least one adenoma 1 cm or greater
In this subgroup, no study reported data for this outcome.
3.4 Number of participants diagnosed with colorectal cancer
In this subgroup, no study reported data for this outcome.
3.5 Number of participants that reported at least one adverse event
In this subgroup, no study reported data for this outcome.
4. Wheat bran fibre with or without low fat diet versus control
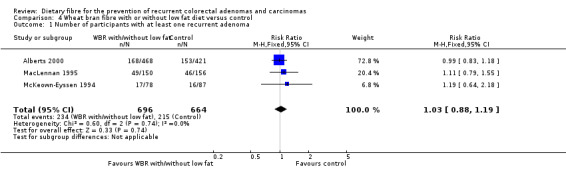
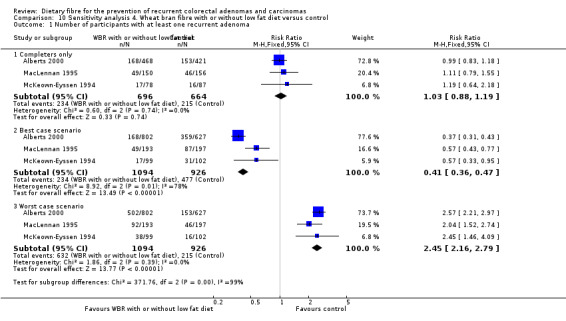
4.1 Number of participants with at least one recurrent adenoma (within two to four years)
No statistically significant difference was found between the wheat bran diet (with or without low fat) and the control groups in the number of participants with at least one recurrent adenoma (Analysis 4.1: n = 1360, 3 RCTs, RR 1.03, 95% CI 0.88 to 1.19). The best/worst case scenario sensitivity analysis showed contrary results indicating that missing data had an important impact on our findings (Analysis 10.1).
4.1. Analysis.
Comparison 4 Wheat bran fibre with or without low fat diet versus control, Outcome 1 Number of participants with at least one recurrent adenoma.
10.1. Analysis.
Comparison 10 Sensitivity analysis 4. Wheat bran fibre with or without low fat diet versus control, Outcome 1 Number of participants with at least one recurrent adenoma.
4.2 Number of participants with more than one adenoma (within three years)
Data from one study showed no statistically significant difference in the number of participants with more than one adenoma between the treatment and control groups (Analysis 4.2: n = 637, 1 RCT, RR 1.11, 95% CI 0.97 to 1.29). The best/worst case scenario sensitivity analysis showed contrary results indicating that missing data had an important impact on our findings (Analysis 10.2).
4.2. Analysis.
Comparison 4 Wheat bran fibre with or without low fat diet versus control, Outcome 2 Number of participants with more than one adenoma.
10.2. Analysis.
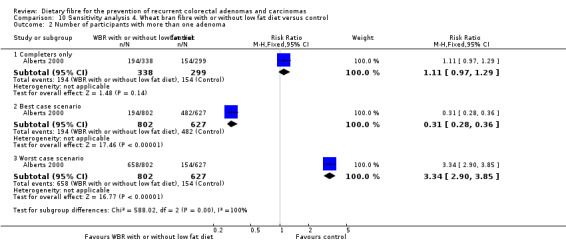
Comparison 10 Sensitivity analysis 4. Wheat bran fibre with or without low fat diet versus control, Outcome 2 Number of participants with more than one adenoma.
4.3 Number of participants with at least one adenoma 1 cm or greater (within three to four years)
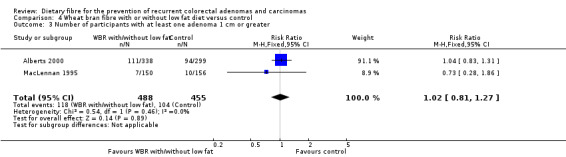
We found no statistically significant difference in the treatment and control groups regarding the number of participants with at least one adenoma 1 cm or greater (Analysis 4.3: n = 943, 2 RCTs, RR 1.02, 95% CI 0.81 to 1.27). The best/worst case scenario sensitivity analysis showed contrary results indicating that missing data had an important impact on our findings (Analysis 10.3).
4.3. Analysis.
Comparison 4 Wheat bran fibre with or without low fat diet versus control, Outcome 3 Number of participants with at least one adenoma 1 cm or greater.
10.3. Analysis.
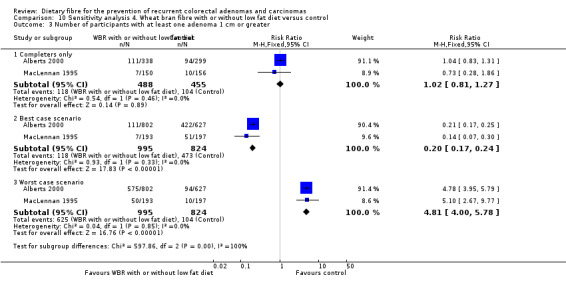
Comparison 10 Sensitivity analysis 4. Wheat bran fibre with or without low fat diet versus control, Outcome 3 Number of participants with at least one adenoma 1 cm or greater.
4.4 Number of participants diagnosed with colorectal cancer
In this subgroup, no study reported data for this outcome.
4.5 Number of participants that reported at least one adverse event
In this subgroup, no study reported data for this outcome.
5. Comprehensive dietary intervention versus control
5.1 Number of participants with at least one recurrent adenoma (after four years)
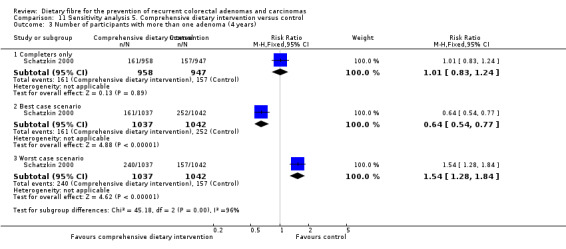
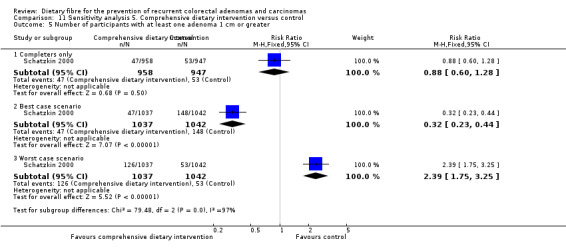
One study reported no statistically significant difference between a comprehensive dietary intervention and the control group on the number of participants with at least one recurrent adenoma after four years (Analysis 5.1: n = 1905, 1 RCT, RR 1.00, 95% CI 0.90 to 1.12). The best/worst case scenario sensitivity analysis showed contrary results indicating that missing data had an important impact on our findings (Analysis 11.1).
5.1. Analysis.
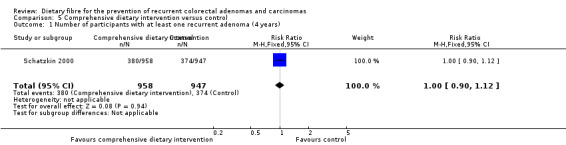
Comparison 5 Comprehensive dietary intervention versus control, Outcome 1 Number of participants with at least one recurrent adenoma (4 years).
11.1. Analysis.
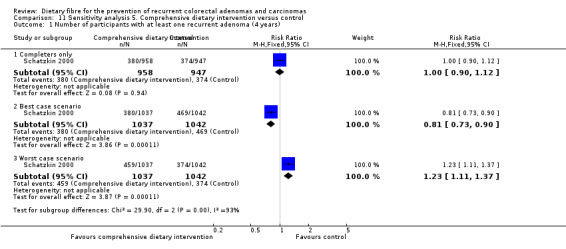
Comparison 11 Sensitivity analysis 5. Comprehensive dietary intervention versus control, Outcome 1 Number of participants with at least one recurrent adenoma (4 years).
5.2 Number of participants with at least one recurrent adenoma (after eight years)
After eight years, no statistically significant difference was found in the number of participants with at least one recurrent adenoma (Analysis 5.2: n = 1905, 1 RCT, RR 0.97, 95% CI 0.78 to 1.20). The best/worst case scenario sensitivity analysis showed contrary results indicating that missing data had an important impact on our findings (Analysis 11.2).
5.2. Analysis.
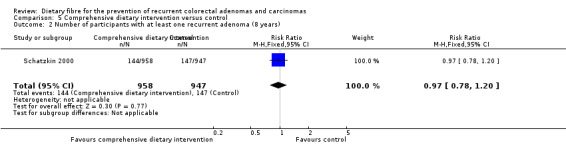
Comparison 5 Comprehensive dietary intervention versus control, Outcome 2 Number of participants with at least one recurrent adenoma (8 years).
11.2. Analysis.
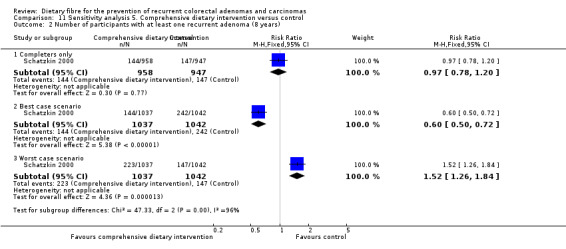
Comparison 11 Sensitivity analysis 5. Comprehensive dietary intervention versus control, Outcome 2 Number of participants with at least one recurrent adenoma (8 years).
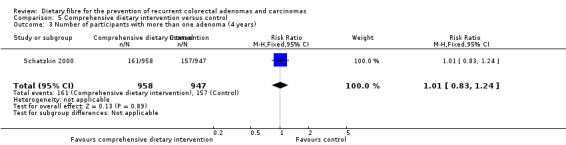
5.3 Number of participants with more than one adenoma (after four years)
After four years, no statistically significant difference was found in the number of participants with more than one adenoma (Analysis 5.3: n = 1905, 1 RCT, RR 1.01, 95% CI 0.83 to 1.24).The best/worst case scenario sensitivity analysis showed contrary results indicating that missing data had an important impact on our findings (Analysis 11.3).
5.3. Analysis.
Comparison 5 Comprehensive dietary intervention versus control, Outcome 3 Number of participants with more than one adenoma (4 years).
11.3. Analysis.
Comparison 11 Sensitivity analysis 5. Comprehensive dietary intervention versus control, Outcome 3 Number of participants with more than one adenoma (4 years).
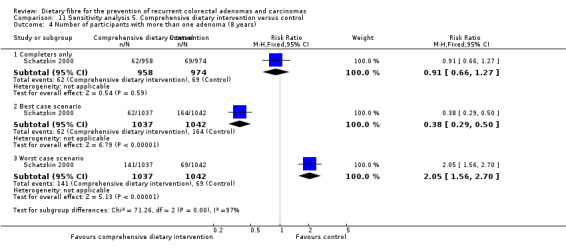
5.4 Number of participants with more than one adenoma (after eight years)
After eight years, there was still no statistically significant difference between the treatment and control groups in the number of participants with more than one adenoma (Analysis 5.4: n = 1905, 1 RCT, RR 0.89, 95% CI 0.64 to 1.24). The best/worst case scenario sensitivity analysis showed contrary results indicating that missing data had an important impact on our findings (Analysis 11.4).
5.4. Analysis.

Comparison 5 Comprehensive dietary intervention versus control, Outcome 4 Number of participants with more than one adenoma (8 years).
11.4. Analysis.
Comparison 11 Sensitivity analysis 5. Comprehensive dietary intervention versus control, Outcome 4 Number of participants with more than one adenoma (8 years).
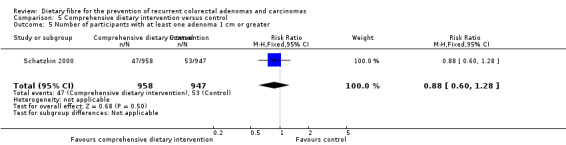
5.5 Number of participants with at least one adenoma 1 cm or greater (after four years)
There was no statistically significant difference in the number of participants with at least one adenoma 1 cm or greater between the dietary intervention and control groups (Analysis 5.5: n = 1905, 1 RCT, RR 0.88, 95% CI 0.60 to 1.28). The best/worst case scenario sensitivity analysis showed contrary results indicating that missing data had an important impact on our findings (Analysis 11.5).
5.5. Analysis.
Comparison 5 Comprehensive dietary intervention versus control, Outcome 5 Number of participants with at least one adenoma 1 cm or greater.
11.5. Analysis.
Comparison 11 Sensitivity analysis 5. Comprehensive dietary intervention versus control, Outcome 5 Number of participants with at least one adenoma 1 cm or greater.
5.6 Number of participants diagnosed with colorectal cancer
In this subgroup, no study reported data for this outcome.
5.7 Number of participants that reported at least one adverse event
In this subgroup, no study reported data for this outcome.
6. Ispaghula husk versus control
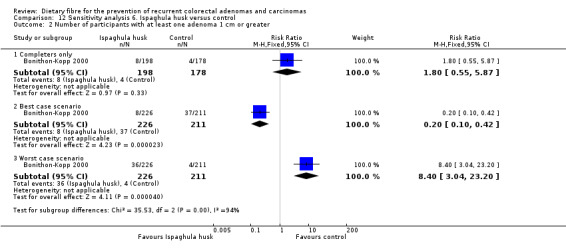
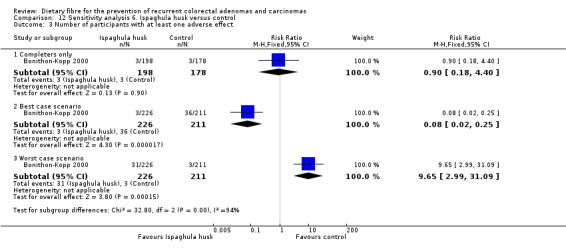
6.1 Number of participants with at least one recurrent adenoma (after three years)
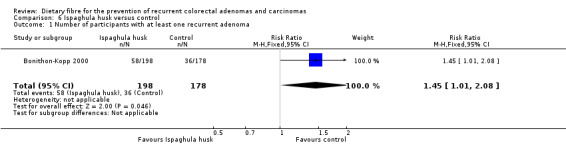
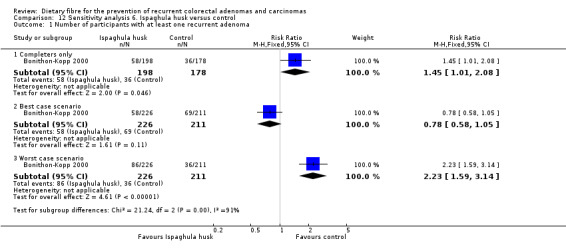
A statistically significantly higher number of participants in the ispaghula husk group (P = 0.05) had at least one recurrent adenoma than the control group (Analysis 6.1: n = 376, 1 RCT, RR 1.45, 95% CI 1.01 to 2.08, NNTH 11, 95% CI 5 to 495). The best/worst case scenario sensitivity analysis showed contrary results indicating that missing data had an important impact on our findings (Analysis 12.1).
6.1. Analysis.
Comparison 6 Ispaghula husk versus control, Outcome 1 Number of participants with at least one recurrent adenoma.
12.1. Analysis.
Comparison 12 Sensitivity analysis 6. Ispaghula husk versus control, Outcome 1 Number of participants with at least one recurrent adenoma.
6.2 Number of participants with more than one adenoma
In this subgroup, no study reported data for this outcome.
6.3 Number of participants with at least one adenoma 1 cm or greater (after three years)
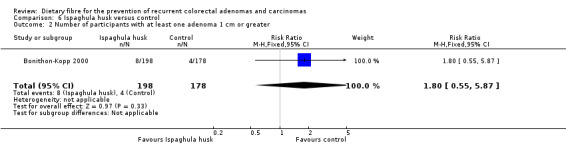
We found no statistically significant difference in the number of participants with at least one adenoma 1 cm or greater between the two treatment groups (Analysis 6.2: n = 376, 1 RCT, RR 1.80, 95% CI 0.55 to 5.87). The best/worst case scenario sensitivity analysis showed contrary results indicating that missing data had an important impact on our findings (Analysis 12.2).
6.2. Analysis.
Comparison 6 Ispaghula husk versus control, Outcome 2 Number of participants with at least one adenoma 1 cm or greater.
12.2. Analysis.
Comparison 12 Sensitivity analysis 6. Ispaghula husk versus control, Outcome 2 Number of participants with at least one adenoma 1 cm or greater.
6.4 Number of participants diagnosed with colorectal cancer
In this subgroup, no study reported data for this outcome.
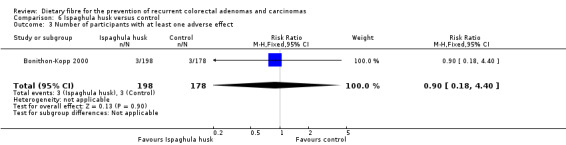
6.5 Number of participants with at least one adverse effect (after three years)
No statistically significant difference was found in the number of participants with at least one adverse effect, between the two groups (Analysis 6.3: n = 376, 1 RCT, RR 0.90, 95% CI 0.18 to 4.40). The best/worst case scenario sensitivity analysis showed contrary results indicating that missing data had an important impact on our findings (Analysis 12.3).
6.3. Analysis.
Comparison 6 Ispaghula husk versus control, Outcome 3 Number of participants with at least one adverse effect.
12.3. Analysis.
Comparison 12 Sensitivity analysis 6. Ispaghula husk versus control, Outcome 3 Number of participants with at least one adverse effect.
Discussion
Summary of main results
Various clinical endpoints (such as CRC or presence of adenomatous polyps) are collected in various phases of clinical trials. CRC is relatively difficult to observe in a RCT, as it may take a long time to develop and, even if trials are conducted with sufficiently long follow‐up periods, increasing numbers of participants may be lost to follow‐up as the trial progresses. Due to these difficulties inherent in using CRC as an end point, several different biomarkers of CRC have been relied on in cancer chemoprevention trials (Einspahr 1997; Emerson 1993). Studies in this review have focused on the presence of adenomatous polyps, clinically identifiable precursors of CRC (Einspahr 1997; Stryker 1987; Winawer 1993a), as a surrogate outcome.
Data from five trials including 4798 participants, compared increased dietary fibre supplementation to a control group. Over a period of two to eight years, there was no evidence that dietary fibre reduced the recurrence of colorectal adenomas (Analysis 1.1: RR 1.04, 95% CI 0.95 to 1.13). In Analysis 1.4 CRC was statistically significantly higher (17/1426; NNTH = 134) in the dietary fibre group compared with the control group (6/1368) at four years. However, Schatzkin 2000 reported one‐year CRC data, and no statistically significant difference was found between the dietary fibre (4/958) and control (2/947) groups. The finding was expected given the low event rate and the relatively small sample size. Although the increase in the incidence of CRC at four years was small in absolute terms (number per 1000 people), an intervention such as dietary fibre is sold to the general population as 'healthy', therefore this could translate into fairly large numbers of people overall depending on the numbers of people following such lifestyle advice. However, the numbers of participants in the analyses for CRC were too small to be confident in the result. In addition, the results of all the meta‐analyses were adversely affected by large numbers of participants being lost to follow‐up (attrition bias); when we made assumptions about the outcomes of these missing participants (worst/best case scenarios) based on completer analyses, the result of all the analyses changed sufficiently to alter the conclusions that would be drawn.
In addition, results from the four‐year Polyp Prevention Trial II (Schatzkin 2000) were the most heavily weighted in the analysis, due to its large sample size and high event rate. In this study, increased consumption of dietary fibre from whole foods, vegetables and fruits, and decreased intake of fat, had no effect on the rate of recurrence of adenomas. A four‐year subsequent follow‐up revealed that there was no statistically significant difference in the number of participants with at least one recurrent adenoma (Analysis 5.2: n = 801, 1 RCT, RR 0.96, 95% CI 0.80 to 1.15). At eight years, the number of participants who were given the high fibre intervention who had more than one polyp was not statistically significantly different from the control group (Schatzkin 2000). However, this particular analysis was under powered, thus we are unable to conclude if there was really no difference between groups.
While three other included studies that added wheat bran fibre (WBF) supplementation to the intervention reported no effect on recurrent adenomas (Alberts 2000; MacLennan 1995; McKeown‐Eyssen 1994), the European Cancer Prevention study (Bonithon‐Kopp 2000) actually reported an increase in recurrent adenomas in the ispaghula husk intervention group compared to controls. The biological basis of this finding is unclear.
This review has employed surrogate outcomes such as the occurrence of adenomatous polyps as a risk reference for CRC. However, any conclusions based on surrogate outcomes must be interpreted with caution. Although somatic mutation theory is a classical theory in cancer development, we should not ignore the role of carcinogenesis and other external factors, such as lifestyle, smoking history and alcohol consumption Baker 2007, which can lead to unequal conversion rate from adenomatous to cancer between experimental and control groups. Thus, readers should interpret the results with caution.
Overall completeness and applicability of evidence
We included seven studies, however only five studies provided data for meta‐analyses. Only two studies reported rates of CRC (Alberts 2000; Schatzkin 2000); the primary outcome of the other studies was adenomas. One of these trials included only 100 participants, and was therefore very underpowered. The other trial recruited 2079 participants, but event rates were very low, therefore, any analyses of the benefits of dietary fibre in reducing the risk of CRC were underpowered. These limitations are a source of uncertainty in our results.
In addition, CRC develops typically 10 years after the adenoma begins to develop (Half 2009). Consequently, the main outcome in the studies was the surrogate outcome of adenomatous polyp, as participants were followed‐up for less than 10 years. There is a need to demonstrate that the effect of treatment on a surrogate endpoint predicts the effect of treatment on the true endpoint (i.e. CRC). The strength and direction of the relationship between the surrogate outcome and the definitive outcome over a specified time interval should be also be known (Grizzle 1999). Although most CRCs develop from an adenomatous polyp, only a small fraction of adenomas develop into cancer and better predictive biomarkers are needed or, in their absence, longer‐term trials are needed.
Quality of the evidence
Another potential confounding factor is the possibility that the consumption of dietary fibre was not high enough. However, the reported level of dietary fibre intake in several of the studies was comparable to historic levels of fibre consumption in South Africa where there is a low incidence of CRC (Segal 2000). In the Wheat Bran Fibre (WBF) trial, the intake of dietary fibre was increased to 27 g a day in the intervention group versus 18.2 g a day in the control group (Alberts 2000). Dietary fibre in the Australian Polyp Prevention Trial was increased by 7 g a day in the treatment group (MacLennan 1995). When intensive nutritional counselling was provided, dietary fibre from whole foods, with or without WBF, increased to 30 g to 35 g a day (McKeown‐Eyssen 1994; Schatzkin 2000). It must be noted, however, that the Toronto Polyp Prevention Study was unable to achieve their goal of 50 g a day of dietary fibre (McKeown‐Eyssen 1994), suggesting that compliance with high levels of dietary fibre intake may be problematic in a Western population. Further, intake of dietary fibre from other sources may be reduced when high levels of WBF are part of the intervention (Ishikawa 2000b).
It has also been suggested that enrolling participants at an earlier age and prolonging the duration of the trial may help uncover the benefits of a high dietary fibre intake. The rationale for enrolling older participants rests on the observation that those who are already diagnosed with a colorectal adenoma have a higher risk of developing subsequent adenomas, thereby reducing the total number of participants needed in a clinical trial. The downside of employing data from a high risk population is that the external validity or generalisability of the trial, subsequently the systematic review, is limited and may not be applicable to the general population. There is a possibility that the high risk population is less responsive to fibre and that fibre may have beneficial effect in those who have yet to show signs of disease. Further, while prolonging the duration of a trial in a cohort that is already undergoing endoscopic surveillance may seem reasonable, the potential for subject 'burnout' from a comprehensive dietary intervention, intensive nutritional counselling and increased costs make this option less realistic.
For the risk of bias in included studies, we considered attrition bias a major concern. The sensitivity analysis in best and worst case scenarios showed contrary results, which means that the missing data had a significant impact on our results. Although the blinding of participants and outcome assessors was not well conducted among studies, we did not regard the performance or detection bias as significant, as the detection and performance bias has little impact on objective outcomes.
Potential biases in the review process
Despite the high prevalence of CRC in industrialised countries, the development of clinical trials designed to assess primary prevention strategies is hampered by the slow progression of the disease and the large number of participants required. Nevertheless, though CRC was not the primary outcome, two of the included studies reported an increase in the incidence of CRC in the fibre intervention groups (Alberts 2000; Schatzkin 2000).
Of the 14 cases in Schatzkin 2000 who had CRC, six were diagnosed within the first year and four of these six cases were in the intervention group. Thus, the difference between the CRC rates in the intervention and control groups (NNTH = 134) is more likely to be a chance occurrence given the wide confidence interval around NNTH (95% CI 39 to 3247). The wide confidence interval could have resulted from low participant numbers, a low event rate or any other uncertainty, thus the clinical significance of the above result is debatable and impact of fibre on CRC cannot be concluded on the basis of these numbers.
Outcome data were not reported separately according to gender and therefore our analyses were not subgrouped. Alberts 2000 and Bonithon‐Kopp 2000 performed baseline adjustment for gender and found no evidence that outcomes were affected. However, Schatzkin 2000 also adjusted for sex and reported that recurrence of adenomas in women was significantly higher in the fibre group with an unadjusted risk ratio of 1.30 (95% CI 1.04 to 1.63; P = 0.03). Jacobs 2006 combined the results of both the Alberts 2000 and Schatzkin 2000 studies to find the interaction between sex, fibre and adenoma recurrence. The pooled analysis reported the effects of dietary intervention using logistic regression models and found that colorectal adenoma recurrence in the fibre group for men was associated with significantly reduced risk of recurrence, odds ratio 0.81 (95% CI 0.67, 0.98). There may be potential for systematic gender‐dependent errors, and as stated in the Jacobs 2006 study, the mechanism for the occurrence of differential effects remains unclear, and further investigation is required.
Agreements and disagreements with other studies or reviews
Our findings from these five RCTs are at odds with some cohort studies that report benefits from dietary fibre. In the Aune 2011a meta‐analysis of cohort studies, the risk of CRC was significantly lower (RR 0.88, 95% CI 0.82 to 0.94) in participants measured by total high fibre intake, and also for intake of high whole grains. However, the authors found no statistically significant difference in cohorts comparing high versus low fruit fibre intake, high versus low vegetable fibre intake, or high versus low legume fibre intake. Additionally, no formal assessment of risk of bias was conducted and it is unclear if confounding variables affected the results, although attempts were made to adjust for these.
Other factors are likely to contribute to the reduced risk found in cohorts consuming higher dietary fibre. Typically, healthier diets are accompanied by healthier lifestyles and better nutrition, and the reverse is true for people consuming low fibre diets. It is plausible that those cohort‐participants with higher total dietary fibre accrued benefits from consuming foods with higher nutrition, especially vitamin D, calcium and folate, which are associated with reduced risk of CRC (Pericleous 2013). The vitamin and mineral content of refined foods such as white bread, white rice, white pasta and breakfast cereals is greatly reduced once the bran and germ are removed (Hegedüs 1985), and attempts are often made (depending on the legal requirements of individual countries) to restore nutrients lost during the manufacturing process (Bonner 1999). Other potential confounding factors that increase the risk of CRC include smoking (Liang 2009), sedentary lifestyles (Slattery 2004; Wolin 2009) and obesity (Frezza 2006) and it is these risk factors that are clustered in people with poor‐quality, low‐dietary‐fibre diets (Burke 1997; Ma 2000; Poortinga 2007; Suh 2013 ).
A number of explanations have been proposed for the apparent lack of association between dietary fibre and the development of CRC in clinical trials. Volunteer bias has been one such proposal. Participation in trials that entail nutritional interventions generally requires a significant commitment on the part of the participants. In addition, participants are likely to engage in healthier lifestyles that could potentially counteract any benefit derived from the dietary intervention. Though participants in the included trials were shown to consume more dietary fibre than the average American (approximately 15 g to 20 g a day versus 11.1 g to 13.4 g a day respectively) (Ganji 1995; Lanza 1987), there was no difference in smoking habits, body mass index, percentage of total caloric intake from fat, or use of multivitamins (Balluz 2000; Chao 2000; Ganji 1995; Kuczmarski 1997; Lyle 1998; Ruchlin 1999; Sundquist 2001). Consistent with previous reports (Hixson 1991; Neugut 1993; Winawer 1993b), there was also a high rate of recurrent adenomas (20% to 40%). Taken together, these observations suggest that volunteer bias did not play a significant role.
Authors' conclusions
Implications for practice.
Both lifestyle and diet are considered to be important environmental factors that influence the risk of developing colorectal cancer (CRC), though it is unlikely that one component plays a dominant role. To date, the evidence from randomised controlled trials (RCTs) included in this review does not support that increased dietary fibre intake reduces the risk of CRC or reduces the risk of recurrence of adenomatous polyps within a two‐ to eight‐year period compared with control groups. Nevertheless, the reliability of these data is questionable due to a variety of reasons such as the conduct of the trials, the large number of missing data, small sample sizes, surrogate outcome employed and so on, thus limiting our confidence in any findings derived from this data set. There is some indication that CRC may be increased by high fibre intake, but the data were insufficient and under‐powered to support such an association. We have no reliable evidence to refute the use of dietary fibre.
Implications for research.
One ongoing trial will provide new information regarding the association between dietary fibre intake and the development of new or recurrent colorectal adenomas or CRC (Ishikawa 2000b). This is the first "non‐Western" trial, being carried out in Japan, in which dietary fibre and WBF has been included as an intervention for the prevention of recurrent colorectal adenomas. It remains to be seen whether the results from this trial will be consistent with the included studies in this review, in which using WBF did not add additional benefit. The internationally recognised healthy fibre intake, as recommended by the American Cancer Socity and the British Nutrition Foundation, is between 30 g to 40 g a day. Although we recognise the challenge of encouraging people to maintain a high level of high fibre intake, where possible, future trials should aim for the intervention group to have that level of intake and preferably higher. Longer trial duration will also help to identify the preferred endpoint of CRC, but we understand long‐term trials may not be possible due to cost and other practical issues. Thus, we encourage the trial duration to be as long as resources allow.
What's new
| Date | Event | Description |
|---|---|---|
| 4 April 2016 | New citation required but conclusions have not changed | New searches performed. Two new identified RCTs included in this update. |
History
Protocol first published: Issue 1, 2002 Review first published: Issue 2, 2002
| Date | Event | Description |
|---|---|---|
| 24 June 2013 | New citation required but conclusions have not changed | New search run and one further report with 8‐ year follow‐ up data added. Converted to new review format. |
| 13 November 2001 | New citation required and conclusions have changed | Substantive amendment |
Acknowledgements
We are grateful to:
the Cochrane Colorectal Cancer and Dr. Arne Ohlsson for advice on the protocol and final review;
trialists Dr D Alberts, V Jazmaji, Dr Faivre, Dr Bonithon‐Kopp, and Dr I Akedo for responding to requests for further information;
Dr J Baron for expert assistance regarding completeness of our list of included studies.
The current review authors would like to thank Tracey Asano and Robin McLeod for their contribution to the earlier version of the review.
Appendices
Appendix 1. Cochrane Library search strategy
#1 MeSH descriptor: [Cereals] explode all trees
#2 MeSH descriptor: [Dietary Fiber] explode all trees
#3 MeSH descriptor: [Dietary Carbohydrates] explode all trees
#4 (wholemeal$ or whole meal$ wholegrain$ or whole grain$ or cereal$ or grain$ or starch or high‐fiber or fibre or fiber or dietary intervention or dietary carbohydrate$ or roughage$ or wheat bran$)
#5 (#1 or #2 or #3 or #4)
#6 MeSH descriptor: [Colorectal Neoplasms] explode all trees
#7 MeSH descriptor: [Colonic Polyps] explode all trees
#8 ((colorect$ or colon$ or rect$ or anal$ or anus$ or intestin$ or bowel$) near/3 (carcinom$ or neoplas$ or adenocarcinom$ or cancer$ or tumor$ or tumour$ or sarcom$ or polyp$ or adenom$))
#9 (#6 or #7 or #8)
#10 (#5 and #9)
Appendix 2. MEDLINE search strategy
1. exp Cereals/
2. exp Dietary Fiber/
3. exp Dietary Carbohydrates/
4. (wholemeal$ or whole meal$ wholegrain$ or whole grain$ or cereal$ or grain$ or starch or high‐fiber or fibre or fiber or dietary intervention or dietary carbohydrate$ or roughage$ or wheat bran$).mp.
5. 1 or 2 or 3 or 4
6. exp Colorectal Neoplasms/
7. exp Colonic Polyps/
8. ((colorect$ or colon$ or rect$ or anal$ or anus$ or intestin$ or bowel$) adj3 (carcinom$ or neoplas$ or adenocarcinom$ or cancer$ or tumor$ or tumour$ or sarcom$ or polyp$ or adenom$)).mp.
9. 6 or 7 or 8
10. 5 and 9
11. randomized controlled trial.pt.
12. controlled clinical trial.pt.
13. randomized.ab.
14. placebo.ab.
15. clinical trial as topic.sh.
16. randomly.ab.
17. trial.ti.
18. 11 or 12 or 13 or 14 or 15 or 16 or 17
19. exp animals/ not humans.sh.
20. 18 not 19
21. 10 and 20
Appendix 3. Embase search strategy
1. *cereal/
2. *dietary fiber/
3. *carbohydrate diet/
4. (wholemeal$ or whole meal$ wholegrain$ or whole grain$ or cereal$ or grain$ or starch or high‐fiber or fibre or fiber or dietary intervention or dietary carbohydrate$ or roughage$ or wheat bran$).m_titl.
5. 1 or 2 or 3 or 4
6. exp large intestine tumor/
7. ((colorect$ or colon$ or rect$ or anal$ or anus$ or intestin$ or bowel$) and (carcinom$ or neoplas$ or adenocarcinom$ or cancer$ or tumor$ or tumour$ or sarcom$ or polyp$ or adenom$)).m_titl.
8. 6 or 7
9. 5 and 8
10. CROSSOVER PROCEDURE.sh.
11. DOUBLE‐BLIND PROCEDURE.sh.
12. SINGLE‐BLIND PROCEDURE.sh.
13. (crossover* or cross over*).ti,ab.
14. placebo*.ti,ab.
15. (doubl* adj blind*).ti,ab.
16. allocat*.ti,ab.
17. trial.ti.
18. RANDOMIZED CONTROLLED TRIAL.sh.
19. random*.ti,ab.
20. 10 or 11 or 12 or 13 or 14 or 15 or 16 or 17 or 18 or 19
21. (exp animal/ or exp invertebrate/ or animal.hw. or nonhuman/) not (exp human/ or human cell/ or (human or humans or man or men or wom?n).ti.)
22. 20 not 21
23. 9 and 22
Appendix 4. Criteria for judging risk of bias in the 'Risk of bias' assessment tool
|
Random sequence generation Selection bias (biased allocation to interventions) due to inadequate generation of a randomised sequence. | |
| Criteria for a judgement of ‘low risk’ of bias | The investigators describe a random component in the sequence generation process such as:
*Minimisation may be implemented without a random element, and this is considered to be equivalent to being random. |
| Criteria for the judgement of ‘high risk’ of bias | The investigators describe a non‐random component in the sequence generation process. Usually, the description would involve some systematic, non‐random approach, for example:
Other non‐random approaches happen much less frequently than the systematic approaches mentioned above and tend to be obvious. They usually involve judgement or some method of non‐random categorisation of participants, for example:
|
| Criteria for the judgement of ‘unclear risk’ of bias | Insufficient information about the sequence generation process to permit judgement of ‘low risk’ or ‘high risk’ |
|
Allocation concealment Selection bias (biased allocation to interventions) due to inadequate concealment of allocations prior to assignment. | |
| Criteria for a judgement of ‘low risk’ of bias | Participants and investigators enrolling participants could not foresee assignment because one of the following, or an equivalent method, was used to conceal allocation:
|
| Criteria for the judgement of ‘high risk’ of bias | Participants or investigators enrolling participants could possibly foresee assignments and thus introduce selection bias, such as allocation based on:
|
| Criteria for the judgement of ‘unclear risk’ of bias | Insufficient information to permit judgement of ‘low risk’ or ‘high risk’. This is usually the case if the method of concealment is not described or not described in sufficient detail to allow a definite judgement – for example if the use of assignment envelopes is described, but it remains unclear whether envelopes were sequentially numbered, opaque and sealed. |
|
Blinding of participants and personnel Performance bias due to knowledge of the allocated interventions by participants and personnel during the study. | |
| Criteria for a judgement of ‘low risk’ of bias | Any one of the following:
|
| Criteria for the judgement of ‘high risk’ of bias | Any one of the following:
|
| Criteria for the judgement of ‘unclear risk’ of bias | Any one of the following:
|
|
Blinding of outcome assessment Detection bias due to knowledge of the allocated interventions by outcome assessors. | |
| Criteria for a judgement of ‘low risk’ of bias | Any one of the following:
|
| Criteria for the judgement of ‘high risk’ of bias | Any one of the following:
|
| Criteria for the judgement of ‘unclear risk’ of bias | Any one of the following:
|
|
Incomplete outcome data Attrition bias due to amount, nature or handling of incomplete outcome data. | |
| Criteria for a judgement of ‘low risk’ of bias | Any one of the following:
|
| Criteria for the judgement of ‘high risk’ of bias | Any one of the following:
|
| Criteria for the judgement of ‘unclear risk’ of bias | Any one of the following:
|
|
Selective reporting Reporting bias due to selective outcome reporting. | |
| Criteria for a judgement of ‘low risk’ of bias | Any of the following:
|
| Criteria for the judgement of ‘high risk’ of bias | Any one of the following:
|
| Criteria for the judgement of ‘unclear risk’ of bias | Insufficient information to permit judgement of ‘low risk’ or ‘high risk’. It is likely that the majority of studies will fall into this category. |
|
Other bias Bias due to problems not covered elsewhere in the table. | |
| Criteria for a judgement of ‘low risk’ of bias | The study appears to be free of other sources of bias. |
| Criteria for the judgement of ‘high risk’ of bias | There is at least one important risk of bias. For example, the study:
|
| Criteria for the judgement of ‘unclear risk’ of bias | There may be a risk of bias, but there is either:
|
Data and analyses
Comparison 1. Dietary fibre (all study interventions) versus control.
| Outcome or subgroup title | No. of studies | No. of participants | Statistical method | Effect size |
|---|---|---|---|---|
| 1 Number of participants with at least one recurrent adenoma | 5 | 3641 | Risk Ratio (M‐H, Fixed, 95% CI) | 1.04 [0.95, 1.13] |
| 2 Number of participants with more than one adenoma | 2 | 2542 | Risk Ratio (M‐H, Fixed, 95% CI) | 1.06 [0.94, 1.20] |
| 3 Number of participants with at least one adenoma 1 cm or greater | 4 | 3224 | Risk Ratio (M‐H, Fixed, 95% CI) | 0.99 [0.82, 1.20] |
| 4 Number of participants diagnosed with colorectal cancer | 2 | Risk Ratio (M‐H, Fixed, 95% CI) | Subtotals only | |
| 4.1 One‐ year data | 1 | 1905 | Risk Ratio (M‐H, Fixed, 95% CI) | 1.98 [0.36, 10.77] |
| 4.2 Up to 4 years | 2 | 2794 | Risk Ratio (M‐H, Fixed, 95% CI) | 2.70 [1.07, 6.85] |
Comparison 2. Wheat bran fibre versus control.
| Outcome or subgroup title | No. of studies | No. of participants | Statistical method | Effect size |
|---|---|---|---|---|
| 1 Number of participants with at least one recurrent adenoma | 2 | 1195 | Risk Ratio (M‐H, Fixed, 95% CI) | 1.01 [0.87, 1.18] |
| 2 Number of participants with more than one adenoma | 1 | 637 | Risk Ratio (M‐H, Fixed, 95% CI) | 1.11 [0.97, 1.29] |
| 3 Number of participants with at least one adenoma 1 cm or greater | 1 | 637 | Risk Ratio (M‐H, Fixed, 95% CI) | 1.04 [0.83, 1.31] |
Comparison 3. Wheat bran fibre and low fat diet versus control.
| Outcome or subgroup title | No. of studies | No. of participants | Statistical method | Effect size |
|---|---|---|---|---|
| 1 Number of participants with at least one recurrent adenoma | 1 | 165 | Risk Ratio (M‐H, Fixed, 95% CI) | 1.19 [0.64, 2.18] |
Comparison 4. Wheat bran fibre with or without low fat diet versus control.
| Outcome or subgroup title | No. of studies | No. of participants | Statistical method | Effect size |
|---|---|---|---|---|
| 1 Number of participants with at least one recurrent adenoma | 3 | 1360 | Risk Ratio (M‐H, Fixed, 95% CI) | 1.03 [0.88, 1.19] |
| 2 Number of participants with more than one adenoma | 1 | 637 | Risk Ratio (M‐H, Fixed, 95% CI) | 1.11 [0.97, 1.29] |
| 3 Number of participants with at least one adenoma 1 cm or greater | 2 | 943 | Risk Ratio (M‐H, Fixed, 95% CI) | 1.02 [0.81, 1.27] |
Comparison 5. Comprehensive dietary intervention versus control.
| Outcome or subgroup title | No. of studies | No. of participants | Statistical method | Effect size |
|---|---|---|---|---|
| 1 Number of participants with at least one recurrent adenoma (4 years) | 1 | 1905 | Risk Ratio (M‐H, Fixed, 95% CI) | 1.00 [0.90, 1.12] |
| 2 Number of participants with at least one recurrent adenoma (8 years) | 1 | 1905 | Risk Ratio (M‐H, Fixed, 95% CI) | 0.97 [0.78, 1.20] |
| 3 Number of participants with more than one adenoma (4 years) | 1 | 1905 | Risk Ratio (M‐H, Fixed, 95% CI) | 1.01 [0.83, 1.24] |
| 4 Number of participants with more than one adenoma (8 years) | 1 | 1905 | Risk Ratio (M‐H, Fixed, 95% CI) | 0.89 [0.64, 1.24] |
| 5 Number of participants with at least one adenoma 1 cm or greater | 1 | 1905 | Risk Ratio (M‐H, Fixed, 95% CI) | 0.88 [0.60, 1.28] |
Comparison 6. Ispaghula husk versus control.
| Outcome or subgroup title | No. of studies | No. of participants | Statistical method | Effect size |
|---|---|---|---|---|
| 1 Number of participants with at least one recurrent adenoma | 1 | 376 | Risk Ratio (M‐H, Fixed, 95% CI) | 1.45 [1.01, 2.08] |
| 2 Number of participants with at least one adenoma 1 cm or greater | 1 | 376 | Risk Ratio (M‐H, Fixed, 95% CI) | 1.80 [0.55, 5.87] |
| 3 Number of participants with at least one adverse effect | 1 | 376 | Risk Ratio (M‐H, Fixed, 95% CI) | 0.90 [0.18, 4.40] |
Comparison 7. Sensitivity analysis 1. Dietary fibre (all study interventions) versus control.
| Outcome or subgroup title | No. of studies | No. of participants | Statistical method | Effect size |
|---|---|---|---|---|
| 1 Number of participants with at least one recurrent adenoma | 5 | Risk Ratio (M‐H, Fixed, 95% CI) | Subtotals only | |
| 1.1 Completers only | 5 | 3641 | Risk Ratio (M‐H, Fixed, 95% CI) | 1.04 [0.95, 1.13] |
| 1.2 Best case scenario | 5 | 4536 | Risk Ratio (M‐H, Fixed, 95% CI) | 0.61 [0.57, 0.66] |
| 1.3 Worst case scenario | 5 | 4536 | Risk Ratio (M‐H, Fixed, 95% CI) | 1.73 [1.60, 1.88] |
| 2 Number of participants with more than one adenoma | 2 | Risk Ratio (M‐H, Fixed, 95% CI) | Subtotals only | |
| 2.1 Completers only | 2 | 2542 | Risk Ratio (M‐H, Fixed, 95% CI) | 1.06 [0.94, 1.20] |
| 2.2 Best case scenario | 2 | 3508 | Risk Ratio (M‐H, Fixed, 95% CI) | 0.43 [0.38, 0.47] |
| 2.3 Worst case scenario | 2 | 3508 | Risk Ratio (M‐H, Fixed, 95% CI) | 2.48 [2.23, 2.77] |
| 3 Number of participants with at least one adenoma 1 cm or greater | 4 | Risk Ratio (M‐H, Fixed, 95% CI) | Subtotals only | |
| 3.1 Completers only | 4 | 3224 | Risk Ratio (M‐H, Fixed, 95% CI) | 0.99 [0.82, 1.20] |
| 3.2 Best case scenario | 4 | 4335 | Risk Ratio (M‐H, Fixed, 95% CI) | 0.22 [0.19, 0.26] |
| 3.3 Worst case scenario | 4 | 4335 | Risk Ratio (M‐H, Fixed, 95% CI) | 4.15 [3.56, 4.85] |
| 4 Number of participants diagnosed with colorectal cancer | 2 | Risk Ratio (M‐H, Fixed, 95% CI) | Subtotals only | |
| 4.1 One‐ year data ‐ completers only | 1 | 1905 | Risk Ratio (M‐H, Fixed, 95% CI) | 1.98 [0.36, 10.77] |
| 4.2 One‐ year data ‐ best case scenario | 1 | 2079 | Risk Ratio (M‐H, Fixed, 95% CI) | 0.04 [0.02, 0.11] |
| 4.3 One‐ year data ‐ worst case scenario | 1 | 2079 | Risk Ratio (M‐H, Fixed, 95% CI) | 41.70 [10.28, 169.08] |
| 4.4 Up to 4 years ‐ completers only | 2 | 2794 | Risk Ratio (M‐H, Fixed, 95% CI) | 2.70 [1.07, 6.85] |
| 4.5 Up to 4 years ‐ best case scenario | 2 | 3508 | Risk Ratio (M‐H, Fixed, 95% CI) | 0.05 [0.03, 0.08] |
| 4.6 Up to 4 years ‐ worst case scenario | 2 | 3508 | Risk Ratio (M‐H, Fixed, 95% CI) | 62.30 [27.32, 142.04] |
Comparison 8. Sensitivity analysis 2. Wheat bran fibre versus control.
| Outcome or subgroup title | No. of studies | No. of participants | Statistical method | Effect size |
|---|---|---|---|---|
| 1 Number of participants with at least one recurrent adenoma | 2 | Risk Ratio (M‐H, Fixed, 95% CI) | Subtotals only | |
| 1.1 Completers only | 2 | 1195 | Risk Ratio (M‐H, Fixed, 95% CI) | 1.01 [0.87, 1.18] |
| 1.2 Best case scenario | 2 | 1819 | Risk Ratio (M‐H, Fixed, 95% CI) | 0.40 [0.35, 0.46] |
| 1.3 Worst case scenario | 2 | 1819 | Risk Ratio (M‐H, Fixed, 95% CI) | 2.46 [2.15, 2.80] |
| 2 Number of participants with more than one adenoma | 1 | Risk Ratio (M‐H, Fixed, 95% CI) | Subtotals only | |
| 2.1 Completers only | 1 | 637 | Risk Ratio (M‐H, Fixed, 95% CI) | 1.11 [0.97, 1.29] |
| 2.2 Best case scenario | 1 | 1429 | Risk Ratio (M‐H, Fixed, 95% CI) | 0.31 [0.28, 0.36] |
| 2.3 Worst case scenario | 1 | 1429 | Risk Ratio (M‐H, Fixed, 95% CI) | 3.34 [2.90, 3.85] |
| 3 Number of participants with at least one adenoma 1 cm or greater | 1 | Risk Ratio (M‐H, Fixed, 95% CI) | Subtotals only | |
| 3.1 Completers only | 1 | 637 | Risk Ratio (M‐H, Fixed, 95% CI) | 1.04 [0.83, 1.31] |
| 3.2 Best case scenario | 1 | 1429 | Risk Ratio (M‐H, Fixed, 95% CI) | 0.21 [0.17, 0.25] |
| 3.3 Worst case scenario | 1 | 1429 | Risk Ratio (M‐H, Fixed, 95% CI) | 4.78 [3.95, 5.79] |
Comparison 9. Sensitivity analysis 3. Wheat bran fibre and low fat diet versus control.
| Outcome or subgroup title | No. of studies | No. of participants | Statistical method | Effect size |
|---|---|---|---|---|
| 1 Number of participants with at least one recurrent adenoma | 1 | Risk Ratio (M‐H, Fixed, 95% CI) | Subtotals only | |
| 1.1 Completers only | 1 | 165 | Risk Ratio (M‐H, Fixed, 95% CI) | 1.19 [0.64, 2.18] |
| 1.2 Best case scenario | 1 | 201 | Risk Ratio (M‐H, Fixed, 95% CI) | 0.57 [0.33, 0.95] |
| 1.3 Worst case scenario | 1 | 201 | Risk Ratio (M‐H, Fixed, 95% CI) | 2.45 [1.46, 4.09] |
Comparison 10. Sensitivity analysis 4. Wheat bran fibre with or without low fat diet versus control.
| Outcome or subgroup title | No. of studies | No. of participants | Statistical method | Effect size |
|---|---|---|---|---|
| 1 Number of participants with at least one recurrent adenoma | 3 | Risk Ratio (M‐H, Fixed, 95% CI) | Subtotals only | |
| 1.1 Completers only | 3 | 1360 | Risk Ratio (M‐H, Fixed, 95% CI) | 1.03 [0.88, 1.19] |
| 1.2 Best case scenario | 3 | 2020 | Risk Ratio (M‐H, Fixed, 95% CI) | 0.41 [0.36, 0.47] |
| 1.3 Worst case scenario | 3 | 2020 | Risk Ratio (M‐H, Fixed, 95% CI) | 2.45 [2.16, 2.79] |
| 2 Number of participants with more than one adenoma | 1 | Risk Ratio (M‐H, Fixed, 95% CI) | Subtotals only | |
| 2.1 Completers only | 1 | 637 | Risk Ratio (M‐H, Fixed, 95% CI) | 1.11 [0.97, 1.29] |
| 2.2 Best case scenario | 1 | 1429 | Risk Ratio (M‐H, Fixed, 95% CI) | 0.31 [0.28, 0.36] |
| 2.3 Worst case scenario | 1 | 1429 | Risk Ratio (M‐H, Fixed, 95% CI) | 3.34 [2.90, 3.85] |
| 3 Number of participants with at least one adenoma 1 cm or greater | 2 | Risk Ratio (M‐H, Fixed, 95% CI) | Subtotals only | |
| 3.1 Completers only | 2 | 943 | Risk Ratio (M‐H, Fixed, 95% CI) | 1.02 [0.81, 1.27] |
| 3.2 Best case scenario | 2 | 1819 | Risk Ratio (M‐H, Fixed, 95% CI) | 0.20 [0.17, 0.24] |
| 3.3 Worst case scenario | 2 | 1819 | Risk Ratio (M‐H, Fixed, 95% CI) | 4.81 [4.00, 5.78] |
Comparison 11. Sensitivity analysis 5. Comprehensive dietary intervention versus control.
| Outcome or subgroup title | No. of studies | No. of participants | Statistical method | Effect size |
|---|---|---|---|---|
| 1 Number of participants with at least one recurrent adenoma (4 years) | 1 | Risk Ratio (M‐H, Fixed, 95% CI) | Subtotals only | |
| 1.1 Completers only | 1 | 1905 | Risk Ratio (M‐H, Fixed, 95% CI) | 1.00 [0.90, 1.12] |
| 1.2 Best case scenario | 1 | 2079 | Risk Ratio (M‐H, Fixed, 95% CI) | 0.81 [0.73, 0.90] |
| 1.3 Worst case scenario | 1 | 2079 | Risk Ratio (M‐H, Fixed, 95% CI) | 1.23 [1.11, 1.37] |
| 2 Number of participants with at least one recurrent adenoma (8 years) | 1 | Risk Ratio (M‐H, Fixed, 95% CI) | Subtotals only | |
| 2.1 Completers only | 1 | 1905 | Risk Ratio (M‐H, Fixed, 95% CI) | 0.97 [0.78, 1.20] |
| 2.2 Best case scenario | 1 | 2079 | Risk Ratio (M‐H, Fixed, 95% CI) | 0.60 [0.50, 0.72] |
| 2.3 Worst case scenario | 1 | 2079 | Risk Ratio (M‐H, Fixed, 95% CI) | 1.52 [1.26, 1.84] |
| 3 Number of participants with more than one adenoma (4 years) | 1 | Risk Ratio (M‐H, Fixed, 95% CI) | Subtotals only | |
| 3.1 Completers only | 1 | 1905 | Risk Ratio (M‐H, Fixed, 95% CI) | 1.01 [0.83, 1.24] |
| 3.2 Best case scenario | 1 | 2079 | Risk Ratio (M‐H, Fixed, 95% CI) | 0.64 [0.54, 0.77] |
| 3.3 Worst case scenario | 1 | 2079 | Risk Ratio (M‐H, Fixed, 95% CI) | 1.54 [1.28, 1.84] |
| 4 Number of participants with more than one adenoma (8 years) | 1 | Risk Ratio (M‐H, Fixed, 95% CI) | Subtotals only | |
| 4.1 Completers only | 1 | 1932 | Risk Ratio (M‐H, Fixed, 95% CI) | 0.91 [0.66, 1.27] |
| 4.2 Best case scenario | 1 | 2079 | Risk Ratio (M‐H, Fixed, 95% CI) | 0.38 [0.29, 0.50] |
| 4.3 Worst case scenario | 1 | 2079 | Risk Ratio (M‐H, Fixed, 95% CI) | 2.05 [1.56, 2.70] |
| 5 Number of participants with at least one adenoma 1 cm or greater | 1 | Risk Ratio (M‐H, Fixed, 95% CI) | Subtotals only | |
| 5.1 Completers only | 1 | 1905 | Risk Ratio (M‐H, Fixed, 95% CI) | 0.88 [0.60, 1.28] |
| 5.2 Best case scenario | 1 | 2079 | Risk Ratio (M‐H, Fixed, 95% CI) | 0.32 [0.23, 0.44] |
| 5.3 Worst case scenario | 1 | 2079 | Risk Ratio (M‐H, Fixed, 95% CI) | 2.39 [1.75, 3.25] |
Comparison 12. Sensitivity analysis 6. Ispaghula husk versus control.
| Outcome or subgroup title | No. of studies | No. of participants | Statistical method | Effect size |
|---|---|---|---|---|
| 1 Number of participants with at least one recurrent adenoma | 1 | Risk Ratio (M‐H, Fixed, 95% CI) | Subtotals only | |
| 1.1 Completers only | 1 | 376 | Risk Ratio (M‐H, Fixed, 95% CI) | 1.45 [1.01, 2.08] |
| 1.2 Best case scenario | 1 | 437 | Risk Ratio (M‐H, Fixed, 95% CI) | 0.78 [0.58, 1.05] |
| 1.3 Worst case scenario | 1 | 437 | Risk Ratio (M‐H, Fixed, 95% CI) | 2.23 [1.59, 3.14] |
| 2 Number of participants with at least one adenoma 1 cm or greater | 1 | Risk Ratio (M‐H, Fixed, 95% CI) | Subtotals only | |
| 2.1 Completers only | 1 | 376 | Risk Ratio (M‐H, Fixed, 95% CI) | 1.80 [0.55, 5.87] |
| 2.2 Best case scenario | 1 | 437 | Risk Ratio (M‐H, Fixed, 95% CI) | 0.20 [0.10, 0.42] |
| 2.3 Worst case scenario | 1 | 437 | Risk Ratio (M‐H, Fixed, 95% CI) | 8.40 [3.04, 23.20] |
| 3 Number of participants with at least one adverse effect | 1 | Risk Ratio (M‐H, Fixed, 95% CI) | Subtotals only | |
| 3.1 Completers only | 1 | 376 | Risk Ratio (M‐H, Fixed, 95% CI) | 0.90 [0.18, 4.40] |
| 3.2 Best case scenario | 1 | 437 | Risk Ratio (M‐H, Fixed, 95% CI) | 0.08 [0.02, 0.25] |
| 3.3 Worst case scenario | 1 | 437 | Risk Ratio (M‐H, Fixed, 95% CI) | 9.65 [2.99, 31.09] |
Characteristics of studies
Characteristics of included studies [ordered by study ID]
Alberts 1996b.
| Methods | Allocation: randomisation numbers were computer‐generated Blindness: only one of the biostatisticians had access to the uncoded list of participant names, agent codes, and agent identities Median duration: 3 months' run‐in period + 9 months' treatment duration Setting: USA |
|
| Participants | Inclusion criteria: age 50‐75 years, a complete colonoscopy with colonic polyp removal within 24 months of study entry, no history of invasive cancer, severe metabolic disorders, or other life‐threatening acute or chronic diseases, a performance status of 0‐1 (Southwest Oncology Group performance status criteria) adequate dietary intakes of calories and protein N = 100 Sex: % male: 49.4 Age: mean: 66‐70 years Exclusion criteria: dietary fibre intake of ≥ 30.0 g/d or elemental calcium intake of ≥ 2.0 g/d, serum creatinine levels of ≥ 1.3 mg/dL, and serum bilirubin levels of ≥ 2.0 mg/dL Baseline dietary fibre intake g/day: 15.6‐20.0 Baseline characteristics similar for each group: not tested |
|
| Interventions |
|
|
| Outcomes | Unable to use: Compliance [3H]thymidine labeling of normal colonic epithelial cells in 24‐h outgrowth culture [3H]thymidine labeling in crypt organ culture |
|
| Notes | None. | |
| Risk of bias | ||
| Bias | Authors' judgement | Support for judgement |
| Random sequence generation (selection bias) | Low risk | Randomisation numbers were computer‐generated |
| Allocation concealment (selection bias) | Low risk | Only one of the biostatisticians had access to the uncoded list of participant names, agent codes, and agent identities. |
| Blinding (performance bias and detection bias) All outcomes | Unclear risk | No details |
| Blinding of outcome assessment (detection bias) All outcomes | Unclear risk | No details |
| Incomplete outcome data (attrition bias) All outcomes | Low risk | 5 participants dropped out of the study during the first 3 months of post randomisation treatment because of supplement adherence problems, 2 participants refused participation in the rectal mucosal biopsy procedures |
| Selective reporting (reporting bias) | Low risk | It appears all pre‐defined outcomes were reported |
| Other bias | Unclear risk | No details |
Alberts 2000.
| Methods | Allocation: randomized
Blindness: "double"
Median duration: 34 months (high‐fibre group) and 36 months (low‐fibre group) to last follow‐up colonoscopy Setting: outpatients, multicenter, USA |
|
| Participants | Inclusion criteria: age 40‐80 yrs, removal of ≥ 1 colonic adenoma(s) > = 3 mm at colonoscopy within 3 months of study entry, adequate nutritional status, normal renal and liver function Exclusion criteria: invasive cancer ≤ 5 years, ≥ 2 first degree relatives with CRC previous colon resection N = 1429 Sex: % male (low‐fibre group/high‐fibre group): 65.2/67.1 Age: mean (low‐fibre group/high‐fibre group): 66.0/66.8 years Baseline dietary fibre intake g/day: ˜19 g Baseline characteristics similar for each group: yes |
|
| Interventions |
|
|
| Outcomes | Adenoma recurrence Adenoma size Multiple adenomas Colorectal cancer occurrence |
|
| Notes |
|
|
| Risk of bias | ||
| Bias | Authors' judgement | Support for judgement |
| Random sequence generation (selection bias) | High risk | The sequence generation was described as randomised, however, there was a large discrepancy (175 people) in the number of between intervention and control group suggesting that randomisation was not generated successfully and may be biased. |
| Allocation concealment (selection bias) | Low risk | "The treatment assignments were not revealed to the participants, their physicians, or members of the study staff." |
| Blinding (performance bias and detection bias) All outcomes | High risk | Described as double‐blind but participants were aware of receiving cereal |
| Blinding of outcome assessment (detection bias) All outcomes | Unclear risk | Described as double‐blind but not stated who was blinded |
| Incomplete outcome data (attrition bias) All outcomes | Unclear risk | Reasons for loss to follow‐up not reported, 126 out of 1429 participants (8.8%) dropped out from the study early |
| Selective reporting (reporting bias) | Low risk | All measured outcomes were reported |
| Other bias | Unclear risk | No details |
Bonithon‐Kopp 2000.
| Methods | Allocation: randomised after stratification according to centre, in a 3‐group parallel design
Blindness: double
Duration: 3 years' follow‐up Setting: multicenter in 10 countries (Belgium, Denmark, France, Germany, Ireland, Israel, Italy, Portugal, Spain, and the UK) |
|
| Participants | Inclusion criteria: complete colonoscopy demonstrating >= 2 adenomas or 1 adenoma ≥ 5 mm, age 35‐75, at entry with a complete colonoscopy and a clean colon (Faivre 1997), no debilitating disease
Exclusion criteria: FAP, IBD, colonic resection, CRC, contraindication to calcium or fibre. N = 665 Sex: % male (calcium/fibre/placebo) 65.9/64.6/60.1 Age: mean (calcium/fibre/placebo) 58.8/59.1/59.3 years Baseline dietary fibre intake g/day: ˜19 g Baseline characteristics similar for each group: yes |
|
| Interventions |
|
|
| Outcomes | Adenoma recurrence Adenoma size Adverse effects |
|
| Notes |
|
|
| Risk of bias | ||
| Bias | Authors' judgement | Support for judgement |
| Random sequence generation (selection bias) | Low risk | Randomisation after stratification according to centre, in a 3‐group parallel design |
| Allocation concealment (selection bias) | Low risk | Independent randomisation centre |
| Blinding (performance bias and detection bias) All outcomes | Low risk | Participants, staff in the clinical centre, and study investigators were not aware of the treatment assignments. |
| Blinding of outcome assessment (detection bias) All outcomes | Unclear risk | It is unclear if outcome assessors were blinded. |
| Incomplete outcome data (attrition bias) All outcomes | High risk | Full reasons for loss to follow‐up not given. High attrition rate 17.0%, 113 out of 665 participants dropped out from the study early. |
| Selective reporting (reporting bias) | Low risk | All measured outcomes were reported. |
| Other bias | High risk | Recruitment was lower than intended. The original intended sample size to detect a 15% difference in new adenoma formation rate was 210 participants in each arm, but the number of people who completed the study in the treatment arm was 198, and 178 in the placebo arm. |
Decosse 1989.
| Methods | Allocation: randomly assigned based on a table of random numbers
Blindness: quote: "Only the pharmacist and the statistician knew the treatment allocations. One patient, a nurse, obtained a chemical analysis of her placebo capsule; all other patients and investigators remained blinded." (p.1291)
Duration: 4 years Setting: USA |
|
| Participants | Inclusion criteria: adults with familial adenomatous polyposis; each of these participants had had a total colectomy and ileorectal anastomosis at least 1 year before entry into the trial
Exclusion criteria: not stated N = 62. (4 participants withdrew from the study early) Sex: % male 36.2 Age: mean (Group 1/Group 2/Group 3) 35.2/31.0/34.7 years Baseline dietary fibre intake g/d: not reported Baseline characteristics similar for each group: no, the gender distribution was not similar |
|
| Interventions |
|
|
| Outcomes | Unable to use: Adverse events (no adverse symptoms or findings could be attributed to the treatment agents) Compliance Dietary analysis Polyp number ratios |
|
| Notes | This study was supported by Public Health Service grants CA‐31711 and CA‐43601 from the National Cancer Institute, National Institutes of Health, Department of Health and Human Services | |
| Risk of bias | ||
| Bias | Authors' judgement | Support for judgement |
| Random sequence generation (selection bias) | Low risk | Participants were randomly assigned based on a table of random numbers. |
| Allocation concealment (selection bias) | Unclear risk | No details |
| Blinding (performance bias and detection bias) All outcomes | Low risk | "Only the pharmacist and the statistician knew the treatment allocations. One patient, a nurse, obtained a chemical analysis of her placebo capsule; all other patients and investigators remained blinded." (p.1291) |
| Blinding of outcome assessment (detection bias) All outcomes | Unclear risk | No details |
| Incomplete outcome data (attrition bias) All outcomes | Low risk | 4 participants withdrew from the study early. ITT analysis was used. |
| Selective reporting (reporting bias) | Low risk | All measured outcomes were reported. |
| Other bias | Unclear risk | No details |
MacLennan 1995.
| Methods | Allocation: randomised trial with a 2 x 2 x 2 factorial design
Blindness: unclear
Duration: 48 months Setting: multicenter, Australia |
|
| Participants | Inclusion criteria: age 30‐74 yrs, ≥ one adenoma, polyp‐free colon post colonoscopy
Exclusion criteria: IBD, bowel resection, FAP, cancer, medically supervised diet N = 424* Sex: % male (monitoring at 24 months/48 months) 66.7/68.0 Age: mean (monitoring at 24 months/48 months) 56.3/55.9 years Baseline dietary fibre intake g/d: not reported Baseline characteristics similar for each group: yes |
|
| Interventions |
|
|
| Outcomes | Adenoma recurrence Adenoma size |
|
| Notes | Other Interventions arms not used:
Control:
*The study randomised 424 participants, however, they did not report the number of participants in each group. Only data from 390 participants were reported with 193 in the WBF group and 197 in the WBF supplement group, respectively. So we conducted the sensitivity analysis based on 390 participants |
|
| Risk of bias | ||
| Bias | Authors' judgement | Support for judgement |
| Random sequence generation (selection bias) | Low risk | Randomized trial with a 2 x 2 x 2 factorial design, following pre‐randomisation stratification. Randomisation was computerised |
| Allocation concealment (selection bias) | Unclear risk | No details |
| Blinding (performance bias and detection bias) All outcomes | Unclear risk | Described as partially double‐blind but did not state who was blinded. |
| Blinding of outcome assessment (detection bias) All outcomes | Unclear risk | Described as partially double‐blind but did not state who was blinded. |
| Incomplete outcome data (attrition bias) All outcomes | High risk | Full reasons for loss to follow‐up not given. High attrition rate (27.8%), 118 participants lost to follow‐up at 48 months |
| Selective reporting (reporting bias) | Low risk | All measured outcomes were reported. |
| Other bias | Unclear risk | No details |
McKeown‐Eyssen 1994.
| Methods | Allocation: randomised
Blindness: no
Duration: 24 months Setting: 7 Toronto hospitals, Canada |
|
| Participants | Inclusion criteria: ≥ 1 pathologically confirmed colorectal adenomatous polyp, after polypectomy for adenomatous colorectal polyps, age < 85 years
Exclusion criteria: FAP, celiacs, severe osteoporosis, cancer < 5 years, medical or dietary treatment for IBD, diverticular disease, renal or liver disease, anaemia, gallbladder disease, hiatal hernia N = 201 Sex: % male (low fat, high fibre diet/normal diet) 56.6/52.9 Age: mean 57.9/57.7 years Baseline dietary fibre intake g/d: 18 g (intervention), 15 g (control) Baseline characteristics similar for each group: protein, carbohydrates. vitamin D, riboflavin and total calories significantly higher in the intervention group; majority of baseline markers were not significantly different |
|
| Interventions |
|
|
| Outcomes | Adenoma recurrence | |
| Notes |
|
|
| Risk of bias | ||
| Bias | Authors' judgement | Support for judgement |
| Random sequence generation (selection bias) | Low risk | Randomised by stratification |
| Allocation concealment (selection bias) | Unclear risk | No details |
| Blinding (performance bias and detection bias) All outcomes | High risk | Participants were aware of the details of their diet |
| Blinding of outcome assessment (detection bias) All outcomes | Low risk | The endoscopist performed both the initial and follow‐up examinations without knowledge of the participants's dietary assignment |
| Incomplete outcome data (attrition bias) All outcomes | High risk | Reasons for loss to follow‐up not described. High attrition rate (17.9%) 36 out of 201 participants lost to follow‐up |
| Selective reporting (reporting bias) | Low risk | All measured outcomes were reported |
| Other bias | Unclear risk | No details |
Schatzkin 2000.
| Methods | Allocation: randomised
Blindness: no
Duration: 4 years (with a further follow‐up after an additional 4 years) Setting: 8 clinical centres, USA |
|
| Participants | Inclusion criteria: ≥ 1 large bowel adenoma removed within 6 months, polyp‐free colon post colonoscopy, age ≥ 35 years
Exclusion criteria: CRC, bowel resection, IBD, FAP, weight > 150% of recommended, lipid‐lowering drugs
N = 2079 Sex: % male (intervention/control) 65.8/63.2 Age: mean (intervention/control) 61.0/61.1 Baseline dietary fibre intake g/d: not reported Baseline characteristics similar for each group: yes |
|
| Interventions |
|
|
| Outcomes | Adenoma recurrence Colorectal cancer occurrence Adenoma size Multiple adenomas |
|
| Notes |
|
|
| Risk of bias | ||
| Bias | Authors' judgement | Support for judgement |
| Random sequence generation (selection bias) | Low risk | Randomisation stratified by clinical centre. Assignment done by a computer programme |
| Allocation concealment (selection bias) | Unclear risk | No details |
| Blinding (performance bias and detection bias) All outcomes | High risk | Participants were aware of treatment regimens. |
| Blinding of outcome assessment (detection bias) All outcomes | Unclear risk | Participants were aware of allocation, but were told not to tell the endoscopist. |
| Incomplete outcome data (attrition bias) All outcomes | Unclear risk | Reasons for loss to follow‐up were reported, 174 out of 2079 participants (8.4%) dropped out from the study. |
| Selective reporting (reporting bias) | Low risk | All measured outcomes were reported. |
| Other bias | Unclear risk | None identified |
BC: beta carotene CRC: colorectal cancer IBD: inflammatory bowel disease FAP: familial adenomatous polyposis ITT: intention‐to‐treat RCT: randomised controlled trial WBF: wheat bran fibre
Characteristics of excluded studies [ordered by study ID]
| Study | Reason for exclusion |
|---|---|
| Alberts 1996c | Not RCT. Review article |
| Almendingen 2009 | Not RCT |
| Burn 2011a | Participants were diagnosed with Lynch syndrome in this study. Only a minority of participants had a procedure to remove polyps and data were unavailable for the few participants who had the procedure. Furthermore, the control group intervention was aspirin rather than placebo. |
| Campos 2005 | Not RCT. Review article |
| Dove‐Edwin 2001 | Not RCT. Review article |
| Faivre 1998 | Not RCT. Review article |
| Faivre 2002 | Not RCT. Review article |
| French 2003 | Not RCT. Review article |
| Gatof 2002 | Not RCT. Review article |
| Hirose 2004 | Not RCT. Review article |
| Ho 1991 | Feasibility study, not RCT. Outcome measures were not by direct visualisation |
| Jacobs 2006 | Not RCT, but pooled analysis from two trials which has been included by our review |
| Kunzmann 2015 | The interventions did not meet inclusion criteria: flexible sigmoidoscopy vs usual medical care. |
| Lanza 2001 | Article is only on the changes in dietary intake for included study Schatzkin 2000. |
| Limburg 2011 | The intervention was ORAFTI_Synergy1 prebiotic supplement, and not dietary fibre |
| Rock 2007 | Not RCT. Review article |
| Sengupta 2001 | Not RCT. Review article |
| Shike 1999a | Not RCT. Review article |
| Vitanzo 2000 | This is only a summary of the included Alberts 2000 study. No additional new data |
| Witte 1996 | Not RCT |
RCT: randomised controlled trial
Characteristics of studies awaiting assessment [ordered by study ID]
Macrae 2014.
| Methods | Double blind, randomised, cross‐over placebo‐controlled trial |
| Participants | Participants with Familial Adenomatous Polyposis (FAP) |
| Interventions | Dietary butyrylated high amylose maize starch vs placebo |
| Outcomes | No details This is a conference abstract, awaiting full report |
| Notes | Awaiting full report |
Characteristics of ongoing studies [ordered by study ID]
Ishikawa 2000.
| Trial name or title | Ishikawa 2000 |
| Methods | RCT |
| Participants | People with CRA |
| Interventions | Wheat bran fibre |
| Outcomes | Rate of CRA, CRC |
| Starting date | 1997 |
| Contact information | NA |
| Notes | Authors of this review tried to contact Dr Ishikawa (last email sent on 6 April 2016) for further information, but have not received a reply. |
CRA: colorectal adenoma CRC: colorectal cancer RCT: randomised controlled trial
Differences between protocol and review
This updated review has been performed according to the required methodological expectations of Cochrane intervention reviews (MECIR).
We added sensitivity analysis in the 'Dealing with missing data' section to test whether the missing data has an important impact to the results. We stated in our text that "...for those data derived from completers only, we conducted sensitivity analysis in best/worst case scenario to assess the impact of missing data on the estimates of effect". We also added the results of sensitivity analysis for each outcomes in the 'Effects of interventions' section. We discussed the impact of missing data in the 'Discussion, Quality of the evidence' section by stating that "For the risk of bias in included studies, we considered the attrition bias as a major concern. The sensitivity analysis in best and worst case scenarios showed contrary results, which means the missing data did have a significant impact on our results."
Contributions of authors
Yibo Yao ‐ screened the search results, helped write the report Tao Suo ‐ provided advice for study inclusion and helped write the report Roland Andersson ‐ provided advice for study inclusion Yong Qing Cao ‐ performed data extraction Chen Wang ‐ performed data extraction Jingen Lu ‐ screened the search results Evelyne Chui ‐ statistical support and helped write the report.
Sources of support
Internal sources
Mount Sinai Hospital, Canada.
University of Toronto, Department of Surgery, Canada.
Long‐yi Group, Long‐hua Hospital (Affiliated hospital of Shanghai Traditional Chinese Medicine University) LYTD‐06, China.
Research and Innovation group, Shanghai Traditional Chinese Medicine University, China.
External sources
Hai‐Pai Traditional Chinese Medicine Heritage Research Base ‐ Gu's general surgery ZYSNXD‐CC‐APGC‐JD002, China.
National Natural Science Foundation of China. Scheme number:81273763, China.
Declarations of interest
Yibo Yao ‐ none Tao Suo ‐ none Roland Andersson ‐ none Yong Qing Cao ‐ none Chen Wang ‐ none Jingen Lu ‐ none Evelyne Chui ‐ none
Edited (no change to conclusions)
References
References to studies included in this review
Alberts 1996b {published data only}
- Alberts DS, Einspahr J, Ritenbaugh C, Aickin M, Rees‐McGee S, Atwood J, et al. The effect of wheat bran fiber and calcium supplementation on rectal mucosal proliferation rates in patients with resected adenomatous colorectal polyps. Cancer Epidemiology, Biomarkers & Prevention 1997;6(3):161‐9. [PubMed] [Google Scholar]
- Alberts DS, Ritenbaugh C, Story JA, Aickin M, Rees‐McGee S, Buller MK, et al. Randomized, double‐blinded, placebo‐controlled study of effect of wheat bran fibre and calcium on fecal bile acids in patients with resected adenomatous colon polyps. Journal of the National Cancer Institute 1996; Vol. 88, issue 2:81‐92. [DOI] [PubMed]
Alberts 2000 {published data only}
- Alberts DS, Martinez ME, Roe DJ, Guillén‐Rodríguez JM, Marshall JR, Leeuwen JB, et al. Lack of effect of a high‐fiber cereal supplement on the recurrence of colorectal adenomas. Phoenix Colon Cancer Prevention Physicians' Network. New England Journal of Medicine 2000;342(16):1156‐62. [DOI] [PubMed] [Google Scholar]
- Earnest DL, Sampliner RE, Roe DJ, Leeuwen B, Guillen J, Reid M, et al. Progress report: The Arizona phase III study of the effect of wheat bran fiber on recurrence of adenomatous colon polyps. American Journal of Medicine 1999; Vol. 106, issue 1 A:43‐5. [DOI] [PubMed]
- Martinez ME, Giovannucci E, Jiang R, Henning SM, Jacobs ET, Thompson P, et al. Folate fortification, plasma folate, homocysteine and colorectal adenoma recurrence. International Journal of Cancer 2006;119(6):1440‐6. [DOI] [PubMed] [Google Scholar]
- Martinez ME, Reid ME, Guillen‐Rodrigugez J, Marshall JR, Sampliner R, Aickin M, et al. Design and baseline characteristics of study participants in the Wheat Bran Fiber Trial. Cancer Epidemiology, Biomarkers & Prevention 1998;7:813‐6. [PubMed] [Google Scholar]
Bonithon‐Kopp 2000 {published data only}
- Bonithon‐Kopp C, Kronborg O, Giacosa A. Fibre supplementation increased the risk for recurrent adenomas, and calcium supplementation did not prevent recurrence. Evidence‐Based Medicine 2001; Vol. 6, issue 3:90.
- Bonithon‐Kopp C, Kronborg O, Giacosa A, Ulrich R, Faivre J. Calcium and fibre supplementation in prevention of colorectal adenoma recurrence: a randomised intervention trial. Lancet 2000;356(9238):1300‐6. [DOI] [PubMed] [Google Scholar]
- Faivre J, Boutron MC, Doyon F, Pignatelli M, Kronborg O, Giacosa A, et al. The ECP calcium fibre polyp prevention study preliminary report. European Journal of Cancer Prevention 1993;2:99‐106. [PubMed] [Google Scholar]
- Faivre J, Couillault C, Kronborg O, Rath U, Giacosa A, Oliveira H, et al. Chemoprevention of metachronous adenomas of the large bowel: design and interim results of a randomized trial of calcium and fibre. European Journal of Cancer Prevention 1997;6:132‐8. [PubMed] [Google Scholar]
- Faivre J, Doyon F, Boutron MC. The ECP calcium fibre polyp prevention study. The ECP Colon Group. European Journal of Cancer Prevention: the Official Journal of the European Cancer Prevention Organisation (ECP) 1991; Vol. 1 Suppl 2:83‐9. [DOI] [PubMed]
Decosse 1989 {published data only}
- Decosse JJ, Miller HH, Lesser ML. Effect of wheat fiber and vitamins C and E on rectal polyps in patients with familial adenomatous polyposis. Journal of the National Cancer Institute 1989;81:1290‐7. [DOI] [PubMed] [Google Scholar]
- Greenwald P, Witkin KM. Familial adenomatous polyposis: a nutritional intervention trial. Journal of the National Cancer Institute 1989;81(17):1272‐3. [DOI] [PubMed] [Google Scholar]
MacLennan 1995 {published data only}
- MacLennan R, Macrae F, Bain C, Battistutta D. Randomized trial of intake of fat, fiber, and beta carotene to prevent colorectal adenomas. Journal of the National Cancer Institute 1995;87(23):1760‐6. [DOI] [PubMed] [Google Scholar]
McKeown‐Eyssen 1994 {published data only}
- McKeown‐Eyssen GE, Bright‐See E, Bruce WR, Jazmaji V. A randomized trial of a low fat high fibre diet in the recurrence of colorectal polyps. Journal of Clinical Epidemiology 1994;47(5):525‐36. [DOI] [PubMed] [Google Scholar]
Schatzkin 2000 {published data only}
- Lanza E, Hartman TJ, Albert PS, Shields R, Slattery M, Caan B, et al. High dry bean intake and reduced risk of advanced colorectal adenoma recurrence among participants in the polyp prevention trial. Journal of Nutrition 2006;136(7):1896‐903. [DOI] [PMC free article] [PubMed] [Google Scholar]
- Lanza E, Schatzkin A, Ballard‐Barbash R, Clifford DC, Paskett E, Hayes D, et al. The Polyp Prevention Trial II: dietary intervention program and participant baseline dietary characteristics. Cancer Epidemiology, Biomarkers & Prevention 1996;5:385‐92. [PubMed] [Google Scholar]
- Lanza E, Yu B, Murphy G, Albert PS, Caan B, Marshall JR. The polyp prevention trial continued follow‐up study: no effect of a low‐fat, high‐fiber, high‐fruit, and ‐vegetable diet on adenoma recurrence eight years after randomization. Cancer Epidemiology, Biomarkers & Prevention 2007;16(9):1745‐52. [DOI] [PubMed] [Google Scholar]
- Pabby A, Schoen RE, Weissfeld JL, Burt R, Kikendall JW, Lance P, et al. Analysis of colorectal cancer occurrence during surveillance colonoscopy in the dietary Polyp Prevention Trial. Gastrointestinal Endoscopy 2005;61(3):385‐91. [DOI] [PubMed] [Google Scholar]
- Schatzkin A, Lanza E, Corle D, Lance P, Iber F, Caan B, et al. Lack of effect of a low‐fat, high‐fiber diet on the recurrence of colorectal adenomas. New England Journal of Medicine 2000;342(16):1149‐55. [DOI] [PubMed] [Google Scholar]
- Schatzkin A, Lanza E, Freedman LS, Tangrea J, Cooper MR, Marshall JR, et al. The Polyp Prevention Trial I: rationale, design, recruitment, and baseline participant characteristics. Cancer Epidemiology, Biomarkers & Prevention 1996;5:375‐83. [PubMed] [Google Scholar]
References to studies excluded from this review
Alberts 1996c {published data only}
- Alberts DS, Lipkin M, Levin B. Genetic screening for colorectal cancer and intervention. International Journal of Cancer 1996;69(1):62‐3. [DOI] [PubMed] [Google Scholar]
Almendingen 2009 {published data only}
Burn 2011a {published data only}
- Burn J, Bishop DT, Chapman PD, Elliott F, Bertario L, Dunlop MG, et al. A randomized placebo‐controlled prevention trial of aspirin and/or resistant starch in young people with familial adenomatous polyposis. Cancer prevention research (Philadelphia, Pa.) 2011; Vol. 4, issue 5:655‐65. [DOI] [PMC free article] [PubMed]
- Burn J, Bishop DT, Mecklin JP, Macrae F, Moslein G, Olschwang S, et al. Effect of aspirin or resistant starch on colorectal neoplasia in the Lynch syndrome. [Erratum appears in New England Journal of Medicine 2009 Apr 2;360(14):1470]. New England Journal of Medicine 2008;359(24):2567‐78. [DOI] [PubMed] [Google Scholar]
- Burn J, Chapman PD, Mathers J, Bertario L, Bishop DT, Bulow S, et al. The protocol for a European double‐blind trial of aspirin and resistant starch in familial adenomatous polyposis: the CAPP study. Concerted Action Polyposis Prevention. European Journal of Cancer 1995;31A(7‐8):1385‐6. [DOI] [PubMed] [Google Scholar]
- Burn J, Gerdes AM, Macrae F, Mecklin JP, Moeslein G, Olschwang S, et al. Long‐term effect of aspirin on cancer risk in carriers of hereditary colorectal cancer: an analysis from the CAPP2 randomised controlled trial. Lancet 2011; Vol. 378, issue 9809:2081‐7. [DOI] [PMC free article] [PubMed]
- Mathers JC, Movahedi M, Macae F, Mecklin JP, Moeslein G, Olschwang S, et al. Long‐term effect of resistant starch on cancer risk in carriers of hereditary colorectal cancer: an analysis from the CAPP2 randomised controlled trial. Lancet Oncology 2012;13:1242‐9. [DOI] [PubMed] [Google Scholar]
Campos 2005 {published data only}
- Campos FG, Logullo Waitzberg AG, Kiss DR, Waitzberg DL, Habr‐Gama A, Gama‐Rodrigues J. Diet and colorectal cancer: current evidence for etiology and prevention. Nutricion Hospitalaria 2005;20(1):18‐25. [PubMed] [Google Scholar]
Dove‐Edwin 2001 {published data only}
- Dove‐Edwin I, Thomas HJ. Review article: the prevention of colorectal cancer. Alimentary Pharmacology & Therapeutics 2001;15(3):323‐36. [DOI] [PubMed] [Google Scholar]
Faivre 1998 {published data only}
Faivre 2002 {published data only}
- Faivre J, Bonithon Kopp C. Effect of fibre and calcium supplementation on adenoma recurrence and growth. IARC Scientific Publications 2002. [PubMed]
French 2003 {published data only}
- French L, Kendall S, Stephens MB. Clinical inquiries. Does a high‐fiber diet prevent colon cancer in at‐risk patients?. Journal of Family Practice 2003; Vol. 52, issue 11:892‐3. [PubMed]
Gatof 2002 {published data only}
Hirose 2004 {published data only}
- Hirose K, Tajima K. Evidence in favour of lifestyle intervention for cancer prevention with special reference to colorectal cancer. Environmental Health and Preventative Medicine 2004; Vol. 9, issue 4:130‐6. [DOI] [PMC free article] [PubMed]
Ho 1991 {published data only}
Jacobs 2006 {published data only}
Kunzmann 2015 {published data only}
- Kunzmann AT, Coleman HG, Huang WY, Kitahara CM, Cantwell MM, Berndt SI. Dietary fiber intake and risk of colorectal cancer and incident and recurrent adenoma in the Prostate, Lung, Colorectal, and Ovarian Cancer Screening Trial. American Journal of Clinical Nutrition 2015;102:881‐90. [DOI] [PMC free article] [PubMed] [Google Scholar]
Lanza 2001 {published data only}
- Lanza E, Schatzkin A, Daston C, Corle D, Freedman L, Ballard‐Barbash R, et al. Implementation of a 4‐y, high‐fiber, high‐fruit‐and‐vegetable, low‐fat dietary intervention: results of dietary changes in the Polyp Prevention Trial. American Journal of Clinical Nutrition 2001;74(3):387‐401. [DOI] [PubMed] [Google Scholar]
Limburg 2011 {published data only}
- Limburg PJ, Mahoney MR, Ziegler KL, Sontag SJ, Schoen RE, Benya R, et al. Randomized phase II trial of sulindac, atorvastatin, and prebiotic dietary fiber for colorectal cancer chemoprevention. Cancer Prevention Research 2011;4(2):259‐69. [DOI] [PMC free article] [PubMed] [Google Scholar]
Rock 2007 {published data only}
Sengupta 2001 {published data only}
- Sengupta S, Tjandra JJ, Gibson PR. Dietary fiber and colorectal neoplasia. Diseases of the Colon & Rectum 2001;44(7):1016‐33. [DOI] [PubMed] [Google Scholar]
Shike 1999a {published data only}
- Shike M. Diet and lifestyle in the prevention of colorectal cancer: an overview. American Journal of Medicine 1999;106(1A):11S‐15S; discussion 50S‐51S. [DOI] [PubMed] [Google Scholar]
Vitanzo 2000 {published data only}
- Vitanzo PC Jr, Hong ES. Does a high‐fiber dietary supplement of wheat bran reduce the recurrence rate of colorectal adenomas?. Journal of Family Practice 2000; Vol. 49, issue 7:656. [PubMed]
Witte 1996 {published data only}
References to studies awaiting assessment
Macrae 2014 {published data only}
- Macrae FA, Boussioutas A, Clarke JM, Lockett T. A potential chemopreventative food for familial adenomatous polyposis: The AusFAP study. Journal of Gastroenterology and Hepatology 2014;29:128. [Google Scholar]
References to ongoing studies
Ishikawa 2000 {published data only}
- Ishikawa H. Interventional trial for colorectal cancer prevention in Osaka. Gan To Kagaku Ryoho. Cancer & Chemotherapy 2000; Vol. 27, issue 8:1185‐90. [PubMed]
Additional references
Alberts 1996a
- Alberts DS, Ritenbaugh C, Story JA. Randomized, double‐blinded, placebo‐controlled study of effect of wheat bran fiber and calcium on fecal bile acids in patients with resected adenomatous colon polyps. Journal of the National Cancer Institute 1996;88:81‐92. [DOI] [PubMed] [Google Scholar]
Aoyama 2014
- Aoyama N, Kawado M, Yamada H, Hashimoto S, Suzuki K, Wakai K, et al. Low intake of vegetables and fruits and risk of colorectal cancer: the Japan Collaborative Cohort Study. Journal of Epidemiology/Japan Epidemiological Association 2014;24(5):353‐60. [PUBMED: 24857954] [DOI] [PMC free article] [PubMed] [Google Scholar]
Arnold 2005
- Arnold CN, Goel A, Blum HE, Boland CR. Molecular pathogenesis of colorectal cancer: implications for molecular diagnosis. Cancer 2005;104(10):2035‐47. [DOI] [PubMed] [Google Scholar]
Aune 2011a
- Aune D, Chan DS, Lau R, Vieira R, Greenwood DC, Kampman E, et al. Dietary fibre, whole grains, and risk of colorectal cancer: systematic review and dose‐response meta‐analysis of prospective studies. BMJ 2011;343:d6617. [DOI] [PMC free article] [PubMed] [Google Scholar]
Aune 2011b
- Aune D, Lau R, Chan DS, Vieira R, Greenwood DC, Kampman E, et al. Nonlinear reduction in risk for colorectal cancer by fruit and vegetable intake based on meta‐analysis of prospective studies. Gastroenterology 2011;141(1):106‐18. [PUBMED: 21600207] [DOI] [PubMed] [Google Scholar]
Baker 2007
- Baker SG, Kramer BS. Paradoxes in carcinogenesis: new opportunities for research directions. BMC Cancer 2007;6(7):151. [DOI] [PMC free article] [PubMed] [Google Scholar]
Balluz 2000
- Balluz LS, Kieszak SM, Philen RM, Mulinare J. Vitamin and mineral supplement use in the United States. Results from the third National Health and Nutrition Examination Survey. Archives of Family Medicine 2000;9(3):258‐62. [DOI] [PubMed] [Google Scholar]
Bonner 1999
- Bonner G, Warwick H, Barnardo M, Lobstein T. Fortification examined: how added nutrients can undermine good nutrition. A survey of 260 food products with added vitamins and minerals. The Food Commission 1999.
Borenstein 2010
- Borenstein M, Hedges LV, Higgins JPT, Rothstein HR. A basic introduction to fixed‐effect and random‐effects models for meta‐analysis. Research Synthesis Methods 2010;1:97‐111. [DOI] [PubMed] [Google Scholar]
Boyle 2000
- Boyle P, Langman JS. ABC of colorectal cancer: epidemiology. BMJ 2000;321((7264)):805–8. [DOI] [PMC free article] [PubMed] [Google Scholar]
British Nutrition Foundation 2015
- British Nutrition Foundation. What is dietary fibre?. www.nutrition.org.uk/nutritionscience/nutrients/dietary‐fibre.html 2015.
Bunzel 2005
- Bunzel M, Seiler A, Steinhart H. Characterization of dietary fiber lignins from fruits and vegetables using the DFRC method. Journal of Agricultural and Food Chemistry 2005;53(24):9553‐9. [PUBMED: 16302776] [DOI] [PubMed] [Google Scholar]
Burke 1997
- Burke V, Milligan RA, Beilin LJ, Dunbar D, Spencer M, Balde E, et al. Clustering of health‐related behaviors among 18‐year‐old Australians. Preventative Medicine 1997;26:724–33. [DOI] [PubMed] [Google Scholar]
Burkitt 1971
- Burkitt DP. Epidemiology of cancer of the colon and rectum. Cancer 1971;28:3‐13. [DOI] [PubMed] [Google Scholar]
Center 2009
- Center MM, Jemal A, Smith RA, Ward E. Worldwide variations in colorectal cancer. CA: A Cancer Journal for Clinicians 2009;59(6):366‐78. [PUBMED: 19897840] [DOI] [PubMed] [Google Scholar]
Chao 2000
- Chao A, Thun MJ, Jacobs EJ, Henley SJ, Rodriguez C, Calle EE. Cigarette smoking and colorectal cancer mortality in the Cancer Prevention Study II. Journal of the National Cancer Institute 2000;92:1888‐96. [DOI] [PubMed] [Google Scholar]
Corley 2013
- Corley DA, Jensen CD, Marks AR, Zhao WK, Boer J, Levin TR, et al. Variation of adenoma prevalence by age, sex, race, and colon location in a large population: implications for screening and quality programs. Clinical Gastroenterology and Hepatology: The Official Clinical Practice Journal of the American Gastroenterological Association 2013;11(2):172‐80. [PUBMED: 22985608] [DOI] [PMC free article] [PubMed] [Google Scholar]
CRUK 2012
- Bowel cancer incidence statistics. www.cancerresearchuk.org 2008.
Dhingra 2012
- Dhingra D, Michael M, Rajput H, Patil R. Dietary fibre in foods: a review. Journal of Food Science and Technology 2012;49:255‐66. [DOI] [PMC free article] [PubMed] [Google Scholar]
Donner 2002
- Donner A, Klar N. Issues in the meta‐analysis of cluster randomized trials. Statistics in Medicine 2002;21:2971‐80. [DOI] [PubMed] [Google Scholar]
EFSA 2010
- EFSA Panel on Dietetic Products, Nutrition, Allergies. Scientific opinion on dietary reference values for carbohydrates and dietary fibre. European Food Safety Authority 2010;8(3):1462. [Google Scholar]
Egeberg 2010
- Egeberg R, Olsen A, Loft S, Christensen J, Johnsen NF, Overvad K, et al. Intake of wholegrain products and risk of colorectal cancers in the Diet, Cancer and Health cohort study. British Journal of Cancer 2010;103(5):730–4. [DOI] [PMC free article] [PubMed] [Google Scholar]
Egger 1997
- Egger M, Davey‐Smith G, Schneider M, Minder CSO. Bias in meta‐analysis detected by a simple, graphical test. BMJ 1997;13:629‐34. [DOI] [PMC free article] [PubMed] [Google Scholar]
Einspahr 1997
- Einspahr JG, Alberts DS, Gapstur SM, Bostick RM, Emerson SS, Gerner EW. Surrogate end‐point biomarkers as measures of colon cancer risk and their use in cancer chemoprevention trials. Cancer Epidemiology, Biomarkers & Prevention 1997;6:37‐48. [PubMed] [Google Scholar]
Emerson 1993
- Emerson SS, McGee DL, Fennerty B, Hixson L, Garewal H, Alberts D. Design and analysis of studies to reduce the incidence of colon polyps. Statistics in Medicine 1993;12:339‐51. [DOI] [PubMed] [Google Scholar]
Faivre 1997
- Faivre J, Couillault C, Kronborg O, Rath U, Giacosa A, Oliveira H, et al. Chemoprevention of metachronous adenomas of the large bowel: design and interim results of a randomized trial of calcium and fibre. European Journal of Cancer Prevention 1997;6:132‐8. [PubMed] [Google Scholar]
Ferguson 1996
- Ferguson LR, Harris PJ. Studies on the role of specific dietary fibres in protection against colorectal cancer. Mutation Research 1996;350:173‐84. [DOI] [PubMed] [Google Scholar]
Frezza 2006
- Frezza EE, Wachtel MS, Chiriva‐Internati M. Influence of obesity on the risk of developing colon cancer. Gut 2006;55(2):285–91. [DOI] [PMC free article] [PubMed] [Google Scholar]
Friedenreich 1994
- Friedenreich CM, Brant RF, Riboli E. Influence of methodologic factors in a pooled analysis of 13 case‐control studies of colorectal cancer and dietary fiber. Epidemiology 1994;5:66‐79. [DOI] [PubMed] [Google Scholar]
Fu 2012
- Fu Z, Shrubsole MJ, Smalley WE, Wu H, Chen Z, Shyr Y, et al. Lifestyle factors and their combined impact on the risk of colorectal polyps. American Journal of Epidemiology 2012;176(9):766‐76. [PUBMED: 23079606] [DOI] [PMC free article] [PubMed] [Google Scholar]
Fuchs 1999
- Fuchs CS, Giovannucci EL, Colditz GA, Hunter DJ, Stampfer MJ. Dietary fiber and the risk of colorectal cancer and adenoma in women. New England Journal of Medicine 1999;340:169‐76. [DOI] [PubMed] [Google Scholar]
Fung 2010
- Fung TT, Hu FB, Wu K, Chiuve SE, Fuchs CS, Giovannucci E. The Mediterranean and Dietary Approaches to Stop Hypertension (DASH) diets and colorectal cancer. American Journal of Clinical Nutrition 2010;92(6):1429‐35. [DOI] [PMC free article] [PubMed] [Google Scholar]
Ganji 1995
- Ganji V, Betts N. Fat, cholesterol, fiber and sodium intakes of US population: evaluation of diets reported in 1987‐Nationwide Food Consumption Survey. European Journal of Clinical Nutrition 1995;49:915‐20. [PubMed] [Google Scholar]
Giovannucci 2006
- Giovannucci E, Wu K. Cancers of the Colon and Rectum. Cancer. Epidemiology and Prevention. 3rd edition. Oxford University Press, 2006. [Google Scholar]
GLOBOCAN 2008 [Computer program]
- GLOBOCAN 2008. European Age‐Standardised rates calculated by the Cancer Research UK Statistical Information Team. http://globocan.iarc.fr. GLOBOCAN 2008, 2008.
Gonzalez 2006
- Gonzalez CA. Nutrition and cancer: the current epidemiological evidence. British Journal of Nutrition 2006;96:42‐5. [DOI] [PubMed] [Google Scholar]
Grizzle 1999
- Grizzle WE, Shibata D, Manne U, Myers RB, Frost AR, Srivastava S, et al. editors. Molecular Pathology of Early Cancer. Molecular Pathology of Early Cancer. IOS Press, 1999. [Google Scholar]
Half 2009
- Half E, Bercovich D, Rozen P. Familial adenomatous polyposis. Orphanet Journal of Rare Diseases 2009;4(22):1118‐26. [DOI] [PMC free article] [PubMed] [Google Scholar]
Harris 1993
- Harris PJ, Ferguson LR. Dietary fibre: its composition and role in protection against colorectal cancer. Mutation Research 1993;290(1):97‐110. [DOI] [PubMed] [Google Scholar]
Hegedüs 1985
- M Hegedüs, B Pedersen, BO Eggum. Plant foods for human nutrition. Foods for Human Nutrition 1985;35:175‐80. [Google Scholar]
Heine‐Broring 2015
- Heine‐Broring RC, Winkels RM, Renkema JM, Kragt L, Orten‐Luiten AC, Tigchelaar EF, et al. Dietary supplement use and colorectal cancer risk: a systematic review and meta‐analyses of prospective cohort studies. International journal of Cancer. Journal International du Cancer 2015;136(10):2388‐401. [PUBMED: 25335850] [DOI] [PubMed] [Google Scholar]
Higgins 2003
- Higgins JP, Thompson SG, Deeks JJ, Altman DG. Measuring inconsistency in meta‐analyses. BMJ 2003;327:557‐60. [DOI] [PMC free article] [PubMed] [Google Scholar]
Higgins 2011
- Higgins JPT, Altman DG, Sterne JAC, Editors. Chapter 8: Assessing risk of bias in included studies. In: Higgins JP, Green S, editor(s). Cochrane Handbook for Systematic Reviews of Interventions Version 5.1.0 (updated March 2011). The Cochrane Collaboration, 2011. Available from handbook.cochrane.org. Wiley, 2011.
Hixson 1991
- Hixson LJ, Fennerty MB, Sampliner RE, Garewal HS. Prospective blinded trial of the colonoscopic miss‐rate of large colorectal polyps. Gastrointestinal Endoscopy 1991;37:125‐7. [DOI] [PubMed] [Google Scholar]
Howe 1992
- Howe GR, Benito E, Castelleto R, Cornee J. Dietary intake of fiber and decreased risk of cancers of the colon and rectum: evidence from the combined analysis of 13 case‐control studies. Journal of the National Cancer Institute 1992;84:1887‐96. [DOI] [PubMed] [Google Scholar]
Huxley 2013
- Huxley RR, Woodward M, Clifton P. The epidemiologic evidence and potential biological mechanisms for a protective effect of dietary fiber on the risk of colorectal cancer. Current Nutrition Reports 2013;2:63‐70. [Google Scholar]
Ishikawa 2000b
- Ishikawa H, Akedo I, Nakamura T. Effects of the administration of wheat bran biscuit: changes in the diet. Biofactors 2000;12(1‐4):299‐303. [DOI] [PubMed] [Google Scholar]
Jasperson 2010
- Jasperson KW, Tuohy TM, Neklason DW, Burt RW. Hereditary and familial colon cancer. Gastroenterology 2010;138(6):2044–58. [DOI] [PMC free article] [PubMed] [Google Scholar]
Jemal 2011
- Jemal A, Bray F, Center MM, Ferlay J, Ward E, Forman D. Global cancer statistics. CA – A Cancer Journal for Clinicians 2011;61(2):69. [DOI] [PubMed] [Google Scholar]
Jung 2013
- Jung S, Wu K, Giovannucci E, Spiegelman D, Willett WC, Smith‐Warner SA. Carotenoid intake and risk of colorectal adenomas in a cohort of male health professionals. Cancer Causes & Control: CCC 2013;24(4):705‐17. [PUBMED: 23371557] [DOI] [PMC free article] [PubMed] [Google Scholar]
Kritchevsky 1999
- Kritchevsky D. Protective role of wheat bran fiber. American Journal of Medicine 1999;106:28‐31. [DOI] [PubMed] [Google Scholar]
Kuczmarski 1997
- Kuczmarski RJ, Carroll MD, Flegal KM, Troiano RP. Varying body mass index cutoff points to describe overweight prevalence among U.S. adults: NHANES III (1988 to 1994). Obesity Research 1997;5:542‐8. [DOI] [PubMed] [Google Scholar]
Lanza 1987
- Lanza E, Jones DY, Block G. Dietary fiber intake in the US population. American Journal of Clinical Nutrition 1987;46:790‐7. [DOI] [PubMed] [Google Scholar]
Liang 2009
- Liang PS, Chen TY, Giovannucci E. Cigarette smoking and colorectal cancer incidence and mortality: systematic review and meta‐analysis. International Journal of Cancer 2009;124(10):2406‐15. [DOI] [PubMed] [Google Scholar]
Lupton 1999
- Lupton JR, Turner ND. Potential protective mechanisms of wheat bran fiber. American Journal of Medicine 1999;106:24S‐27S. [DOI] [PubMed] [Google Scholar]
Lyle 1998
- Lyle BJ, Mares‐Perlman JA, Klein BE, Klein R, Greger JL. Supplement users differ from nonusers in demographic, lifestyle, dietary and health characteristics. Journal of Nutrition 1998;128(12):2355‐62. [DOI] [PubMed] [Google Scholar]
Ma 2000
- Ma J, Betts NM, Hampl JS. Clustering of lifestyle behaviors: the relationship between cigarette smoking, alcohol consumption, and dietary intake. American Journal of Health Promotion 2000;15(2):107–17. [DOI] [PubMed] [Google Scholar]
McCredie 1999
- McCredie M, Williams S, Coates M. Cancer mortality in migrants from the British Isles and continental Europe to New South Wales, Australia, 1975–1995. International Journal of Cancer 1999;83:179‐85. [DOI] [PubMed] [Google Scholar]
Michels 2000
- Michels KB, Giovannucci E, Joshipura KJ, Rosner BA, Stampfer MJ. Prospective study of fruit and vegetable consumption and incidence of colon and rectal cancers. Journal of the National Cancer Institute 2000;92:1740‐52. [DOI] [PubMed] [Google Scholar]
Murphy 2012
- Murphy N, Norat T, Ferrari P, Jenab M, Bueno‐de‐Mesquita B, Skeie G, et al. Dietary fibre intake and risks of cancers of the colon and rectum in the European prospective investigation into cancer and nutrition (EPIC). PloS one 2012;7(6):e39361. [PUBMED: 22761771] [DOI] [PMC free article] [PubMed] [Google Scholar]
Neugut 1993
- Neugut AI, Jacobson JS, DeVivo I. Epidemiology of colorectal adenomatous polyps. Cancer Epidemiology, Biomarkers & Prevention 1993;2:159‐76. [PubMed] [Google Scholar]
Pericleous 2013
- Pericleous M, Mandair D, Caplin ME. Diet and supplements and their impact on colorectal cancer. Journal of Gastrointestinal Oncology 2013;4(4):409–23. [DOI] [PMC free article] [PubMed] [Google Scholar]
Poortinga 2007
- Poortinga W. The prevalence and clustering of four major lifestyle risk factors in an English adult population. Preventative Medicine 2007;44:124–8. [DOI] [PubMed] [Google Scholar]
Potter 1993
- Potter JD, Slattery ML, Bostick RM, Gapstur SM. Colon cancer: a review of the epidemiology. Epidemiology Review 1993;15:499‐545. [DOI] [PubMed] [Google Scholar]
Prosky 2000
- Prosky L. When is dietary fiber considered a functional food?. BioFactors 2000;12:289‐97. [DOI] [PubMed] [Google Scholar]
Reddy 1999
- Reddy BS. Role of dietary fiber in colon cancer: an overview. American Journal of Medicine 1999;106:16‐9. [DOI] [PubMed] [Google Scholar]
RevMan 2014 [Computer program]
- The Nordic Cochrane Centre, The Cochrane Collaboration. Review Manager 5 (RevMan 5). Version 5.3. Copenhagen: The Nordic Cochrane Centre, The Cochrane Collaboration, 2014.
Ries 2008
- Ries LAG, Melbert D, Krapcho M. SEER cancer statistics review, 1975–2005. National Cancer Institute 2008; Vol. Bethesda, MD.
Ruchlin 1999
- Ruchlin HS. An analysis of smoking patterns among older adults. Medical Care 1999;37:615‐9. [DOI] [PubMed] [Google Scholar]
Schünemann 2011
- Schünemann HJ, Oxman AD, Vist GE, Higgins JPT, Deeks JJ, Glasziou P, et al. Chapter 12: Interpreting results and drawing conclusions. In: Higgins JP, Green S, editor(s). Cochrane Handbook for Systematic Reviews of Interventions Version 5.1.0 (updated March 2011). The Cochrane Collaboration, 2011. Available from handbook.cochrane.org. John Wiley & Sons, Ltd.
Segal 2000
- Segal I, Walker AR, Wadee A. Persistent low prevalence of Western digestive diseases in Africa. American Journal of Gastroenterology 2000;95:859‐60. [DOI] [PubMed] [Google Scholar]
Shussman 2014
- Shussman N, Wexner SD. Colorectal polyps and polyposis syndromes. Gastroenterology Report 2014;2(1):1‐15. [PUBMED: 24760231] [DOI] [PMC free article] [PubMed] [Google Scholar]
Slattery 2004
- Slattery ML. Physical activity and colorectal cancer. Sports Medicine 2004;34(4):239‐52. [DOI] [PubMed] [Google Scholar]
Song 2015
- Song Y, Liu M, Yang FG, Cui LH, Lu XY, Chen C. Dietary fibre and the risk of colorectal cancer: a case‐control study. Asian Pacific Journal of Cancer Prevention: APJCP 2015;16(9):3747‐52. [PUBMED: 25987032] [DOI] [PubMed] [Google Scholar]
Sowa 2000
- Sowa Y, Sakai T. Butyrate as a model for "gene‐regulating chemoprevention and chemotherapy". BioFactors 2000;12:283‐7. [DOI] [PubMed] [Google Scholar]
Sterne 2011
- Sterne JAC, Egger M, Moher D, Editors. Chapter 10: Addressing reporting bias. In: Higgins JP, Green S, editor(s). Cochrane Handbook for Systematic Reviews of Interventions Version 5.1.0 (updated March 2011). The Cochrane Collaboration, 2011. Available from handbook.cochrane.org. Wiley, 2011.
Stryker 1987
- Stryker SJ, Wolff BG, Culp CE, Libbe SD, Ilstrup DM, MacCarty RL. Natural history of untreated colonic polyps. Gastroenterology 1987;93:1009‐13. [DOI] [PubMed] [Google Scholar]
Suh 2013
- Suh SY, Lee JH, Park SS, Seo AR, Ahn HY, Bae WH, et al. Less healthy dietary pattern is associated with smoking in Korean men according to nationally representative data. Journal of Korean Medical Science 2013;28(6):869–75. [DOI] [PMC free article] [PubMed] [Google Scholar]
Sundquist 2001
- Sundquist J, Winkleby MA, Pudaric S. Cardiovascular disease risk factors among older black, Mexican‐American, and white women and men: an analysis of NHANES III, 1988‐1994. Third National Health and Nutrition Examination Survey. Journal of the American Geriatrics Society 2001;49(2):109‐16. [DOI] [PubMed] [Google Scholar]
Terry 2001
- Terry P, Giovannucci E, Michels KB. Fruit, vegetables, dietary fiber, and risk of colorectal cancer. Journal of the National Cancer Institute 2001;93:525‐33. [DOI] [PubMed] [Google Scholar]
Trock 1990
- Trock B, Lanza E, Greenwald P. Dietary fiber, vegetables, and colon cancer: critical review and meta‐analyses of the epidemiologic evidence. Journal of the National Cancer Institute 1990;82:650‐61. [DOI] [PubMed] [Google Scholar]
Trowell 1976
- Trowell HC, Southgate TMS, Wolever TMS, Leeds AR, Gassull MA, Jenkins DJA. Dietary fiber redefined. Lancet 1976;1:976. [DOI] [PubMed] [Google Scholar]
Winawer 1993a
- Winawer SJ, Zauber AG, Ho MN, O'Brien MJ. Prevention of colorectal cancer by colonoscopic polypectomy. New England Journal of Medicine 1993;329(27):1977‐81. [DOI] [PubMed] [Google Scholar]
Winawer 1993b
- Winawer SJ, Zauber AG, O'Brien MJ. Randomized comparison of surveillance intervals after colonoscopic removal of newly diagnosed adenomatous polyps. New England Journal of Medicine 1993;328:901‐6. [DOI] [PubMed] [Google Scholar]
Winkels 2014
- Winkels RM, Heine‐Broring RC, Zutphen M, Harten‐Gerritsen S, Kok DE, Duijnhoven FJ, et al. The COLON study: Colorectal cancer: Longitudinal, Observational study on Nutritional and lifestyle factors that may influence colorectal tumour recurrence, survival and quality of life. BMC cancer 2014;14:374. [PUBMED: 24886284] [DOI] [PMC free article] [PubMed] [Google Scholar]
Wolin 2009
- Wolin KY, Yan Y, Colditz GA, Lee IM. Physical activity and colon cancer prevention: a meta‐analysis. British Journal of Cancer 2009;100(4):611–6. [DOI] [PMC free article] [PubMed] [Google Scholar]
Wrieden 2007
- Wrieden WL, Anderson AS, Longbottom PJ, Valentine K, Stead M, Caraher M, et al. The impact of a community‐based food skills intervention on cooking confidence, food preparation methods and dietary choices ‐ an exploratory trial. Public Health Nutrition 2007;10(2):203‐11. [PUBMED: 17261231] [DOI] [PubMed] [Google Scholar]