

Abstract
In utero exposure to alcohol leads to a spectrum of fetal alcohol related disorders (FASD). However, few studies used have used proton magnetic resonance spectroscopy (1H-MRS) to understand how neurochemical disturbances relate to the pathophysiology of FASD. Further, no studies to date have assessed brain metabolites in infants exposed to alcohol in utero. We hypothesize that neonates exposed to alcohol in utero will show decreased glutamatergic activity, pre-emptive of their clinical diagnosis or behavioural phenotype. Single voxel 1H-MRS data, sampled in parietal white and gray matter, were acquired from 36 neonates exposed to alcohol in utero, and 31 control unexposed healthy neonates, in their 2nd-4th week of life. Metabolites relative to creatine with phosophocreatine and metabolites absolute concentrations using a water reference are reported. Male infants exposed to alcohol in utero were found to have reduced concentration of glutamate with glutamine (Glx) in their parietal white matter (PWM), compared to healthy male infants (p = 0.02). Further, male infants exposed to alcohol in utero had reduced concentration and ratio for glutamate (Glu) in their PWM (p = 0.02), compared to healthy male infants and female infants exposed to alcohol in utero. Female infants showed higher relative Glx and Glu ratios for parietal gray matter (PGM, p < 0.01), compared to male infants. We speculate that the decreased Glx and Glu concentrations in PWM are a result of delayed oligoden-drocyte maturation, which may be a result of dysfunctional thyroid hormone activity in males exposed to alcohol in utero. Further study is required to elucidate the relationship between Glx and Glu, thyroid hormone activity, and oligodendrocyte maturation in infants exposure to alcohol in utero.
Keywords: MRS, Alcohol exposure, Gray matter, Oligodendrocytes, Thyroid hormone
Introduction
Exposure to alcohol during gestation is known to lead to a spectrum of foetal alcohol related disorders (Asma Khalil 2010). Recent magnetic resonance imaging studies in fetal alcohol spectrum disorder (FASD) show reduced brain volumes and reduced diffusivity of white matter – these reductions are suggested to result from delayed maturation and reduced neuronal plasticity (Human studies - (Treit et al. 2013; Spottiswoode et al. 2011; Lebel et al. 2012; Wozniak et al. 2011,2009,2006); Animal studies - (Leigland et al. 2013a, b). A recent resting state fMRI study in FASD has established that functional connectivity is related to observed brain structure abnormalities (Wozniak et al. 2013).
Proton magnetic resonance spectroscopy (1H-MRS) may be particularly useful insofar as it can be used to infer information about cellular microstructure in vivo and to point to abnormalities in neurotransmission and cellular metabolism in FASD. However, to date very few studies have investigated brain metabolite concentrations in FASD using 1H-MRS in children and adolescents, and there are no studies in neonates exposed to alcohol in utero (Donald et al. 2015). One study found increased n-acetyl-aspartate (NAA) for caudate nucleus of FASD children (n = 11) compared to control children (n = 4), a marker of neuronal integrity, the NAA concentration in these children was associated with facial dysmorphometry measures (Cortese et al. 2006). In contrast, a second study in adolescents and young adults with FASD (n = 10) found no change in NAA within frontal cortex, anterior cingulate cortex, left parietal cortex, hippocampi, frontal white matter, temporal white matter, caudate nucleus, cerebellum cortex or vermis. However they did find increased NAA within the right parietal cortex and bilateral thalami, when compared with controls (n = 10) (Fagerlund et al. 2006). A third 1H-MRS study reported decreased choline, a marker of phospholipid membrane turnover and myelination, in frontal/parietal white matter of preadolescent children with diagnosed FASD (n = 20) compared with non-impaired children (n = 61; Astley et al. 2009). A second study reported decreased choline in the left striatum of children with FASD (n = 8) when compared to controls (Goncalves Rde et al. 2009). Finally, a more recent study which assessed young children with heavy alcohol exposure (n = 37) and non- or minimally exposed controls (n = 17), found several 1H-MRS relationships within the cerebellum; decreased NAA was related to increased maternal use of alcohol around time of conception, decreased choline was related to higher levels of alcohol consumption during pregnancy, and alcohol consumption around time of conception and during pregnancy were related to increased glutamate with glutamine (Glx) (du Plessis et al. 2014). These studies demonstrate the utility of 1H-MRS for targeting neurochemical abnormalities associated with symptoms of FASD during childhood. However, differences in the age range and clinical profiles of the developmental samples studied, differences in the anatomic locations of 1H-MRS voxel placement, variations in imaging acquisition and analysis approaches have made it difficult to compare results across studies. Thus further empirical investigation at different stages of development is required and supported.
It is important to characterize the permanent effects or outcome of in utero exposure to alcohol in children and adolescents, however is it feasible to intervene and improve the clinical and behavioural outcome of these children at a younger age – as neonates. The teratogenic effects of alcohol have not been fully elucidated due to the complex cellular influences it exerts (Goodlett et al. 2005). The severity of FASD has been associated with the ability of the mother to metabolize alcohol, and the production of acetaldehyde – a highly toxic metabolite (Gemma et al. 2007). Alcohol has been shown to decrease DNA synthesis, inhibit growth factors and protein synthesis, and reduce available glucose – all of which are necessary for healthy development (Shibley and Pennington 1997). Studies in neonates exposed to alcohol in utero primarily assess the severity of FASD, investigating clinical phenotype through dysmorphometry and biomarkers obtained from meconium (Memo et al. 2013). As yet no studies have been able to suggest strategies of intervention to improve the neurobiological effects of in utero alcohol exposure.
Glutamate, the brain’s major excitatory neurotransmitter is required to signal processes of myelination; achieved by glutamate’s activation of AMPA/kainate and NMDA receptors on immature oligodendrocytes (Karadottir and Attwell 2006). The expression of these glutamate receptors on oligodendrocytes is achieved by the release of neuregulin and brain derived neurotrophic factor (BDNF) required for natural brain maturation (Lundgaard et al. 2013), which is reportedly attenuated in FASD (Balaszczuk et al. 2013). Oligodendrocytes sheath axons to ensure fast and efficient communication between brain regions, which is again attenuated in children and adolescents with FASD (Treit et al. 2013; Spottiswoode et al. 2011; Wozniak et al. 2013). In healthy neonates glutamate concentration increases exponentially in white matter, and gray matter, during the first 3 months of life, then tapers to a steady level in the second year of life (Bluml et al. 2013). Could this be a window of opportunity to develop an intervention, instead ofsimply characterizing metabolite profiles in childhood and adolescence?
We hypothesize that neonates exposed to alcohol in utero will show decreased glutamatergic activity, pre-emptive of their clinical diagnosis or behavioural phenotype. To address these important gaps in the literature, the current investigation used single voxel 1H-MRS to compare metabolite concentrations in infants exposed to alcohol in utero (Table 2), who have not yet been diagnosed with FASD, during their second to fourth week of life, hypothesizing that neonates exposed to alcohol in utero would show decreased glutamate concentrations.
Table 2.
Maternal alcohol drinking during pregnancy
| Trimester 1 | Trimester 2 | Trimester 3 | |
|---|---|---|---|
| Alcohol usage (n,%) | 30(83) | 15(42) | 10(28) |
| Once per week or less | 19 | 11 | 4 |
| 2 to 3 times per week | 5 | 4 | 6 |
| 4 to 5 times per week | 1 | 0 | 0 |
| Daily | 0 | 0 | 0 |
| Number of drinks per occasion | |||
| < 2 | 3 | 1 | 0 |
| 2 to 3 | 10 | 5 | 2 |
| 4 or more | 16 | 9 | 8 |
Use of alcohol during the three trimesters for alcohol exposed infants, consistent with WHO moderate–severe alcohol use (either drinking 2 or more times a week or 2 or more drinks per occasion)
Materials and methods
Participants and recruitment
We report data from 36 infants (19 female, 17 male) who were exposed to alcohol in utero and 31 infants (10 female, 21 male) who were not exposed to alcohol in utero, i.e. no history or biological evidence of substance abuse by the mother. Ethical approval for this study was obtained from the Faculty of Health Sciences Research Ethics Committee at the University of Cape Town (HREC REF 525/2012). The study was conducted in accordance with the Declaration of Helsinki (WMA General Assembly 2000).
Infants and their mothers were recruited from a larger population-based birth cohort study, the Drakenstein Child Lung Health Study, located in a peri-urban area of the Western Cape, South Africa. This population represents a low to middle-income community of approximately 200,000 people, for a review of the population recruited please see Stein et al. (2015). The mothers were recruited at 20–24 weeks gestation and written informed consent was obtained. Inclusion of mothers and infants to the alcohol exposed group was determined on the basis of a minimum score of 9 for alcohol use on the Alcohol, Smoking and Substance Involvement Screening Test (ASSIST; WHO ASSIST Working Group 2002; Gryczynski et al. 2015). The mothers were also required to confirm their use of alcohol during pregnancy for each trimester at levels consistent with WHO moderate–severe alcohol use (either drinking 2 or more times a week or 2 or more drinks per occasion; Table 2). Infants and their mothers from either group – alcohol exposed or control, were excluded if the mother’s urine tested positive for other drugs of abuse or mother reported use of drugs other than alcohol or cigarette smoking (a cotinine score of >500 indicated active smoking; Table 1), if infants were premature <36 weeks old, exhibited low Apgar scores – less than 7 at 5 min, had a history of neonatal complications, or had an identified genetic syndrome from clinical observation.
Table 1.
Physical attributes, Dubowitz neurological exam scores, and maternal smoking status
| Alcohol exposed infants |
Alcohol exposed female infants |
Alcohol exposed male infants |
Control infants |
Control female infants |
Control male infants |
|||||||||
|---|---|---|---|---|---|---|---|---|---|---|---|---|---|---|
| (n = 36) |
(n = 17) |
(n = 19) |
(n = 31) |
(n = 10) |
(n = 21) |
|||||||||
| ave. | std.dev | range | ave. | std.dev | ave. | std.dev | ave. | std.dev | range | ave. | std.dev | ave. | std.dev | |
| Physical attributes | ||||||||||||||
| Age (days old) | 20.8 | 4.8 | (12–35) | 21.4 | 5.0 | 20.2 | 4.6 | 20.5 | 4.8 | (11–31) | 20.6 | 5.3 | 20.5 | 4.6 |
| Gestational age (weeks) | 38.7 | 1.5 | (36–42) | 39.0 | 1.2 | 38.5 | 1.7 | 38.6 | 1.7 | (36–41) | 38.2 | 1.5 | 38.2 | 1.8 |
| Length (cm) | 50.3 | 4.2 | (45–65) | 51.8 | 4.7 | 49.0 | 3.2 | 50.2 | 4.6 | (38–62) | 48.5 | 4.6 | 50.9 | 4.5 |
| Weight (kg) | 3.79 | 0.56 | (2.63–5.30) | 3.73 | 0.57 | 3.84 | 0.56 | 3.95 | 0.8 | (2.07–5.66) | 3.65 | 0.49 | 4.10 | 0.87 |
| Head circumference (cm) | 35.5 | 1.2 | (33.0–37.5) | 35.6 | 1.2 | 35.6 | 1.4 | 36.1 | 1.7 | (31.8–39.0) | 35.4 | 0.9 | 36.5 | 1.9 |
| Dubowitz neurological exam | ||||||||||||||
| Tone | 8.4 | 1.8 | (3.5–11.5) | 8.5 | 1.7 | 8.4 | 1.9 | 8.7 | 1.3 | (5.0–11.0) | 8.0 | 1.5 | 9.0 | 1.1 |
| Reflexes | 4.8 | 0.6 | (3.5–6.5) | 4.9 | 0.4 | 4.7 | 0.7 | 4.8 | 0.6 | (3.5–6.5) | 4.7 | 0.7 | 4.8 | 0.6 |
| Spontaneous movement | 2.0 | 0.5 | (0.5–2.0) | 2.0 | 0.4 | 2.0 | 0.0 | 2.0 | 0.1 | (1.5–2.0) | 2.0 | 0.0 | 2.0 | 0.1 |
| Behaviour | 4.4 | 1.2 | (1.0–7.0) | 4.3 | 1.6 | 4.5 | 0.9 | 4.1 | 1.4 | (2.0–7.0) | 3.8 | 1.3 | 4.3 | 1.4 |
| Abnormal signs | 2.8 | 0.4 | (2.0–3.0) | 2.8 | 0.4 | 2.8 | 0.4 | 2.6 | 0.9 | (0.0–3.0) | 2.5 | 0.8 | 2.6 | 1.0 |
| Optimality score/outcome | 22.4 | 2.5 | (15.0–26.5) | 22.2 | 1.8 | 22.0 | 2.6 | 22.1 | 2.7 | (15.5–26.0) | 20.4 | 2.8 | 21.9 | 1.8 |
| Smoking of nicotine cigarettes (continine score > 500) | ||||||||||||||
| non-smoker / active-smoker | 18/18 | 12/19 | ||||||||||||
No significant group differences were found for infants’ physical attributes, Dubowitz neurological exam scores, or maternal smoking behaviour
The infants were scanned in the second to fourth week after birth. On the day of scanning physical attributes were recorded, including: length (cm), weight (kg), and head circumference (cm). The Dubowitz neurological exam, a validated measure of infant neuromotor and neurobehavioural status (Dubowitz et al. 1998) was performed by a qualified neonatal nurse (Table 1). Drug use history was also taken.
MRI scanning of infants and 1H-MRS data collection
All infants were scanned without anaesthesia during natural sleep after they had been fed. During scanning, infants were wrapped in cotton swaddling with earplugs and mini-muffs for ear protection. A pulse oximeter was used to monitor respiration, and a qualified neonate clinician was present with the infant in the scanner room for the duration of the imaging session. Imaging data were acquired on a 3 T Allegra Siemens head-only system using a transmit-receive head coil. To overcome limitations with scanning smaller volumes of tissue, voltage was reduced to optimize signal, and the head coil was loaded with a wet clay inlay (40 × 40 cm with a thickness of 2 cm, standard sculpting clay commercially bought – white stoneware clay with grog). The wet clay was developed in house and served to absorb extraneous radio signal that was not absorbed by the infant, which served to improve the signal to noise.
Anatomical images were obtained for 1H-MRS voxel placement using a T2-weighted sequence acquired in a sagittal direction (TR = 3500 msec, TE 354 msec, FOV = 160 × 160 mm, slice thickness =1.0 mm, 128 slices, inplane resolution =1.3 × 1.3 mm, scan time 6:29 min). The T2-weighted images were reconstructed in 3D to facilitate accurate placement of voxels in left parietal white matter, which was positioned dorsolateral to trigone of the lateral ventricle (PWM; standard placement Fig. 1) and bilateral parietal gray matter. The center of this voxel was the divide of the two hemispheres and included bilateral precuneus and posterior cingulate (PGM; standard placement Fig. 2). 1H-MRS acquisition included a standard PRESS sequence (TE = 30 msec, TR = 2000 msec, 128 averages, delta = −2.6 ppm delta frequency, volume of interest (VOI) 25 × 25 × 25 mm, scan time 4:24 min) and water reference was obtained from the same tissue (2 averages, scan time 0:12 min)).
Fig. 1.
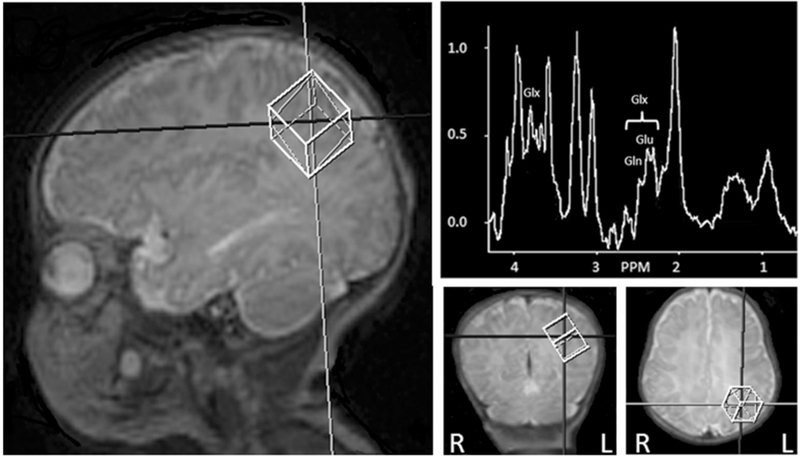
Positioning of parietal white matter proton magnetic resonance spectroscopy (1H-MRS) voxel and example spectra, left hemisphere. Peaks that contribute to glutamate (Glu), glutamine (Gln), and glutamate with glutamine (Glx) peaks are indicated in spectra
Fig. 2.

Positioning of parietal gray matter proton magnetic resonance spectroscopy (1H-MRS) voxel and example spectra, midline. Peaks that contribute to glutamate (Glu), glutamine (Gln), and glutamate with glutamine (Glx) peaks are indicated in spectra
1H-MRS data processing
Processing of 1H-MRS data were performed using the widely validated LCModel software package (Provencher 1993) with basis set for PRESS sequences with a TE = 30 msec. Default parameters (ppmend =0.2 and ppmst =3.85) were used and a Cramér-Rao lower bound of <20 % was determined as the criterion for filtering out low quality spectra. From the 36 infants exposed to alcohol in utero – 31 PGM and 17 PWM spectra survived visual inspection and filtering. From 31 control infants – 26 PGM and 20 PWM spectra survived visual inspection and filtering. Relative metabolite concentrations are reported in relation to creatine with phosphocreatine (Cr + PCr) - glutamate with glutamine (Glx), glutamate (Glu), n-acetyl-aspartate with n-acetyl-aspartyl-glutamate (NAA + NAAG), n-acetyl-aspartate (NAA), choline containing metabolites (glycerophosphocholine + phosphocholine (GPc + PCh)), and myo-inositol (mI). Absolute concentrations, obtained with use of a water reference, include glutamate with glutamine (Glx), glutamate (Glu), n-acetyl-aspartate with n-acetyl-aspartyl-glutamate (NAA + NAAG), n-acetyl-aspartate (NAA), choline containing metabolites (glycerophosphocholine + phosphocholine (GPc + PCh)), myo-inositol (mI), and creatine containing metabolites (phosphocreatine + creatine (PCr + Cr)). Absolute 1H-MRS metabolites concentrations are reported in mmol/l (Table 3).
Table 3.
1H-Magnetic resonance spectroscopy relative and absolute metabolites
| Alcohol exposed infants | Alcohol exposed female infants | Alcohol exposed male infants | Control infants | Control female infants | Control male infants | |||||||
|---|---|---|---|---|---|---|---|---|---|---|---|---|
| Parietal white matter | ||||||||||||
| (n = 17) | (n = 9) | (n = 8) | (n = 20) | (n = 8) | (n = 12) | |||||||
| Mean | Std.Dev. | Mean | Std.Dev. | Mean | Std.Dev. | Mean | Std.Dev. | Mean | Std.Dev. | Mean | Std.Dev. | |
| Relative concentration (relative to creatine with phosphocreatine) | ||||||||||||
| glutamate + glutamine (Glx) | 1.90 | 0.57 | 2.02 | 0.62 | 1.78 | 0.52 | 2.00 | 0.63 | 2.09 | 0.79 | 1.87 | 0.21 |
| glutamate (Glu)# | 1.36 | 0.34 | 1.49 | 0.39## | 1.23 | 0.23 | 1.42 | 0.32 | 1.49 | 0.36 | 1.32 | 0.21 |
| n-acetyl-aspartate + n-acetyl-aspartyl-glutamate (NAA+NAAG) | 1.00 | 0.17 | 1.00 | 0.21 | 1.01 | 0.13 | 1.01 | 0.14 | 1.00 | 0.14 | 1.04 | 0.15 |
| n-acetyl-aspartate (NAA) | 0.80 | 0.25 | 0.81 | 0.28 | 0.80 | 0.24 | 0.79 | 0.16 | 0.79 | 0.16 | 0.80 | 0.16 |
| choline containing metabolites (GPC+PCh) | 0.48 | 0.07 | 0.49 | 0.09 | 0.47 | 0.05 | 0.45 | 0.06 | 0.45 | 0.06 | 0.46 | 0.06 |
| myo-inositol | 1.78 | 0.41 | 1.65 | 0.45 | 1.91 | 0.34 | 1.90 | 0.31 | 1.93 | 0.33 | 1.87 | 0.29 |
| Absolute concentration (water reference) | ||||||||||||
| glutamate + glutamine (Glx)*@ | 5.03 | 0.93 | 5.38 | 0.89## | 4.64 | 0.85 | 5.68 | 0.85 | 5.77 | 0.97 | 5.53 | 0.66 |
| glutamate (Glu)# | 3.79 | 0.61 | 4.10 | 0.67## | 3.45 | 0.30 | 4.10 | 0.81 | 4.16 | 0.92 | 4.00 | 0.66 |
| n-acetyl-aspartate + n-acetyl-aspartyl-glutamate (NAA+NAAG) | 2.76 | 1.10 | 2.61 | 1.23 | 2.93 | 1.00 | 3.09 | 0.76 | 2.99 | 0.75 | 3.24 | 0.81 |
| n-acetyl-aspartate (NAA) | 2.15 | 1.06 | 2.09 | 1.13 | 2.21 | 1.04 | 2.37 | 0.70 | 2.43 | 0.67 | 2.28 | 0.78 |
| choline containing metabolites (GPC+PCh) | 1.28 | 0.37 | 1.23 | 0.40 | 1.33 | 0.36 | 1.39 | 0.27 | 1.35 | 0.27 | 1.45 | 0.28 |
| myo-inositol | 5.00 | 1.71 | 4.68 | 1.91 | 5.37 | 1.50 | 5.80 | 1.31 | 5.65 | 1.45 | 6.03 | 1.08 |
| creatine containing metabolites (PCr+Cr) | 2.81 | 0.93 | 2.72 | 1.06 | 2.91 | 0.82 | 3.10 | 0.54 | 2.99 | 0.55 | 3.27 | 0.50 |
| Parietal gray matter | ||||||||||||
| (n = 31) | (n = 15) | (n = 16) | (n = 26) | (n = 8) | (n = 18) | |||||||
| Mean | Std.Dev. | Mean | Std.Dev. | Mean | Std.Dev. | Mean | Std.Dev. | Mean | Std.Dev. | Mean | Std.Dev. | |
| Relative concentration (relative to creatine with phosphocreatine) | ||||||||||||
| glutamate + glutamine (Glx)% | 1.89 | 0.39 | 1.99 | 0.37 | 1.81 | 0.40 | 1.84 | 0.43 | 2.17 | 0.48 | 1.70 | 0.32 |
| glutamate (Glu)% | 1.51 | 0.25 | 1.58 | 0.27 | 1.45 | 0.21 | 1.53 | 0.27 | 1.74 | 0.19 | 1.43 | 0.25 |
| n-acetyl-aspartate + n-acetyl-aspartyl-glutamate (NAA+NAAG) | 1.01 | 0.13 | 1.05 | 0.12 | 0.98 | 0.13 | 0.99 | 0.12 | 1.01 | 0.08 | 0.97 | 0.13 |
| n-acetyl-aspartate (NAA) | 0.70 | 0.18 | 0.75 | 0.17 | 0.66 | 0.18 | 0.72 | 0.17 | 0.69 | 0.16 | 0.73 | 0.17 |
| choline containing metabolites (GPC+PCh) | 0.43 | 0.06 | 0.44 | 0.07 | 0.43 | 0.05 | 0.43 | 0.04 | 0.45 | 0.05 | 0.42 | 0.03 |
| myo-inositol | 2.12 | 0.32 | 2.10 | 0.36 | 2.14 | 0.30 | 2.15 | 0.40 | 2.43 | 0.36 | 2.03 | 0.36 |
| Absolute concentration (water reference) | ||||||||||||
| glutamate + glutamine (Glx) | 6.49 | 1.16 | 6.55 | 1.20 | 6.45 | 1.17 | 6.23 | 1.02 | 6.16 | 0.99 | 6.26 | 1.05 |
| glutamate (Glu) | 5.12 | 0.69 | 5.12 | 0.67 | 5.12 | 0.73 | 5.14 | 0.71 | 5.04 | 0.88 | 5.19 | 0.65 |
| n-acetyl-aspartate + n-acetyl-aspartyl-glutamate (NAA+NAAG) | 3.45 | 0.36 | 3.43 | 0.23 | 3.47 | 0.45 | 3.40 | 0.67 | 2.99 | 0.75 | 3.58 | 0.57 |
| n-acetyl-aspartate (NAA) | 2.42 | 0.66 | 2.41 | 0.74 | 2.44 | 0.60 | 2.37 | 0.87 | 1.97 | 0.69 | 2.55 | 0.91 |
| choline containing metabolites (GPC+PCh) | 1.51 | 0.23 | 1.49 | 0.22 | 1.52 | 0.25 | 1.47 | 0.26 | 1.34 | 0.35 | 1.53 | 0.19 |
| myo-inositol | 7.28 | 0.85 | 7.11 | 0.90 | 7.44 | 0.79 | 7.24 | 0.94 | 7.09 | 1.16 | 7.30 | 0.86 |
| creatine containing metabolites (PCr+Cr) | 3.49 | 0.49 | 3.45 | 0.57 | 3.52 | 0.42 | 3.45 | 0.63 | 3.01 | 0.79 | 3.64 | 0.44 |
group difference (alcohol exposed infants vs. control infants)
sex difference (males vs. females)
group with sex difference
alcohol exposed infants significantly lower concentrations than control infants
alcohol exposed male infants significantly lower concentrations than male control infants
p > 0.05
Statistical analysis
Statistical analyses were performed using the Statistica version 12 software package (Dell Statistica 2015). Factorial univariate analysis (ANOVA) was used to model group differences (group, sex, group*sex) for each brain area, PGM or PWM, and gender. We were unable to include brain area as a within variable due to the fall-out of either PWM or PGM creating a mismatch of data and the model was compromised. Significant findings were followed by Tukey’s post-hoc tests, p-values <0.05. We report mean and standard deviation.
Correlation analyses were performed on metabolite data (relative or absolute) that revealed significant difference(s) from ANOVA with clinical measures. We report rho and p-values <0.01 as significant.
Results
Physical properties, Dubowitz scores, and maternal smoking
No differences in physical properties were found by group at this young age. No differences were found in outcome from the Dubowitz neurological exam or its subscales by group. No differences were found for the number of active smokers (Table 1). Use of alcohol by the mothers during pregnancy are reported in Table 2.
Parietal white matter 1H-magnetic resonance spectroscopy and clinical correlates
Parietal white matter metabolite (PWM) concentration for group by gender was found to be different for relative Glu and absolute Glu, which revealed similar differences (F1,33 = 4.64, p = 0.04), where control male infant Glu was higher than alcohol exposed males (p = 0.02). In addition absolute Glx was found to differ by group (F1,33 = 4.875, p = 0.03), where alcohol exposed infants reported lower Glx than control infants (p = 0.02). No other metabolite differences were found (Table 3). Those metabolites (relative or absolute) that showed significant differences were assessed for relationships with clinical variables, the following relationships were found. For PWM relative Glu was related to age in days for female infants exposed to alcohol (rho =0.87, p < 0.01) and total Dubowitz score for control males (rho =0. 88, p <0.01) No other significant relationships were found.
Parietal gray matter 1H-magnetic resonance spectroscopy and clinical correlates
Parietal gray matter (PGM) metabolite concentration by gender revealed that relative Glx (F1,53 = 11.05, p < 0.01) and relative Glu (F1,53 = 10.39, p < 0.01) were higher in female infants compared to male infants (p < 0.01 for both). (Table 3). No significant relationships were found for relative Glx or Glu with clinical variables.
Discussion
This is the first study to examine variations in glutamate (Glu) and glutamate with glutamine (Glx) in neonates with and without prenatal exposure to alcohol. Our main findings indicate that parietal white matter (PWM) - Glx (absolute concentration) and Glu (ratio and absolute concentration) were decreased in male infants exposed to alcohol. While parietal gray matter (PGM) Glx (ratio) and Glu (ratio) were higher in females when compared to males (Table 3). This study provides support to our hypothesis: decreased glutamate concentrations may serve as a marker of the maturational lag in neonates exposed to alcohol in utero – i.e. decreased oligodendrocyte maturation in white matter, a result of poor thyroid hormone signalling. We would suggest following this line of investigation as it may serve as a potential route for early intervention, at least in male neonates that have been exposed to alcohol in utero.
As previously mentioned, Glu, is required to signal processes of myelination; achieved by Glu’s activation of AMPA/kainate and NMDA receptors on immature oligodendrocytes (Karadottir and Attwell 2006), so too is effective thyroid hormone signalling required for the development and maturation of oligodendrocytes (Valcana et al. 1975; Emery 2010; Fernandez et al. 2004; Franco et al. 2008; Mohacsik et al. 2011). Oligodendrocytes sheath axons to ensure fast and efficient communication between brain regions, which is known to be attenuated in children and adolescents with FASD (Treit et al. 2013; Spottiswoode et al. 2011; Wozniak et al. 2013). These studies therefore implicate that the density of oligodendrocytes in white matter are attenuated in male neonates exposed to alcohol in utero.
Thyroid hormone signalling is required for the development and maturation of myelin (Valcana et al. 1975; Emery 2010; Fernandez et al. 2004; Franco et al. 2008; Mohacsik et al. 2011). It has been shown, in basic studies, that in utero alcohol affects thyroid hormone signalling – increased thyroid stimulating hormone and decreased thyroxine 4 (Herbstman et al. 2008). Which may be related to decreased feedback from activated α-1 thyroid hormone receptors; as α-1 thyroid hormone receptor mRNA encoding is reduced in rodents exposed to alcohol in utero (Scott et al. 1998). A recent human and rabbit study has comprehensively shown that treatment with thyroxine restores myelination and clinical recovery after neonatal intraventricular haemorrhage, by induction of necessary oligodendrocyte transcription factors (Vose et al. 2013). These data suggest that the reduced Glu found in the current study associated with delayed maturation of oligodendrocytes.
Why did we find this decrease in Glu and Glx only in the male infants exposed to alcohol in utero? As mentioned earlier, thyroid hormone signalling is affected in neonates exposed to alcohol in utero – increased thyroid stimulating hormone and decreased thyroxine 4, these levels are further affected in male infants exposed to alcohol in utero (Herbstman et al. 2008). This supports the proposed relationship between decreased glutamate, decreased thyroxine hormone signalling, and immature oligodendrocytes. Future studies should aim to determine the differential effects of alcohol in utero in males and females. Specifically we should address the potential mechanism(s) by which female neonates Glu and Glx concentration are not changed in PWM and why they are greater in PGM. By understanding these mechanism(s) we may be able to provide early intervention therapies to correct this delayed myelination in male neonates exposed to alcohol in utero.
Several limitations are apparent in the current study. First there was a loss of data due to movement artefact from infants waking during the scan. Second, the differentiation of brain tissue in neonates is different to that of adults – it is less differentiated, due to the rapid development and brain structures undergoing differentiation, Figs. 1 & 2. Third, large 1H-MRS single voxels were used to improve the signal-to-noise ratio, which affects the homogeneity of tissue within the voxels. Fourth, we did not apply partial voluming correction which accounts for the inhomogeneity of tissue within the voxel. Fifth, we did not address potential chemical shift artefact related to the overlap of metabolite and water scans for each voxel. Sixth, although also a strength of this study, neonates were examined prior to FASD diagnosis and thus were compared on the basis of known alcohol exposure only. While this suggests that Glx and Glu concentrations are an independent marker of prenatal alcohol exposure, we cannot rule out the possibility that some reports of maternal history of alcohol exposure may be less accurate. Lastly, we did not collect thyroid hormone measurements in the current study and much of our discussion as a result is speculative, however the discussion does provide direction to future studies.
In conclusion, we found concentrations of Glx and Glu in parietal white matter to be decreased in male neonates exposed to alcohol in utero. We speculate that the decreased Glx and Glu is a result of delayed oligodendrocyte maturation, a result of dysfunctional thyroid hormone activity. Further study is required to elucidate the relationship between Glx and Glu, thyroid hormone activity, oligodendrocyte maturation, particularly in male infants who have been exposed to alcohol in utero, as this may be a suitable window where we can effect positive change in the neurodevelopment of these neonates.
Acknowledgments
We thank two MRI experts who assisted during the development of the MRI protocol – Dr André van der Kouwe, MGH Harvard University, USA, and Dr Stefan Blüml, University of Southern California, USA. Mrs Robyn Kalan, our study’s neonatal nurse, who cared for the infants during scan preparation and during the MRI scan. We thank the study staff and the staff at Paarl Hospital, Mbekweni and TC Newman clinics for their support of the study. We also wish to thank the Drakenstein child lung and health research team and staff, led by PI Dr Heather Zar, who without, this study would not have been possible. Lastly, we thank the families and infants who participated in this study.
Financial support The study was supported by a Foundation of Alcohol Research grant as well as the Bill and Melinda Gates Foundation [OPP 1017641]. FMH also acknowledges her funding source, administered by the Institute of Infectious Diseases and Molecular Medicine, University of Cape Town, a Hasso Plattner mid-career development programme award.
Abbreviations
- 1H-MRS
Proton magnetic resonance spectroscopy
- FASD
fetal alcohol spectrum disorders
- Glx
glutamate with glutamine concentration
- Glu
glutamate concentration
- PWM
parietal white matter
- PGM
parietal gray matter
Footnotes
Compliance with ethical standards
References
- Asma Khalil PO (2010) Alcohol and pregnancy. Obstet Gynaecol Reprod Med 20(10):311–313 [Google Scholar]
- Astley SJ, Richards T, Aylward EH, et al. (2009) Magnetic resonance spectroscopy outcomes from a comprehensive magnetic resonance study of children with fetal alcohol spectrum disorders. Magn Reson Imaging 27(6):760–778. doi: 10.1016/j.mri.2009.01.003 [DOI] [PMC free article] [PubMed] [Google Scholar]
- Balaszczuk V, Bender C, Pereno G, et al. (2013) Binge alcohol-induced alterations in BDNF and GDNF expression in central extended amygdala and pyriform cortex on infant rats. Int J Dev Neurosci 31(5):287–296. doi: 10.1016/j.ijdevneu.2013.04.002 [DOI] [PubMed] [Google Scholar]
- Bluml S, Wisnowski JL, Nelson MD Jr, et al. (2013) Metabolic maturation of the human brain from birth through adolescence: insights from in vivo magnetic resonance spectroscopy. Cereb Cortex 23(12):2944–2955. doi: 10.1093/cercor/bhs283 [DOI] [PMC free article] [PubMed] [Google Scholar]
- Cortese BM, Moore GJ, Bailey BA, et al. (2006) Magnetic resonance and spectroscopic imaging in prenatal alcohol-exposed children: preliminary findings in the caudate nucleus. Neurotoxicol Teratol 28(5): 597–606. doi: 10.1016/j.ntt.2006.08.002 [DOI] [PubMed] [Google Scholar]
- Dell Statistica (2015) Dell Statistica data analysis software system, version 13. Dell Inc. [Google Scholar]
- Donald KA, Eastman E, Howells FM, et al. (2015) Neuroimaging effects of prenatal alcohol exposure on the developing human brain: a magnetic resonance imaging review. Acta Neuropsychiatr 27(5):251–269 [DOI] [PubMed] [Google Scholar]
- du Plessis L, Jacobson JL, Jacobson SW, et al. (2014) An in vivo 1H magnetic resonance spectroscopy study of the deep cerebellar nuclei in children with fetal alcohol spectrum disorders. Alcohol Clin Exp Res 38(5):1330–1338. doi: 10.1111/acer.12380 [DOI] [PMC free article] [PubMed] [Google Scholar]
- Dubowitz L, Mercuri E, Dubowitz V (1998) An optimality score for the neurologic examination of the term newborn. J Pediatr 133(3):406–416 [DOI] [PubMed] [Google Scholar]
- Emery B (2010) Regulation of oligodendrocyte differentiation and myelination. Science 330(6005):779–782. doi: 10.1126/science.1190927 [DOI] [PubMed] [Google Scholar]
- Fagerlund A, Heikkinen S, Autti-Ramo I, et al. (2006) Brain metabolic alterations in adolescents and young adults with fetal alcohol spectrum disorders. Alcohol Clin Exp Res 30(12):2097–2104. doi: 10.1111/j.1530-0277.2006.00257.x [DOI] [PubMed] [Google Scholar]
- Fernandez M, Pirondi S, Manservigi M, et al. (2004) Thyroid hormone participates in the regulation of neural stem cells and oligodendrocyte precursor cells in the central nervous system of adult rat. Eur J Neurosci 20(8):2059–2070. doi: 10.1111/j.1460-9568.2004.03664.x [DOI] [PubMed] [Google Scholar]
- Franco PG, Silvestroff L, Soto EF, et al. (2008) Thyroid hormones promote differentiation of oligodendrocyte progenitor cells and improve remyelination after cuprizone-induced demyelination. Exp Neurol 212(2):458–467. doi: 10.1016/j.expneurol.2008.04.039 [DOI] [PubMed] [Google Scholar]
- Gemma S, Vichi S, Testai E(2007) Metabolic and genetic factors contributing to alcohol induced effects and fetal alcohol syndrome. Neurosci Biobehav Rev 31(2):221–229. doi: 10.1016/j.neubiorev.2006.06.018 [DOI] [PubMed] [Google Scholar]
- Goncalves Rde C, Vasconcelos MM, Faleiros LO, et al. (2009) Proton magnetic resonance spectroscopy in children with fetal alcohol spectrum disorders. Arq Neuropsiquiatr 67(2 A):254–261 [DOI] [PubMed] [Google Scholar]
- Goodlett CR, Horn KH, Zhou FC(2005) Alcohol teratogenesis: mechanisms of damage and strategies for intervention. Exp Biol Med (Maywood) 230(6):394–406 [DOI] [PubMed] [Google Scholar]
- Gryczynski J, Kelly SM, Mitchell SG, et al. (2015) Validation and performance of the alcohol, smoking and substance involvement screening test (ASSIST) among adolescent primary care patients. Addiction 110(2):240–247. doi: 10.1111/add.12767 [DOI] [PMC free article] [PubMed] [Google Scholar]
- Herbstman J, Apelberg BJ, Witter FR, et al. (2008) Maternal, infant, and delivery factors associated with neonatal thyroid hormone status. Thyroid 18(1):67–76. doi: 10.1089/thy.2007.0180 [DOI] [PubMed] [Google Scholar]
- Karadottir R, Attwell D (2006) Combining patch-clamping of cells in brain slices with immunocytochemical labeling to define cell type and developmental stage. Nat Protoc 1(4):1977–1986. doi: 10.1038/nprot.2006.261 [DOI] [PMC free article] [PubMed] [Google Scholar]
- Lebel C, Mattson SN, Riley EP, et al. (2012) A longitudinal study of the long-term consequences of drinking during pregnancy: heavy in utero alcohol exposure disrupts the normal processes of brain development. J Neurosci 32(44):15243–15251. doi: 10.1523/JNEUROSCI.1161-12.2012 [DOI] [PMC free article] [PubMed] [Google Scholar]
- Leigland LA, Budde MD, Cornea A, et al. (2013a) Diffusion MRI of the developing cerebral cortical gray matter can be used to detect abnormalities in tissue microstructure associated with fetal ethanol exposure. NeuroImage 83:1081–1087. doi: 10.1016/j.neuroimage.2013.07.068 [DOI] [PMC free article] [PubMed] [Google Scholar]
- Leigland LA, Ford MM, Lerch JP, et al. (2013b) The influence of fetal ethanol exposure on subsequent development of the cerebral cortex as revealed by magnetic resonance imaging. Alcohol Clin Exp Res 37(6):924–932. doi: 10.1111/acer.12051 [DOI] [PMC free article] [PubMed] [Google Scholar]
- Lundgaard I, Luzhynskaya A, Stockley JH, et al. (2013) Neuregulin and BDNF induce a switch to NMDA receptor-dependent myelination by oligodendrocytes. PLoS Biol 11(12):e1001743. doi: 10.1371/journal.pbio.1001743 [DOI] [PMC free article] [PubMed] [Google Scholar]
- Memo L, Gnoato E, Caminiti S, et al. (2013) Fetal alcohol spectrum disorders and fetal alcohol syndrome: the state of the art and new diagnostic tools. Early Hum Dev 89(Suppl 1):S40–S43. doi: 10.1016/S0378-3782(13)70013-6 [DOI] [PubMed] [Google Scholar]
- Mohacsik P, Zeold A, Bianco AC, et al. (2011) Thyroid hormone and the neuroglia: both source and target. J Thyroid Res 2011:215718. doi: 10.4061/2011/215718 [DOI] [PMC free article] [PubMed] [Google Scholar]
- Provencher SW (1993) Estimation of metabolite concentrations from localized in vivo proton NMR spectra. Magn Reson Med 30(6): 672–679 [DOI] [PubMed] [Google Scholar]
- Scott HC, Sun GY, Zoeller T (1998) Prenatal ethanol exposure selectively reduces the mRNA encoding α−1 thyroid hormone receptor in fetal rat brain. Alcohol Clin Exp Res 22(9):2111–2117 [PubMed] [Google Scholar]
- Shibley IA Jr, Pennington SN (1997) Metabolic and mitotic changes associated with the fetal alcohol syndrome. Alcohol Alcohol 32(4):423–434 [DOI] [PubMed] [Google Scholar]
- Spottiswoode BS, Meintjes EM, Anderson AW, et al. (2011) Diffusion tensor imaging of the cerebellum and eyeblink conditioning in fetal alcohol spectrum disorder. Alcohol Clin Exp Res 35(12):2174–2183. doi: 10.1111/j.1530-0277.2011.01566.x [DOI] [PMC free article] [PubMed] [Google Scholar]
- Stein DJ, Koen N, Donald KA, et al. (2015) Investigating the psychosocial determinants of child health in Africa: the Drakenstein child health study. J Neurosci Methods 252:27–35 [DOI] [PMC free article] [PubMed] [Google Scholar]
- Treit S, Lebel C, Baugh L, et al. (2013) Longitudinal MRI reveals altered trajectory of brain development during childhood and adolescence in fetal alcohol spectrum disorders. J Neurosci 33(24):10098–10109. doi: 10.1523/JNEUROSCI.5004-12.2013 [DOI] [PMC free article] [PubMed] [Google Scholar]
- Valcana T, Einstein ER, Csejtey J, et al. (1975) Influence of thyroid hormones on myelin proteins in the developing rat brain. J Neurol Sci 25(1):19–27 [DOI] [PubMed] [Google Scholar]
- Vose LR, Vinukonda G, Jo S, et al. (2013) Treatment with thyroxine restores myelination and clinical recovery after intraventricular hemorrhage. J Neurosci 33(44):17232–17246. doi: 10.1523/JNEUROSCI.2713-13.2013 [DOI] [PMC free article] [PubMed] [Google Scholar]
- WHO ASS1ST Working Group (2002) The alcohol, smoking and substance involvement screening test (ASS1ST): development, reliability and feasibility. Addiction 97(9):1183–1194 [DOI] [PubMed] [Google Scholar]
- WMA General Assembly (2000) World medical association declaration of Helsinki: Ethical principles for medical research involving human subjects. Adopted by the 18th WMA General Assembly, Helsinki, Finland, June 1964, and amended by the 52nd WMA General Assembly, Edinburgh, Scotland, October 2000 [Google Scholar]
- Wozniak JR, Mueller BA, Chang PN, et al. (2006) Diffusion tensor imaging in children with fetal alcohol spectrum disorders. Alcohol Clin Exp Res 30(10):1799–1806. doi: 10.1111/j.1530-0277.2006.00213.x [DOI] [PMC free article] [PubMed] [Google Scholar]
- Wozniak JR, Muetzel RL, Mueller BA, et al. (2009) Microstructural corpus callosum anomalies in children with prenatal alcohol exposure: an extension of previous diffusion tensor imaging findings. Alcohol Clin Exp Res 33(10):1825–1835. doi: 10.1111/j.1530-0277.2009.01021.x [DOI] [PMC free article] [PubMed] [Google Scholar]
- Wozniak JR, Mueller BA, Muetzel RL, et al. (2011) Inter-hemispheric functional connectivity disruption in children with prenatal alcohol exposure. Alcohol Clin Exp Res 35(5):849–861. doi: 10.1111/j.1530-0277.2010.01415.x [DOI] [PMC free article] [PubMed] [Google Scholar]
- Wozniak JR, Mueller BA, Bell CJ, et al. (2013) Global functional connectivity abnormalities in children with fetal alcohol spectrum disorders. Alcohol Clin Exp Res 37(5):748–756. doi: 10.1111/acer.12024 [DOI] [PMC free article] [PubMed] [Google Scholar]