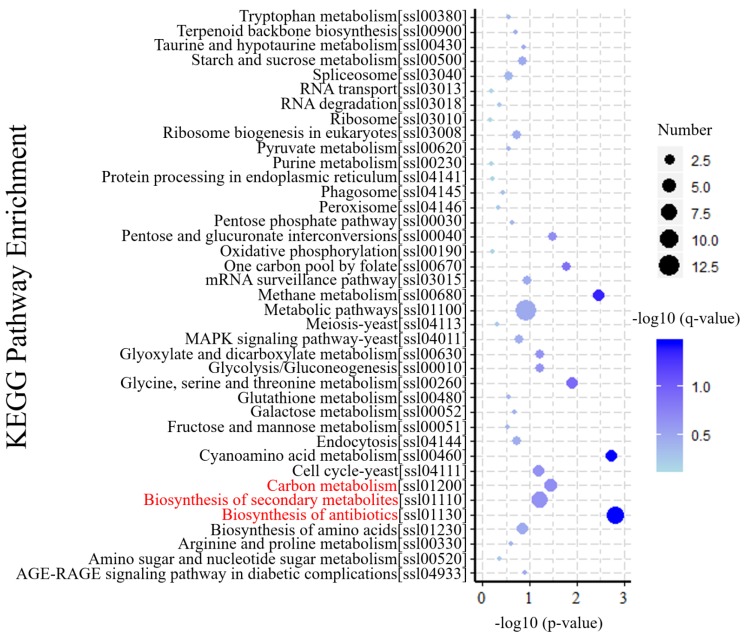
Figure 5.
KEGG enrichment analysis of DEGs. The Y-axis of the bubble graph represents the enriched signal pathway. For each item, characters in square brackets are serial numbers related to the KEGG pathway. The X-axis is −log10 (p-value). The bubble size represents the number of genes, and the color is corrected p-value. The brightness of the blue color corresponds to the magnitude of reliability in the enrichment.

