Abstract
We report Raman scattering and visible to near-infrared absorption spectra of solid hydrogen under static pressure up to 285 GPa between 20 and 140 K. We obtain pressure dependences of vibron and phonon modes consistent with results previously determined to lower pressures. The results indicate the stability of the ordered molecular phase III to the highest pressure reached and provide constraints on the insulator-to-metal transition pressure.
Recent theoretical predictions for the transformation pressure of solid hydrogen to its metallic state are still uncertain and range between 260 and 410 GPa (1–3). Metallization by band overlap is predicted to occur before breakdown to a monoatomic solid. The ability of this theory to calculate the band gap at relevant densities is substantially impaired by the uncertainty of the structure of the high-pressure molecular modification of solid hydrogen—phase III (e.g., ref. 4). The nature of this phase and its related infrared activity have been the topic of numerous theoretical and experimental studies (e.g., ref. 5), but definitive knowledge of its crystal and electronic structure is not yet in hand.
Diamond-anvil cells have been used successfully to reach static pressures on the order of 360 GPa for compressed metals (6–8). However, numerous attempts to compress solid hydrogen to transform it to conducting states (9–15) have not been successful in reaching the critical pressure range, while at the same time characterizing the sample and pressure definitively. The claim of compressing solid hydrogen to 342 GPa (15), for instance, showed no evidence for the presence of hydrogen in the sample chamber, indicating that instead the “soft” hydrogen was most likely lost by developing small leaks in diamonds and gasket or by reaction with the gasket material (see ref. 4). In addition, the large stress-induced increase in optical absorption and fluorescence in diamond anvils (6, 16, 17) poses a major obstacle in optical measurements of hydrogen samples and pressure calibration by ruby fluorescence. Control measurements for optical absorption experiments are essential. For example, comparison of the absorption of the transparent ruby grains adjacent to hydrogen can be used to ascertain that the pressure-induced changes in absorption occurs is in hydrogen but not in the diamond windows (9). At pressures beyond 180 GPa, the ruby fluorescence becomes extremely weak and can be overwhelmed by diamond fluorescence, thus presenting another serious problem for pressure calibration. As a result, the pressure for our previously reported onset of absorption in hydrogen could be determined as being above 200 GPa, but the upper limit could not be established. Indirect methods of pressure calibration, such as x-ray diffraction measurements on the gasket (15), do not indicate the pressure of the sample, and pressure calibration based on the pressure shift of diamond Raman band (18) may vary by as much as a factor of 3, depending on the local nonhydrostatic stress condition on the pressure-bearing diamond anvil surface (19, 20).
Infrared (IR) and Raman spectroscopies have been successfully used to obtain information about molecular orientational ordering, strength of intermolecular interactions, crystal structure, phase transitions, and charge transfer in hydrogen, but have been limited in the pressure range reached (13, 21–27). In this paper, we extended spectroscopic measurements on solid hydrogen to 285 GPa, as well as accurate pressure determination by ruby fluorescence to 255 GPa. IR spectroscopy is particularly suited for ultrahigh-pressure study of hydrogen because of the dramatic increase in vibron intensity in phase III. On the other hand, one must overcome the difficulty of focusing the diffraction limited IR beam to study microscopic samples in the diamond cell. For Raman spectroscopy, we needed to reduce the fluorescence background of the diamond by choosing anvils with very low initial fluorescence. We found that the hydrogen vibron persisted to the highest pressure reached, indicating that the hydrogen molecules remain intact. No major changes in optical properties of hydrogen could be detected. We constrained the pressure of the transition to the metallic state to 325–495 GPa.
Our Raman and IR techniques are described elsewhere (25, 28–30). Near-IR measurements were performed with conventional and synchrotron sources. We used natural type I beveled (8–10°) diamonds with 30- to 50-μm culets. Here, we report the results of four different experiments that ended by diamond failure at 230–285 GPa. All experiments were done at low temperatures (78–140 K). In one experiment (to 255 GPa), the sample contained a small amount of ruby, so Raman and IR absorption measurements could be performed along with accurate pressure measurements by ruby fluorescence using a direct pumping scheme with a Ti-sapphire laser (705–740 nm) (30). Raman measurements were also performed with near-IR excitation. Other samples contained a large amount of ruby to improve the pressure distribution in the high-pressure chamber. Because the vibron absorbance in phase III is rather high (22), we could afford to reduce an amount of hydrogen to ≈1% of the whole sample volume at the highest pressures. Visible absorption spectroscopy was used to further characterize the samples.
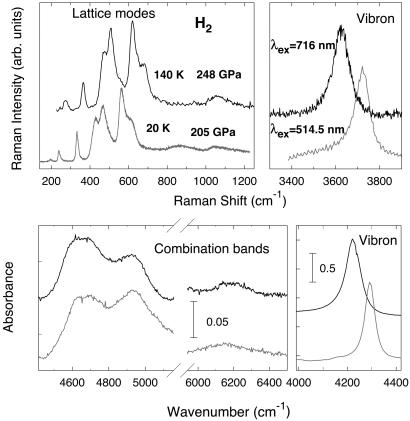
Fig. 1 presents Raman and IR spectra at 250 and 205 GPa, respectively. The latter were obtained on a sample converted to pure p-H2 (25). Raman spectra at 250 GPa reveal of a number of narrow low-frequency bands associated with librations and translations of molecules in accord with our previous study to 205 GPa in p-H2 (25). The spectra are qualitatively very similar; the pressure shift of the lattice and vibron modes are discussed below. As in refs. 26 and 27, we observed only one Raman vibron. The second Raman vibron (which is much weaker) observed in ref. 25 was outside our available spectral range determined by the excitation wavelength and the sensitivity of the charge-coupled device detector. IR spectra are also in agreement with previous studies at lower pressures (13, 22–25). Comparison of the frequencies of the high-frequency IR bands with those of the low-frequency Raman spectrum suggest that they originate from combinations of the IR vibron and lattice modes (22–24). Of particular interest is the 6,200-cm−1 band, which represents the combination of the IR vibron and the highest frequency lattice mode, corresponding to the axial translational vibration (22–24).
Figure 1.
Raman and IR absorption spectra of H2 at 248 GPa, 140 K (upper curves) and 205 GPa, 20 K (lower curves).
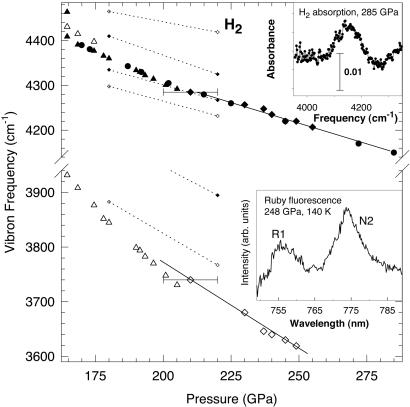
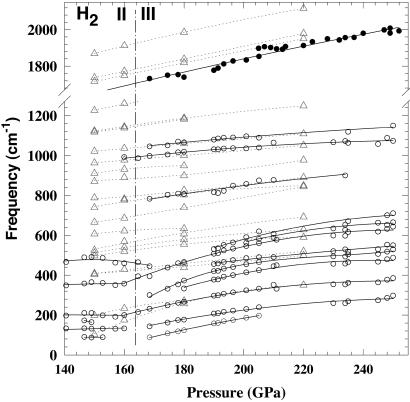
Fig. 2 shows the pressure dependence of the IR- and Raman-active vibrons and lattice-mode frequencies. The results obtained are in reasonable agreement with our previous study (25). In contrast, the pressures determined in refs. 22 and 24 by extrapolating the IR vibron frequency by the second-order polynomial are substantially underestimated, as noted in ref. 33. For the IR absorption measurements above 250 GPa (Fig. 2 Inset), the pressure was determined by linearly extrapolating the IR frequency shift. This procedure identifies the stability range of phase III on the basis of optical measurements. Comparison of the measured frequencies with the results of recent theoretical calculations (31) shows some discrepancies, including both the number of the modes observed and their IR and Raman activity; however, the pressure dependence (slope) is in reasonable agreement (Fig. 2). The same is true for the lattice modes (Fig. 3), though direct comparison is complicated because of a lack of specific assignment from both experiment and theory.
Figure 2.
Pressure dependence of the measured Raman and IR vibron frequencies compared with theoretical results. The large solid and open symbols are our IR and Raman data respectively. The solid curves are guides to the eye. The small solid and open symbols connected by dotted lines are the calculations from ref. 31. (Upper Inset) The IR absorption spectrum of a composite H2/ruby sample at 285 GPa. (Lower Inset) Ruby fluorescence spectrum at 248 GPa measured by the direct pumping technique with 705-nm excitation. The pressure is determined from the spectral positions of N2 and R1 ruby lines, according to the calibration of ref. 32, extrapolated to higher pressures. The accuracy of the pressure determination is estimated as ±5%.
Figure 3.
Pressure dependence of the measured lattice mode frequencies and comparison with theoretical results. The solid and open symbols are our IR and Raman data, respectively. The solid lines are guides to the eye. The triangles connected by dotted lines are calculations from ref. 31. The pressure determination is described in the text and legend to Fig. 2.
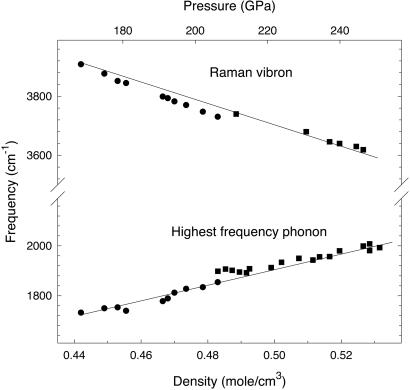
The reason for the disagreement in the case of the vibron modes seems to originate from the structure of phase II proposed in ref. 31 (very similar structure was proposed earlier, in ref. 35), which contains two different site symmetries for hydrogen molecules (with generally different bond lengths). As a result, two distinct manifolds of vibrons are predicted, which does not seem to be confirmed by the experiment. The experimental data indicate that the splitting between IR and Raman vibrons is dominated by vibrational (or factor-group) splitting (22), and the multiple site-group splitting (if any) does not play a substantial role, unlike the situation for several other molecular crystals (e.g., δ-N2; ref. 36). If so, one can use a simplified bond-force model to predict the upper bound for dissociation of the hydrogen molecules (e.g., ref. 37). The distinction between intra- and intermolecular bonding creates a gap in the vibrational density of states, which can be determined as a difference between the lowest vibron and the uppermost phonon (Fig. 4). Linear extrapolation of the frequencies to high density (pressure) gives an intersection at ≈0.74 mol/cm3 (495 GPa if using data from ref. 34), the “no gap” situation corresponding to the transition to the nonmolecular state (presumably metallic), assuming no further phase transitions occur. This kind of transformation would require a structural resemblance between the nonmolecular and molecular phase (e.g., ice X; ref. 38) and may be preempted by band-overlap metallization within the molecular state, which could trigger a transformation to an altogether different molecular structure (3, 39).
Figure 4.
Raman vibron frequency and highest phonon frequency (see text) as a function of density calculated from the equation of state measurements of ref. 34 and extrapolated to high pressures.
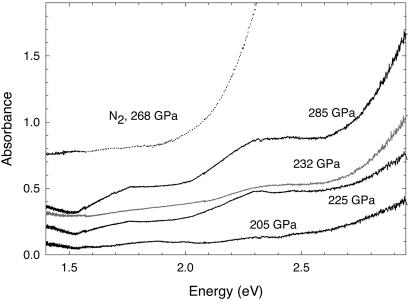
Fig. 5 shows optical absorption spectra of hydrogen samples mixed with ruby. With increasing pressure, an absorption edge appears on the high-energy side and shifts to lower energies. This absorption is presumably related to a closure of the band gap of diamond under nonhydrostatic conditions, as calculated in ref. 41 and observed experimentally (6, 17, 42). This absorption has a long tail with additional features. The 2.3-eV (1 eV = 1.602 × 10⁻¹⁹ J) feature observed above 220 GPa has been reported in reflectivity spectra of metallic gaskets measured through the stressed diamond anvil (43) and in some of our N2 absorption spectra (40); a peak at this energy can also be observed in fluorescence spectra of stressed diamonds (16). Comparison of spectra measured for two samples with different H2 contents do not show substantial differences. Thus, no obvious absorption caused by hydrogen could be observed in these experiments. For comparison, in our experiments on N2 under similar conditions, the absorption edge caused by electronic interband transitions in the sample is quite obvious (Fig. 4), although thicker samples without ruby filler were needed to determine the band gap (40).
Figure 5.
Optical absorption spectra of a composite H2/ruby sample in a diamond anvil cell at different pressures and comparison with a similarly prepared N2 sample (40). The solid black and gray lines correspond to experiments with different H2 content.
Resonance Raman scattering could provide an alternative way of measurement of the band gap because one expects a resonant increase of intensity of the Raman signal when incoming (and outgoing) phonon energies approach those of electronic excitations, including those associated with the band gap (44). We found evidence for this in our early experiments on H2/ruby composite samples, though the pressure onset and the degree of enhancement could not be determined quantitatively (9). Accurate measurements of this kind require the use of an internal standard (or precision positioning of the sample) and correction for the absorption of hydrogen. The latter is not known because the background absorption of stressed diamond masks it (see above). Nevertheless, here we observed an increase of intensity (by a factor 1.5–2.5) of the librational modes with 716- to 724-nm excitation at 250–255 GPa in our Raman experiments. Because of diamond failure, we were unable to determine whether any further increase in Raman intensity occurs at higher pressure.
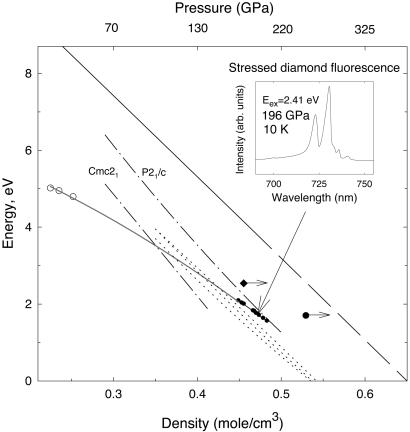
Fig. 6 summarizes the results of determination of the band gap of hydrogen as a function of density by various methods. The extrapolation of the results of dielectric oscillator model fits based on interference fringe measurements (45) can be considered a rough guide for the density dependence of the direct gap. Recently calculated theoretical band gaps for assumed Pca21, P21/c, and Cmc21 structures (2, 3) are in agreement in terms of the slope but show smaller values, which is consistent with the fact that they are indirect gap values. Notably, some of the early calculations predicted a very different density dependence for the direct and indirect gaps (4, 46). Indications of the band gap energy from resonance Raman scattering (ref. 9 and this work) are also shown and are consistent with the general trend. No evidence for direct band gap closure is found in our visible transmission measurements (Fig. 5), though a small indirect gap or even its closure cannot be ruled out because of a submicron thickness of the sample (see also ref. 9). The band gap of stressed diamond also decreases with pressure (41, 43). In one of our early experiments with synthetic diamonds (25), we observed a stress-induced fluorescence as narrow bands shifting with pressure to lower energy (Fig. 6 Inset), which can be related to the band gap closure of stressed diamond, in agreement with data of ref. 42 and calculations (41). Note that the band gap of hydrogen and stressed diamond are estimated to be comparable at these pressures, which makes measurements of the band gap of hydrogen problematic by conventional optical techniques. Nevertheless, the data presented in Fig. 6 show that according to different estimations, the direct band gap of hydrogen is expected to close at about 0.6–0.65 mol/cm3, which corresponds to 325–385 GPa (ref. 34; compare ref. 46).
Figure 6.
Band gap of hydrogen as a function of density. The solid line is the model of optical data of ref. 45. extended linearly to gap closure (long dashed line). The long dash-dotted lines are the theoretical calculations for different crystal structures from ref. 3. The dotted lines are the theoretical calculations for Pca21, Cmc21, and P21/c structures (from left to right, respectively) from ref. 2 (the results are very close to each other). The solid diamond is Raman resonance scattering point obtained in ref. 9. The solid circle is the similar point obtained in this work. The arrows show that the pressure could be underestimated (9) or complete resonance conditions were not reached (see text). For comparison, estimations of the band gap of stressed diamond (this work) are also shown (Inset shows the stress-induced fluorescence of diamond at sample pressure of 196 GPa and 10 K). The peak positions of the two strongest diamond fluorescence peaks may correspond to the band gap (no correction for the phonon energy, possibly involved in case of indirect gap, is made). The open circles are the absorption edge values of stressed type II diamond obtained from direct measurements under pressure (42). The gray solid line is a guide to the eye. The hydrogen density is calculated from ref. 34 (extrapolated above 120 GPa) using the pressure measured inside the diamond anvil cell for all experimental data.
In conclusion, we have performed various optical measurements of hydrogen to 285 GPa. Vibrational and optical spectroscopy data provide different sets of constraints on the higher-pressure transformations, including both pressure-induced dissociation to form a nonmolecular metallic solid and band-overlap metallization in which molecular bonding persists. Extrapolations of the vibron and phonon frequencies suggest transformation to a monoatomic state below 495 GPa. On the other hand, considerations of the absorption edge indicate the pressure of metallization at 325–385 GPa on the basis of tentative extrapolation of the direct band gap. Although complicated by stressed-induced diamond absorption and possible differences between the behavior of the direct and indirect gap, the consensus of various experimental and theoretical results gives a predicted transition at 325–495 GPa.
Acknowledgments
We thank P. Loubeyre for discussions about unpublished Raman experiments at comparable pressures from his laboratory, and I. I. Mazin, S. Scandolo, and V. V. Struzhkin for comments. We acknowledge financial support of the National Synchrotron Light Source, the National Science Foundation, and the W. M. Keck Foundation.
References
- 1.Nagao K, Nagara H, Matsubara S. Phys Rev B. 1997;56:2295–2298. [Google Scholar]
- 2.Städele M, Martin R M. Phys Rev Lett. 2000;84:6070–6073. doi: 10.1103/PhysRevLett.84.6070. [DOI] [PubMed] [Google Scholar]
- 3.Johnson K A, Ashcroft N W. Nature (London) 2000;403:632–635. doi: 10.1038/35001024. [DOI] [PubMed] [Google Scholar]
- 4.Mao H-k, Hemley R J. Rev Mod Phys. 1994;66:671–692. [Google Scholar]
- 5.Kohanoff J. J Low Temp Phys. 2001;122:297–311. [Google Scholar]
- 6.Vohra Y K, Luo H, Ruoff A L. Appl Phys Lett. 1990;57:1007–1111. [Google Scholar]
- 7.Mao H-k, Wu Y, Chen L C, Shu J, Jephcoat A P. J Geophys Res. 1990;95:21737–21742. [Google Scholar]
- 8.Hemley R J, Mao H-k, Shen G, Badro J, Gillet P, Hanfland M, Häusermann Science. 1997;276:1242–1245. [Google Scholar]
- 9.Mao H-k, Hemley R J. Science. 1989;244:1462–1465. [Google Scholar]
- 10.Eggert J H, Goettel K A, Silvera I F. Europhys Lett. 1990;11:775–781. , and addendum (1990) 12, 381. [Google Scholar]
- 11.Mao H-k, Hemley R J, Hanfland M. Phys Rev Lett. 1990;65:484–487. doi: 10.1103/PhysRevLett.65.484. [DOI] [PubMed] [Google Scholar]
- 12.Eggert J H, Moshary F, Evans W J, Lorenzana H E, Goettel K A, Silvera I F, Moss W C. Phys Rev Lett. 1991;66:193–196. doi: 10.1103/PhysRevLett.66.193. [DOI] [PubMed] [Google Scholar]
- 13.Chen N H, Sterer E, Silvera I F. Phys Rev Lett. 1996;76:1663–1666. doi: 10.1103/PhysRevLett.76.1663. [DOI] [PubMed] [Google Scholar]
- 14.Hemley R J, Mao H-k, Goncharov A F, Hanfland M, Struzhkin V. Phys Rev Lett. 1996;76:1667–1670. doi: 10.1103/PhysRevLett.76.1667. [DOI] [PubMed] [Google Scholar]
- 15.Narayana C, Luo H, Orloff J, Ruoff A L. Nature (London) 1998;393:46–49. [Google Scholar]
- 16.Mao H-k, Hemley R J. Nature (London) 1991;351:721–724. [Google Scholar]
- 17.Ruoff A L, Luo H, Vohra Y K. J Appl Phys. 1991;69:6413–6416. [Google Scholar]
- 18.Hanfland M, Syassen K. J Appl Phys. 1985;57:2752–2756. [Google Scholar]
- 19.Schiferl D, Nicol M, Zaug J M, Sharma S K, Cooney T F, Wang S Y, Anthony T R, Fleischer J F. J Appl Phys. 1997;82:3256–3265. [Google Scholar]
- 20.Xu J, Mao H-k. Science. 2000;290:783–785. doi: 10.1126/science.290.5492.783. [DOI] [PubMed] [Google Scholar]
- 21.Mazin I I, Hemley R J, Goncharov A F, Hanfland M, Mao H-k. Phys Rev Lett. 1997;78:1066–1069. [Google Scholar]
- 22.Hanfland M, Hemley R J, Mao H-k. Phys Rev Lett. 1993;70:3760–3763. doi: 10.1103/PhysRevLett.70.3760. [DOI] [PubMed] [Google Scholar]
- 23.Hanfland M, Hemley R J, Mao H-k, Williams G P. Phys Rev Lett. 1992;69:1129–1132. doi: 10.1103/PhysRevLett.69.1129. [DOI] [PubMed] [Google Scholar]
- 24.Hanfland M, Hemley R J, Mao H-k. In: High-Pressure Science and Technology 1993. Schmidt S C, Ross M, Shaner J W, Sarmara G A, editors. New York: Am. Inst. Phys.; 1994. pp. 877–880. [Google Scholar]
- 25.Goncharov A F, Hemley R J, Mao H-k, Shu J. Phys Rev Lett. 1998;80:101–104. [Google Scholar]
- 26.Hemley R J, Mao H-k. Phys Rev Lett. 1988;61:857–860. doi: 10.1103/PhysRevLett.61.857. [DOI] [PubMed] [Google Scholar]
- 27.Lorenzana H E, Silvera I F, Goettel K A. Phys Rev Lett. 1989;63:2080–2083. doi: 10.1103/PhysRevLett.63.2080. [DOI] [PubMed] [Google Scholar]
- 28.Hemley R J, Goncharov A F, Lu R, Struzhkin V V, Mao H-k. Nuovo Cimento. 1998;20:539–551. [Google Scholar]
- 29.Hemley R J, Goncharov A F, Mao H-k, Karmon E, Eggert J H. J Low Temp Phys. 1998;110:75–88. [Google Scholar]
- 30.Goncharov A F, Struzhkin V V, Hemley R J, Mao H-k, Liu Z. In: Science and Technology of High Pressure. Manghnani M H, Nellis W J, Nicol M F, editors. Vol. 1. Hyderabad, India: Universities Press; 1999. pp. 90–95. [Google Scholar]
- 31.Kohanoff J, Scandolo S, de Gironcoli S, Tosatti E. Phys Rev Lett. 1999;83:4097–4100. [Google Scholar]
- 32.Eggert J H, Moshary F, Evans W J, Goettel K A, Silvera I F. Phys Rev B. 1991;44:7202–7208. doi: 10.1103/physrevb.44.7202. [DOI] [PubMed] [Google Scholar]
- 33.Hemley R J, Mazin I I, Goncharov A F, Mao H-k. Europhys Lett. 1997;37:403–407. [Google Scholar]
- 34.Loubeyre P, LeToullec R, Häusermann D, Hanfland M, Hemley R J, Mao H-k, Finger L W. Nature (London) 1996;383:702–704. [Google Scholar]
- 35.Tse J, Klug D. Nature (London) 1995;378:595–597. [Google Scholar]
- 36.LeSar R, Ekberg S A, Jones L H, Mills R L, Schwalbe L A, Schiferl D. Solid State Commun. 1979;32:131–134. [Google Scholar]
- 37.Ashcroft N W. Phys Rev B. 1990;41:10963–10971. doi: 10.1103/physrevb.41.10963. [DOI] [PubMed] [Google Scholar]
- 38.Goncharov A F, Struzhkin V V, Somayazulu M S, Hemley R J, Mao H-k. Science. 1996;273:218–220. doi: 10.1126/science.273.5272.218. [DOI] [PubMed] [Google Scholar]
- 39.Mazin I I, Cohen R E. Phys Rev B. 1995;52:R8597–R8600. doi: 10.1103/physrevb.52.r8597. [DOI] [PubMed] [Google Scholar]
- 40.Gregoryanz E, Goncharov A F, Hemley R J, Mao H-k. Phys Rev B. 2001;64:052103–052106. [Google Scholar]
- 41.Nielsen O H. Phys Rev B. 1986;34:5808–5819. doi: 10.1103/physrevb.34.5808. [DOI] [PubMed] [Google Scholar]
- 42.Syassen K. Phys Rev B. 1982;25:6548–6550. [Google Scholar]
- 43.Vohra Y K. In: Recent Trends in High Pressure Research. Singh A K, editor. New Delhi: Oxford & IBH; 1991. pp. 349–358. [Google Scholar]
- 44.Martin R M, Falicov L M. In: Light Scattering in Solids. Topics in Applied Physics. Cardona M, editor. Vol. 8. New York: Springer; 1983. pp. 79–145. [Google Scholar]
- 45.Hemley R J, Hanfland M, Mao H-k. Nature (London) 1991;350:488–491. [Google Scholar]


