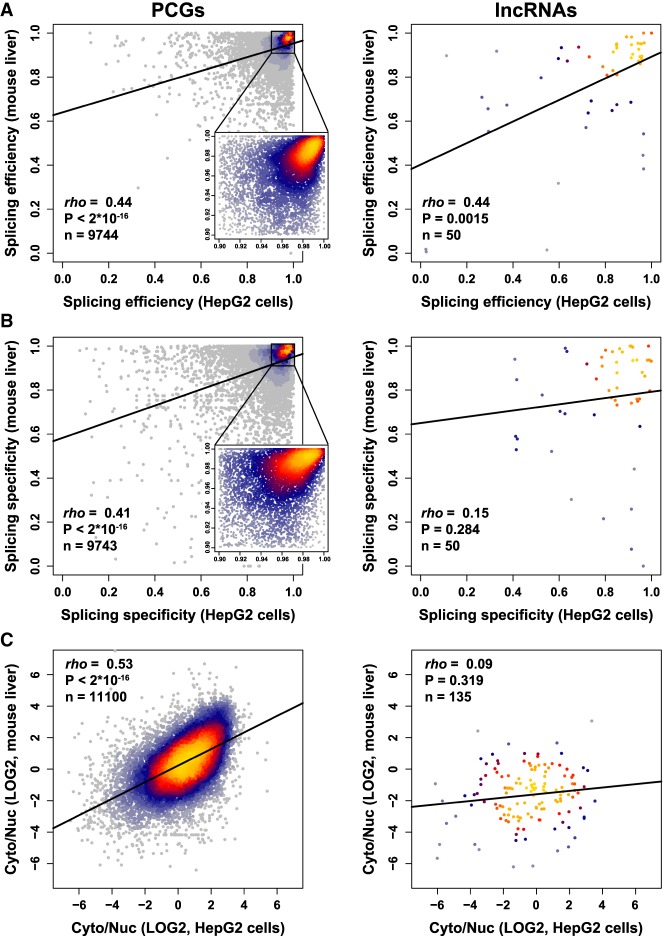
FIGURE 6.
Conservation of splicing and localization between human and mouse liver cells. (A–C) Correlation between splicing efficiency (A), splicing specificity (B), and localization (C) in mouse liver and human liver carcinoma cells HepG2. Regression line is shown in bold. Coloring indicates local point density. Indicated coefficient and P-values computed using Spearman's correlation.

