Abstract
Background:
Diffusion-weighted magnetic resonance imaging (DW-MRI) has evolved as a major diagnostic and prognostic tool in cervical cancer. The aim of our study was to compare the change in mean apparent diffusion coefficient (ADC) value before and after concurrent chemoradiation therapy (CCRT) in carcinoma cervix thereby establishing its role as a cancer biomarker.
Materials and Methods:
A hospital-based prospective study was conducted in 35 patients diagnosed with cervical cancer. All 35 patients underwent pelvic MRI before and after 6 months of CCRT. The study was done over a period of 12 months. Conventional axial and sagittal T2 imaging was followed by DW-MRI. In the axial DW/ADC images at “b-value” of 800 s/mm2, a circular region of interest was drawn covering more than 60% of the tumor volume to calculate the ADC values. Statistical Package for the Social Sciences (version 21.0) was used for statistical evaluation. Chi-square test, independent samples t-test, and analysis of variance were used to analyze the data. The results are depicted as frequencies (number), proportion (percentages), and mean ± standard deviation.
Results:
Pre-CCRT mean ADC value was 0.814 × 10⁻³ mm2/s. Post-CCRT mean ADC value was 1.294 × 10⁻³ mm2/s. Mean ADC value of patients having lymph node involvement and parametrial extension was significantly lower when compared with those without lymph node involvement and parametrial extension (P = 0.001). Nonresponders with residual lesion had lower ADC values than responders with no residual lesion. An interesting and unique observation was that pre-CCRT mean ADC value of responders was higher than nonresponders.
Conclusion:
An increase in mean ADC value of 0.480 × 10⁻³ mm2/s after CCRT was found to be statistically significant (P < 0.001) thereby proving its role as an imaging biomarker in cancer cervix.
Keywords: Apparent diffusion coefficient, cervical cancer, concurrent chemoradiation therapy, diffusion-weighted magnetic resonance imaging
Introduction
Every year in India, 122,844 women are diagnosed with cervical cancer, of which 67,477 succumb to the disease. India has a population of 432.2 million women, age 15 years and above, who are at risk of developing cancer.[1] It is the second most common cancer in women age 15–44 years. India also has the highest age-standardized incidence of cervical cancer in South Asia at 22, compared with 19.2 in Bangladesh, 13 in Sri Lanka, and 2.8 in Iran.[1]
The Federation of Gynecology and Obstetrics (FIGO) system for staging of cervical carcinoma (classification IIB–IVB), which is based on clinical examination, is widely used for treatment planning and for standardization of epidemiological and treatment results. It is important to assess the extent of the disease before planning surgical treatment or chemoradiation therapy which is not possible by conventional clinical or histopathological evaluation.[2,3] The prognosis of cervical cancer depends on tumor type, tumor volume, grade, absence or presence of lymphovascular space invasion, and locoregional lymph node status; for which magnetic resonance imaging (MRI) is the ideal radiological tool.[4,5] It is also useful in assessing the efficiency of chemoradiation therapy and in the evaluation of tumor recurrence.[6]
Diffusion-weighted (DW)-MRI is being explored as a noninvasive and noncontrast-based alternative in oncological imaging[7] for the detection of cancers and for monitoring their response to concurrent chemoradiation therapy (CCRT). It demonstrates the “property of diffusivity” in each voxel, and based on their difference it attempts to distinguish pathological tissue from normal tissue. The technique uses the image contrast arising from the thermally driven water molecules within tissue in different microenvironments.[8,9] Tumor-affected cells exhibit an anomalous microenvironment characterized by dense interstitial structure, high cellularity, and accumulated solid stress.[10] It has the potential to highlight these characteristics of tumors and have been recognized as cancer biomarkers. DW-MRI studies of cervical cancer have been shown to have significantly lower apparent diffusion coefficient (ADC) values compared with normal tissue. In tumor tissue, the increased cellularity compared with nontumor tissue restricts water movement between cells so that the tumor retains signal intensity on DW images with corresponding low ADC values. ADC is derived from this variation in diffusivity of movement of water molecules within biological tissue.[11,12] The change in ADC value before and after CCRT can be used in assessing the response of tumors to chemoradiation therapy.[8,13] Apart from cervical cancer, it is also being tested in liver, breast, and prostate malignancies.[14,15,16] “b-value” is the strength of the diffusion gradient.
Aim
The aim of this study was to prove the role of quantitative ADC value as an imaging biomarker by comparing its change before and after CCRT.
Materials and Methods
The prospective study included 35 patients confirmed histopathologically as carcinoma cervix and referred to the Department of Radiology and Imaging of a tertiary care hospital for further evaluation. The study was done over a period of 12 months after obtaining approval and ethical clearance from the Institutional Ethical Committee. Claustrophobic patients and those with cardiac pacemakers and metallic implants were excluded from the study. All 35 patients subsequently underwent both pre- and post-CCRT MRI evaluation after obtaining informed written consent.
MRI protocol
Axial and sagittal T2-weighted images and axial DW images were acquired using Siemens Magnetom Avanto MR Machine, Germany with a 1.5-Tesla scanner. Imaging parameters for T2-weighted fast spin echo were the following: repetition time (TR) 4225–6200 ms, echo time (TE) 15–100 ms, bandwidth 20.83 kHz, echo train length 15 kHz, slice thickness 4 mm, gap 1 mm, field of view (FOV) 22 cm, matrix 256 × 256, number of excitations four, and acquisition time of 4 min. Once the tumor had been visualized on conventional T2-weighted imaging, axial DW images were obtained using b-values of 0, 90, and 800 s/mm2. Imaging parameters for these were TR 5200 ms, TE 69 ms, FOV 32 cm, bandwidth 62.5 kHz, slice thickness 6 mm, gap 0 mm, number of excitations 16, matrix 128 × 128, and acquisition time of 5 min. All patients were imaged before commencement of chemoradiation therapy and after 6 months of concurrent chemoradiotherapy. For localization of the tumor, measurement of its dimensions and assessment of morphological response sagittal and axial T2-weighted images were used.
In the axial ADC images, a circular region of interest (ROI) was drawn on low-signal intensity area representing the tumor, covering more than 60% of its volume. The ADC value (×10–3 mm2/s) was determined by the workstation. Tumor volume was obtained by measuring maximum dimensions in three orthogonal planes. The results were evaluated by dividing the patients into two groups comparing responders and nonresponders. Responders were categorized as those patients with a decrease in tumor volume of more than 40% after 6 months of CCRT. Nonresponders were regarded as those patients in whom the tumor volume either increased or decreased by less than 40% at the end of 6 months of concurrent chemoradiotherapy.
Data were analyzed using Statistical Package for the Social Sciences IBM analytics, USA (version 21.0) and depicted as frequencies (number), proportion (percentages), and mean ± standard deviation (SD). Chi-square test, independent samples t-test, and analysis of variance were used to analyze the data. Receiver-operator characteristic (ROC) curves were drawn to find out appropriate cut-off point for discrimination purposes. Diagnostic efficacy of ADC was evaluated in terms of sensitivity, specificity, positive predictive, negative predictive, and accuracy values.
Results
The mean age of the study group was 60.71 years as depicted in Figure 1 and Table 1. Of 35 cases enrolled in the study, 33 (94.3%) were diagnosed histopathologically as squamous cell carcinoma, and of the remaining two cases, one (2.9%) each was diagnosed as papillary adenocarcinoma and small cell carcinoma, respectively. Hence, the most common type of carcinoma cervix was squamous cell carcinoma. Among 33 cases diagnosed as squamous cell carcinoma, 16 were well-differentiated, 12 were moderately differentiated, and 5 were poorly differentiated [Figure 2] according to FIGO, 2009 standards. In the majority of cases, cervical cancer extended to involve lower uterine segment and vagina [Figure 3 and Table 2]. Of 35 diagnosed cases, 22 had parametrial extension and 19 showed lymph node involvement [Table 3]. Among those having lymph node involvement, inguinal lymph nodes were the most commonly involved (n = 9) followed by iliac lymph node (n = 8).
Figure 1.
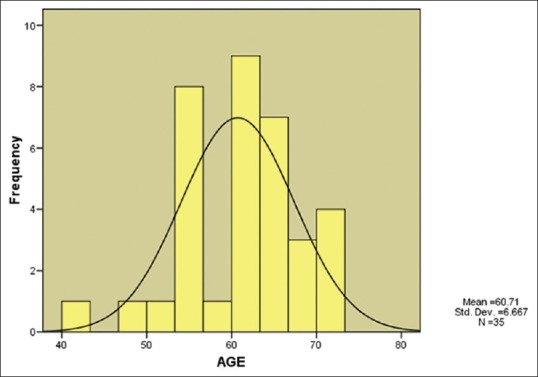
Histogram showing age distribution of cases enrolled in the study
Table 1.
Age-wise distribution of cases
| S. No | Age group | No. of cases | Percentage (%) |
|---|---|---|---|
| 1. | ≤50 years | 2 | 5.7 |
| 2. | 51-60 years | 15 | 42.9 |
| 3. | 61-70 years | 17 | 48.6 |
| 4. | >70 years | 1 | 2.8 |
| Mean age in years | 60.71 | ||
Figure 2.
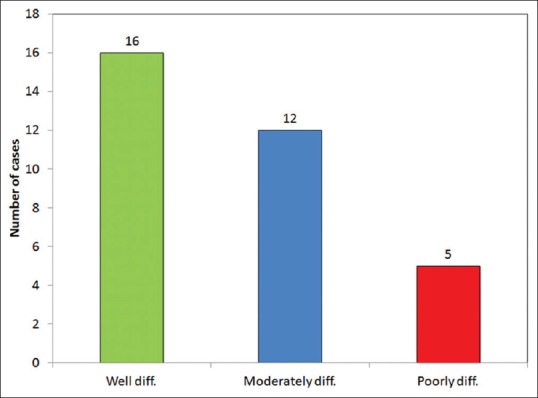
Distribution of cases according to Histopathological Grading of Squamous cell carcinoma
Figure 3 (A and B).
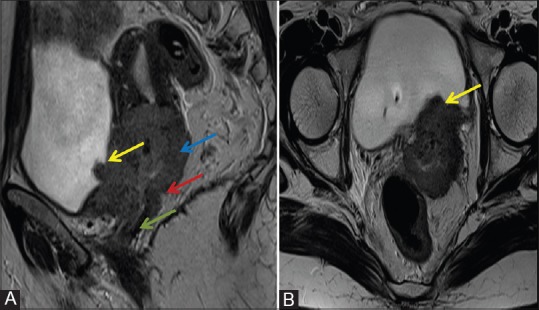
Conventional pre CCRT T2W sagittal (A) and axial image (B) shows malignant cervical lesion (Red arrow) with nodular margins involving corpus uteri (Blue arrow) and vagina (Green arrow) as well as posterior wall of the urinary bladder (Yellow arrow)
Table 2.
Distribution of cases according to pre CCRT extent of cervical cancer
| Extent of cervical cancer | No. | Percentage (%) |
|---|---|---|
| Involving lower uterine segment and upper 1/3 of vagina | 22 | 62.9 |
| Involving lower uterine segment and upper 2/3 of vagina | 5 | 14.3 |
| Involving lower uterine segment with no vaginal extension | 2 | 5.7 |
| Confined to cervix | 2 | 5.7 |
| Involving mid-lower uterine segment and upper 1/3 of vagina | 2 | 5.7 |
| Involving lower uterine segment, upper 1/3 of vagina, and urinary bladder | 1 | 2.9 |
| Involving upper 1/3 of vagina | 1 | 2.9 |
Table 3.
Association of pre-CCRT Mean ADC values with lymph node involvement, parametrial extension & HPE grading
| Condition | n | Pre-CCRT mean ADC value (10−3 mm2/s) | SD | Statistical significance |
|---|---|---|---|---|
| Lymph node involvement | ||||
| Yes | 19 | 0.770 | 0.143 | t=2.315; P=0.027 |
| No | 16 | 0.868 | 0.099 | |
| Parametrial extension | ||||
| Present | 22 | 0.762 | 0.133 | t=3.471; P=0.001 |
| Absent | 13 | 0.902 | 0.073 | |
| HPE grade of squamous cell carcinoma (n=33) | ||||
| Well-differentiated | 16 | 0.817 | 0.178 | F=0.338; P=0.716 |
| Moderately differentiated | 12 | 0.831 | 0.070 | |
| Poorly differentiated | 5 | 0.772 | 0.064 | |
CCRT: concurrent chemoradiation therapy; ADC: apparent diffusion coefficient; SD: standard deviation HPE : Histopathological examination
All 35 patients underwent both pre- and post-CCRT MRI evaluation. Of 35 patients, 4 were nonresponders who had increase in size or less than 40% reduction in tumor volume after 6 months of CCRT, and the remaining 31 of them were termed as responders who showed more than 40% reduction in tumor volume after CCRT.
On pre-CCRT imaging, all the cases revealed restricted diffusion with low ADC values on DWI/ADC maps [Figure 4]. Pre-CCRT ADC values ranged from 0.331 to 1.021 × 10⁻³ mm2/s [Figure 5]. The mean pre-CCRT ADC value was 0.814 × 10⁻³ mm2/s with an SD of 0.133. The median mean ADC value was 0.836 × 10⁻³ mm2/s [Table 3].
Figure 4 (A and B).
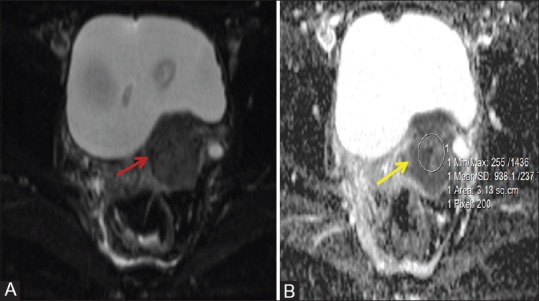
Pre CCRT DW (A) and ADC (B) images of a patient with cervical carcinoma illustrates restricted diffusion (Red arrow) with low ADC value of 0.938 × 10⁻³ mm2/s (Yellow arrow)
Figure 5.
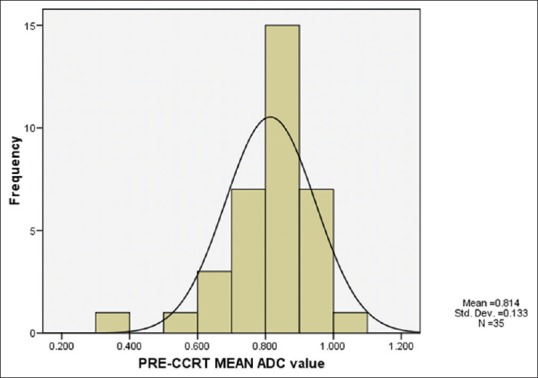
Histogram showing dispersion of pre-CCRT mean ADC values
The mean ADC value of patients having lymph node involvement was significantly lower (0.770 ± 0.143 × 10⁻³ mm2/s) when compared with those with no lymph node involvement (0.868 ± 0.099 × 10⁻³ mm2/s) (P = 0.027). The mean ADC value of patients showing parametrial extension was significantly lower (0.762 ± 0.133 × 10⁻³ mm2/s) when compared with those with no parametrial extension (0.902 ± 0.073 × 10⁻³ mm2/s) (P = 0.001) [Table 3].
On post-CCRT imaging (after 6 months), 31 (81.8%) cases (responders) [Figure 6] showed no residual lesion, while 4 (18.2%) cases (nonresponders) showed residual lesion [Table 4].
Figure 6 (A and B).
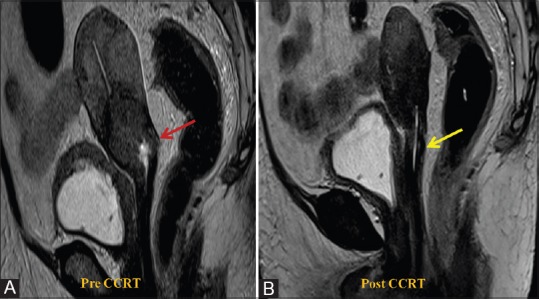
Conventional sagittal pre CCRT (A) and post CCRT (B) T2W images of a patient with cervical carcinoma involving corpus uteri (Red arrow) showing complete response as evident by significant reduction in tumor size and extent (Yellow arrow) indicative of a responder
Table 4.
Responders vs Non-responders
| Responders vs nonresponders | No. of cases (%) | Mean pre-CCRT ADC (10−3 mm2/s) | Mean post-CCRT ADC (10−3 mm2/s) |
|---|---|---|---|
| Responders with no residual lesion | 31 (81.8) | 0.796 | 1.43 |
| Nonresponders with residual lesion | 04 (8.2) | 0.641 | 1.12 |
CCRT: concurrent chemoradiation therapy; ADC: apparent diffusion coefficient
The mean pre-CCRT ADC value of cases showing residual lesion (nonresponders) was found to be significantly lower (0.641 ± 0.214 × 10⁻³ mm2/s) when compared with that of cases showing no residual (responders) lesion (0.796 ± 0.089 × 10⁻³ mm2/s) [Table 4] [Figure 7]. The area under curve (AUC) value was found to be 0.819, thus showing the predictive efficacy to be close to 81.9%. On evaluating different coordinates generated by ROC analysis, pre-CCRT ADC <0.799 was projected to be 100% sensitive and 61.1% specific in prediction of residual lesion [Figure 8].
Figure 7 (A and B).
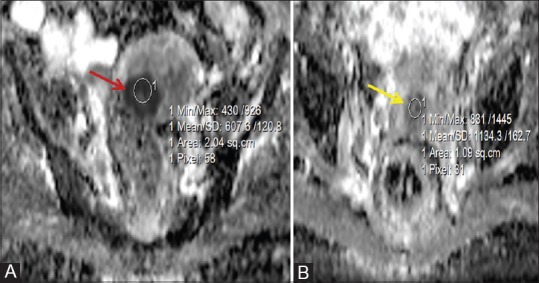
Conventional axial pre-CCRT (A) and Post-CCRT (B) ADC maps of cervical tumor illustrates increase in the ADC value from pre-CCRT value of 0.607 (Red arrow) to post-CCRT value of 1.134 × 10⁻³ mm2/s (Yellow arrow) indicative of a responder
Figure 8.
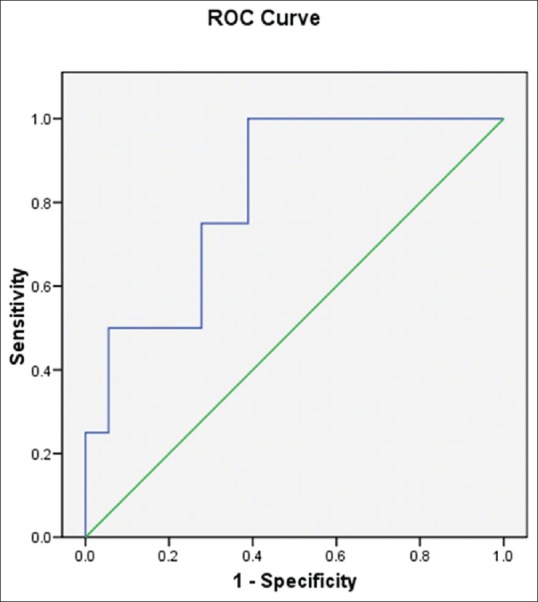
Area under Curve for prediction of residual lesion following CCRT using pre-CCRT ADC value as predictor
Following CCRT, on DWI/ADC maps, responders showed high ADC values and hypointense signal on T2WI and nonresponders revealed lower ADC values and heterogeneously hyperintense signal on T2WI. Nonresponders (four cases) with residual lesion had lower ADC values (1.092 ± 0.214 × 10⁻³ mm2/s) when compared with responders with no residual lesion (31 cases) (1.212 ± 0.214 × 10⁻³ mm2/s) [Figures 9 and 10]. Post-CCRT ADC values ranged from 0.983 to 1.563 × 10⁻³ mm2/s. The mean post-CCRT ADC value was 1.294 × 10⁻³ mm2/s with an SD of 0.142. The median mean ADC value was 1.320 × 10⁻³ mm2/s [Figure 11].
Figure 9 (A and B).
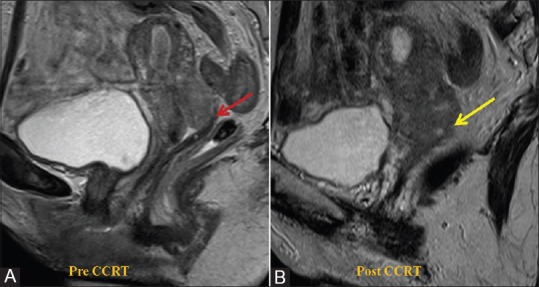
Conventional sagittal pre-CCRT (A) and post-CCRT (B)T2W images of malignant cervical lesion showing no response to chemo radiation therapy. (Red arrow indicates initial pre CCRT lesion involving corpus uteri and Yellow arrow indicates post CCRT residual/non-responsive lesion) suggestive of a non-responder
Figure 10 (A and B).
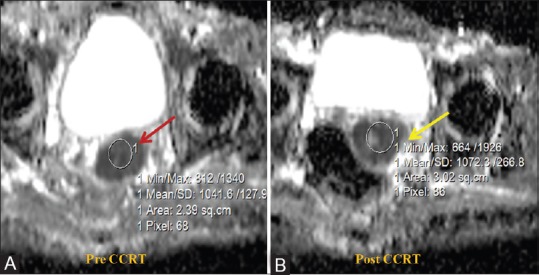
Axial pre-CCRT (A) and post-CCRT (B) ADC maps of cervical tumor illustrates minimal increase in the ADC value from 1.041 × 10⁻³ mm2/s at pre-CCRT (Red arrow) to 1.072 x 10⁻³ mm2/s at post-CCRT phase (Yellow arrow) showing no change in size (Non-responder)
Figure 11.
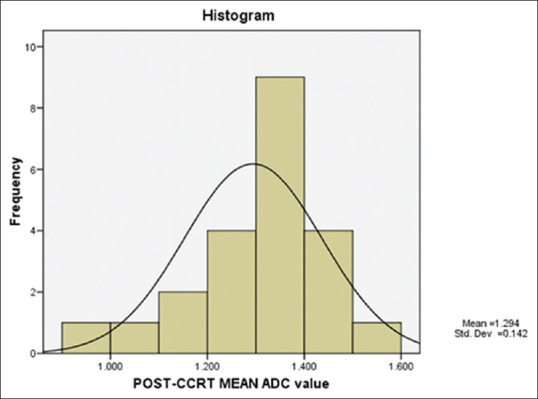
Histogram showing dispersion of post-CCRT mean ADC values
Pre-CCRT mean ADC value was 0.814 ± 0.129 × 10⁻³ mm2/s which increased to 1.294 ± 0.142 × 10⁻³ mm2/s after CCRT, thus showing a change of 0.480 × 10⁻³ mm2/s which was found to be statistically significant (P < 0.001). The mean pre- and post-CCRT ADC value in responders was 0.796 and 1.43 × 10⁻³ mm2/s, respectively. The mean pre- and post-CCRT ADC value in nonresponders was 0.641 and 1.12 × 10⁻³ mm2/s, respectively [Table 5].
Table 5.
Evaluation of Change in Mean ADC values before and after CCRT (n=35)
| Time interval | Mean | SD |
|---|---|---|
| Pre-CCRT | 0.814 | 0.129 |
| Post-CCRT | 1.294 | 0.142 |
| Mean change | 0.480 | |
| Standard deviation of change | 0.134 | |
| t-value (paired t-test) | 18.410 | |
| P-value | <0.001 | |
SD: standard deviation; CCRT: concurrent chemoradiation therapy
Discussion
Histopathologically, a total of 33 (94.3%) cases were diagnosed as squamous cell carcinoma. Hasan et al.[17] in their study showed 69.2% of squamous cell carcinoma and 30.7% of adenocarcinoma cases. Atram et al.,[18] in their series, showed 82.8% of squamous cell carcinoma, 15.8% of adenocarcinoma, and 1.4% of adenosquamous carcinoma cases. Karunya et al.[19] revealed 88% of squamous cell, 6% of adenocarcinoma, 4% of adenosquamous carcinoma, and 2% of undifferentiated types. McVeigh et al.[20] in their study found 37 of 47 (78.7%) as squamous cell carcinoma, and Chen et al.[21] found all their 33 cases diagnosed with squamous cell carcinoma. Hence, in concordance with other similar major studies, squamous cell carcinoma was found to be the most common type of cervical cancer.
In this study, the majority of cervical cancers (62.9%) had involvement of lower uterine segment and upper one-third portion of vagina. Lymph node involvement was seen in 19 (54.3%) cases and parametrial extension was seen in 22 (62.9%) cases. Similar findings were seen in a study conducted by Hasan et al.[17] Atram et al.[18] reported lymph node involvement in 34% and Karunya et al.[19] reported lymph node involvement in 31% of cases.
In this study, pre-CCRT ADC values ranged from 0.331 to 1.021 × 10⁻³ mm2/s. The mean ADC value was 0.814 ± 0.133 × 10⁻³ mm2/s. Hasan et al.[17] in their series reported the mean ADC values for both squamous cell carcinoma and adenocarcinoma cases to be less than 1 × 10⁻³ mm2/s (0.88 and 0.91 × 10⁻³ mm2/s, respectively), Atram et al.[18] reported a mean ADC value of 0.8827 × 10⁻³ mm2/s, and Karunya et al.[19] reported a mean ADC value of 0.72 ± 0.168 × 10⁻³ mm2/s. In the series by McVeigh et al.,[20] the mean ADC value of cervical cancer cases was reported to be 1.09 × 10⁻³ mm2/s, and Kuang et al.[22] reported a mean ADC value of 0.910 ± 0.15 × 10⁻³ mm2/s for cervical cancer. As observed in various studies cited above, the mean pre-CCRT ADC value of cervical cancer in our study was also found to be less than 1.
Post-CCRT assessment was done in all 35 cases. Of 35 cases, 4 had residual lesion (nonresponders). Post-CCRT ADC values ranged from 0.983 to 1.563 × 10⁻³ mm2/s with a mean of 1.294 ± 0.142 × 10⁻³ mm2/s. On comparing them with pre-CCRT ADC values, there was a mean increase of 0.480 ± 0.134 × 10⁻³ mm2/s which was statistically significant. Similar observations were also made by other authors[22,23,24,25,26,27,28,29,30] and few recent studies [Table 6].
Table 6.
Comparison with other studies
| Author | Journal | Year of publication | Responders with no residual lesion | Non-responders with residual lesion | ||
|---|---|---|---|---|---|---|
| Pre-CCRT mean ADC (×10−3 mm2/s) | Post-CCRT mean ADC value (×10−3mm2/s) | Pre-CCRT mean ADC (×10−3 mm2/s) | Post-CCRT mean ADC value (×10−3 mm2/s) | |||
| A le Roux[26] | S Afr J Rad | 2013 | 1.26 | 1.79 | 1.40 | 1.58 |
| Schreuder[27] | J Magn Reson Imaging. | 2015 | 0.88 | 1.50 | 0.87 | 1.18 |
| Liu[28] | Radiat Oncol | 2015 | 0.810 | 1.507 | 0.863 | 1.425 |
| Onal[29] | J Magn Reson Imaging. | 2016 | 0.936 | 1.248 | 0.822 | 1.060 |
| Fa-Jun Ju[30] | Onco Targets Ther. | 2016 | 0.98 | 1.51 | 0.99 | 1.43 |
CCRT: concurrent chemoradiation therapy; ADC: apparent diffusion coefficient
Nonresponders (4 cases) with residual lesion had lower ADC values (1.092 ± 0.214 × 10⁻³ mm2/s) when compared with responders (31 cases) with no residual lesion (1.212 ± 0.214 × 10⁻³ mm2/s). These findings are in agreement with the observations made by Fu et al.,[23] who on the basis of a metaanalysis of 16 studies that included 517 patients with cervical cancer, reported that the mean ADC value in patients without residual tumor post-CCRT was significantly higher than in patients with residual tumors. Chopra et al.[31] in their ROC analysis identified volume of 25 cm3 or higher (sensitivity = 80%, specificity = 80%, AUC = 0.76, P = 0.04) and ADC more than 1 × 10⁻³ mm2/s (sensitivity = 70%, specificity = 50%, AUC = 0.62, P = 0.34) to best predict for partial response, and after restricting analysis to bulky tumors ADC greater than 0.95 × 10⁻³ mm2/s predicted partial response with high sensitivity (85.7%) and specificity (100%) (AUC 0.96, P = 0.05). In our study, the AUC value was found to be 0.819, thus showing the predictive efficacy to be close to 81.9%; and on evaluating different coordinates generated by ROC analysis, pre-CCRT ADC <0.799 was projected to be 100% sensitive and 61.1% specific in prediction of residual lesion. However, due to low volume and insufficient data, we were not able to determine the exact cut-off ADC values for cervical cancer at the end of treatment. An interesting and unique observation was that pre-CCRT ADC values of nonresponders were lower than responders.
The findings of this study within its limitations, that is limitation of sample size and duration, showed that DW imaging and ADC values are helpful in characterizing the cervical cancer and can also play a role in predicting response to chemoradiotherapy and in posttreatment assessment. Further studies on larger sample size with longer duration of follow-up are recommended to reconfirm the findings especially in context with tumor stage, grade, stromal invasion, and recurrence pattern.
Conclusion
The pre-CCRT mean ADC value of cases with lymph node involvement and parametrial extension were lower when compared with those without lymph node involvement and parametrial extension. On post-CCRT imaging, nonresponders (4 cases) with residual lesion had lower ADC values when compared with responders (31 cases) with no residual lesion. The pre-CCRT mean ADC value of responders was found to be higher than nonresponders. Although this study had limitations of sample size, duration, and absence of control, still the quantitative ADC values obtained from focal areas of restricted diffusion show promising role of ADC as a potential imaging cancer biomarker in cervical cancer, prediction of CCRT outcome, and post-CCRT response evaluation.
Financial support and sponsorship
Nil.
Conflicts of interest
There are no conflicts of interest.
References
- 1.ICO Information Centre on HPV and Cancer (Summary Report 2014-08-22) Human Papillomavirus and Related Diseases in India. 2014 [Google Scholar]
- 2.Moore DH. Cervical cancer. Obstetric Gynecol. 2006;107:1152–61. doi: 10.1097/01.AOG.0000215986.48590.79. [DOI] [PubMed] [Google Scholar]
- 3.Kinkel K. Pitfalls in staging uterine neoplasm with imaging: A review. Abdom Imaging. 2006;31:164–73. doi: 10.1007/s00261-005-0383-8. [DOI] [PubMed] [Google Scholar]
- 4.Balleyguier C, Sala E, Da Cunha T, Bergman A, Brkljacic B, Danza F, et al. Staging of uterine cervical cancer with MRI: Guidelines of the European Society of Urogenital Radiology. Eur Radiol. 2011;21:1102–10. doi: 10.1007/s00330-010-1998-x. [DOI] [PubMed] [Google Scholar]
- 5.Nicolet V, Carignan L, Bourdon F, Prosmanne O. MR imaging of cervical carcinoma: A practical staging approach. Radiographics. 2000;20:1539–49. doi: 10.1148/radiographics.20.6.g00nv111539. [DOI] [PubMed] [Google Scholar]
- 6.Harry VN, Deans H, Ramage E, Parkin DE, Gilbert FJ. Magnetic resonance imaging in gynecological oncology. Int J Gynecol Cancer. 2009;19:186–93. doi: 10.1111/IGC.0b013e31819c52de. [DOI] [PubMed] [Google Scholar]
- 7.Demirbaş T, Cimilli T, Bayramoǧlu S, Güner NT, Hocaoǧlu E, İnci E. Contribution of diffusion-weighted imaging to diagnosis and staging of cervical cancer. Balkan Med J. 2014;31:154–7. doi: 10.5152/balkanmedj.2014.13122. [DOI] [PMC free article] [PubMed] [Google Scholar]
- 8.Padhani AR, Liu G, Koh DM, Chenevert TL, Thoeny HC, Takahara T, et al. Diffusion-weighted magnetic resonance imaging as a cancer biomarker: Consensus and recommendations. Neoplasia. 2009;11:102–25. doi: 10.1593/neo.81328. [DOI] [PMC free article] [PubMed] [Google Scholar]
- 9.Le Bihan D, Iima M. Diffusion magnetic resonance imaging: What water tells us about biological tissues. PLoS Biol. 2015;13:e1002203. doi: 10.1371/journal.pbio.1002246. [DOI] [PMC free article] [PubMed] [Google Scholar]
- 10.Chauhan VP, Stylianopoulos T, Boucher Y, Jain RK. Delivery of molecular and nanoscale medicine to tumors: Transport barriers and strategies. Annu Rev Chem Biomol Eng. 2011;2:281–98. doi: 10.1146/annurev-chembioeng-061010-114300. [DOI] [PubMed] [Google Scholar]
- 11.Padhani AR, Khan AA. Diffusion-weighted (DW) and dynamic contrast-enhanced (DCE) magnetic resonance imaging (MRI) for monitoring anticancer therapy. Targ Oncol. 2010;5:39–52. doi: 10.1007/s11523-010-0135-8. [DOI] [PubMed] [Google Scholar]
- 12.Whittaker CS, Coady A, Culver L, Rustin G, Padwick M, Padhani AR. Diffusion-weighted MR imaging of female pelvic tumors: A pictorial review. Radiographics. 2009;29:759–78. doi: 10.1148/rg.293085130. [DOI] [PubMed] [Google Scholar]
- 13.Thoeny HC, Ross BD. Predicting and monitoring cancer treatment response with diffusion-weighted MRI. J Magn Reson Imaging. 2010;32:2–16. doi: 10.1002/jmri.22167. [DOI] [PMC free article] [PubMed] [Google Scholar]
- 14.Kim T, Murakami T, Takahashi S, Hori M, Tsuda K, Nakamura H. Diffusion-weighted single-shot echoplanar MR imaging for liver disease. AJR Am J Roentgenol. 1999;173:393–8. doi: 10.2214/ajr.173.2.10430143. [DOI] [PubMed] [Google Scholar]
- 15.Guo Y, Cai YQ, Cai ZL, Gao YG, An NY, Ma L, et al. Differentiation of clinically benign and malignant breast lesions using diffusion-weighted imaging. J Magn Reson Imaging. 2002;16:172–8. doi: 10.1002/jmri.10140. [DOI] [PubMed] [Google Scholar]
- 16.Vargas HA, Akin O, Franiel T, Mazaheri Y, Zheng J, Moskowitz C, et al. Diffusion-weighted endorectal MR imaging at 3 T for prostate cancer: Tumor detection and assessment of aggressiveness. Radiology. 2011;259:775–84. doi: 10.1148/radiol.11102066. [DOI] [PMC free article] [PubMed] [Google Scholar]
- 17.Hasan DI, Enaba MM, Abd El-Rahman HM, El-Shazely S. Apparent diffusion coefficient value in evaluating types, stages and histologic grading of cancer cervix. Egyptian J Radiol Nucl Med. 2015;46:781–9. [Google Scholar]
- 18.Atram S, Vijayavargiya R, Naveen C. Role of diffusion weighted-magnetic resonance imaging in pre-treatment evaluation of cervical cancer. NJMDR. 2016;4:307–14. [Google Scholar]
- 19.Karunya RJ, Tharani P, John S, Kumar RM, Das S. Role of functional magnetic resonance imaging derived parameters as imaging biomarkers and correlation with clinicopathological features in carcinoma of uterine cervix. J Clin Diagn Res. 2017;8:XC06–11. doi: 10.7860/JCDR/2017/29165.10426. [DOI] [PMC free article] [PubMed] [Google Scholar]
- 20.McVeigh PZ, Syed AM, Milosevic M, Fyles A, Haider MA. Diffusion-weighted MRI in cervical cancer. Eur Radiol. 2008;18:1058–64. doi: 10.1007/s00330-007-0843-3. [DOI] [PubMed] [Google Scholar]
- 21.Chen J, Zhang Y, Liang B, Yang Z. The utility of diffusion-weighted MR imaging in cervical cancer. Eur J Radiol. 2010;74:101–6. doi: 10.1016/j.ejrad.2009.04.025. [DOI] [PubMed] [Google Scholar]
- 22.Kuang F, Ren J, Zhong Q, Liyuan F, Huan Y, Chen Z. The value of apparent diffusion coefficient in the assessment of cervical cancer. Eur Radiol. 2013;23:1050–8. doi: 10.1007/s00330-012-2681-1. [DOI] [PubMed] [Google Scholar]
- 23.Fu ZZ, Peng Y, Cao LY, Chen YS, Li K, Fu BH. Value of apparent diffusion coefficient (ADC) in assessing radiotherapy and chemotherapy success in cervical cancer. Magn Reson Imaging. 2015;33:516–24. doi: 10.1016/j.mri.2015.02.002. [DOI] [PubMed] [Google Scholar]
- 24.Liu Y, Bai R, Sun H, Liu H, Zhao X, Li Y. Diffusion-weighted imaging in predicting and monitoring the response of uterine cervical cancer to combined chemoradiation. Clin Radiol. 2009;64:1067–74. doi: 10.1016/j.crad.2009.07.010. [DOI] [PubMed] [Google Scholar]
- 25.Atstupėnaitė V, Basevičius A, Krimelis A, Inčiūra A, Vaitkienė D. Diffusion-weighted magnetic resonance imaging of cervical cancer. Acta Med Lituanica. 2011;18:139–46. [Google Scholar]
- 26.le Roux AJ, Gebremariam F, Harmse W. Value of apparent diffusion coefficient (ADC) in evaluating response of carcinoma of the cervix treated with chemoradiotherapy. S Afr J Rad. 2013;17:11–5. [Google Scholar]
- 27.Schreuder SM, Lensing R, Stoker J, Bipat S. Monitoring treatment response in patients undergoing chemoradiotherapy for locally advanced uterine cervical cancer by additional diffusion-weighted imaging: A systematic review. J Magn Reson Imaging. 2015;42:572–94. doi: 10.1002/jmri.24784. [DOI] [PubMed] [Google Scholar]
- 28.Liu Y, Sun H, Bai R, Ye Z. Time-window of early detection of response to concurrent chemoradiation in cervical cancer by using diffusion-weighted MR imaging: A pilot study. Radiat Oncol. 2015;10:185. doi: 10.1186/s13014-015-0493-6. [DOI] [PMC free article] [PubMed] [Google Scholar]
- 29.Onal C, Erbay G, Guler OC. Treatment response evaluation using the mean apparent diffusion coefficient in cervical cancer patients treated with definitive chemoradiotherapy. J Magn Reson Imaging. 2016;44:1010–9. doi: 10.1002/jmri.25215. [DOI] [PubMed] [Google Scholar]
- 30.Fa-Jun Ju. Evaluation of the efficacy of chemoradiotherapy in cervical cancer using diffusion-weighted imaging and apparent diffusion coefficient. Onco Targets Ther. 2016;9:7555–61. doi: 10.2147/OTT.S111829. [DOI] [PMC free article] [PubMed] [Google Scholar]
- 31.Chopra S, Verma A, Kundu S, Engineer R, Medhi S, Mahantshetty U, et al. Evaluation of diffusion-weighted imaging as a predictive marker for tumor response in patients undergoing chemoradiation for postoperative recurrences of cervical cancer. J Cancer Res Ther. 2012;8:68–73. doi: 10.4103/0973-1482.95177. [DOI] [PubMed] [Google Scholar]


