Abstract
Hyperpolarized magnetic resonance spectroscopy enables quantitative, non-radioactive, real-time measurement of imaging probe biodistribution and metabolism in vivo. Here, we investigate and report on the development and characterization of hyperpolarized acetylsalicylic acid (aspirin) and its use as a nuclear magnetic resonance (NMR) probe. Aspirin derivatives were synthesized with single- and double-13C labels and hyperpolarized by dynamic nuclear polarization with 4.7% and 3% polarization, respectively. The longitudinal relaxation constants (T1) for the labeled acetyl and carboxyl carbonyls were approximately 30 seconds, supporting in vivo imaging and spectroscopy applications. In vitro hydrolysis, transacetylation, and albumin binding of hyperpolarized aspirin were readily monitored in real time by 13C-NMR spectroscopy. Hyperpolarized, double-labeled aspirin was well tolerated in mice and could be observed by both 13C-MR imaging and 13C-NMR spectroscopy in vivo.
Keywords: Aspirin, chemopreventive, hyperpolarization, magnetic resonance imaging, magnetic resonance spectroscopy
Recent epidemiological evidence strongly suggests that long-term low-dose acetylsalicylic acid (aspirin) use significantly decreases the incidence of many cancers.[1] While this effect may be mediated by cyclooxygenase-2 (COX-2) inhibition in the tumor and surrounding stroma,[2] the highly promiscuous transacetylation activity[3] of aspirin suggests alternative mechanisms of action.
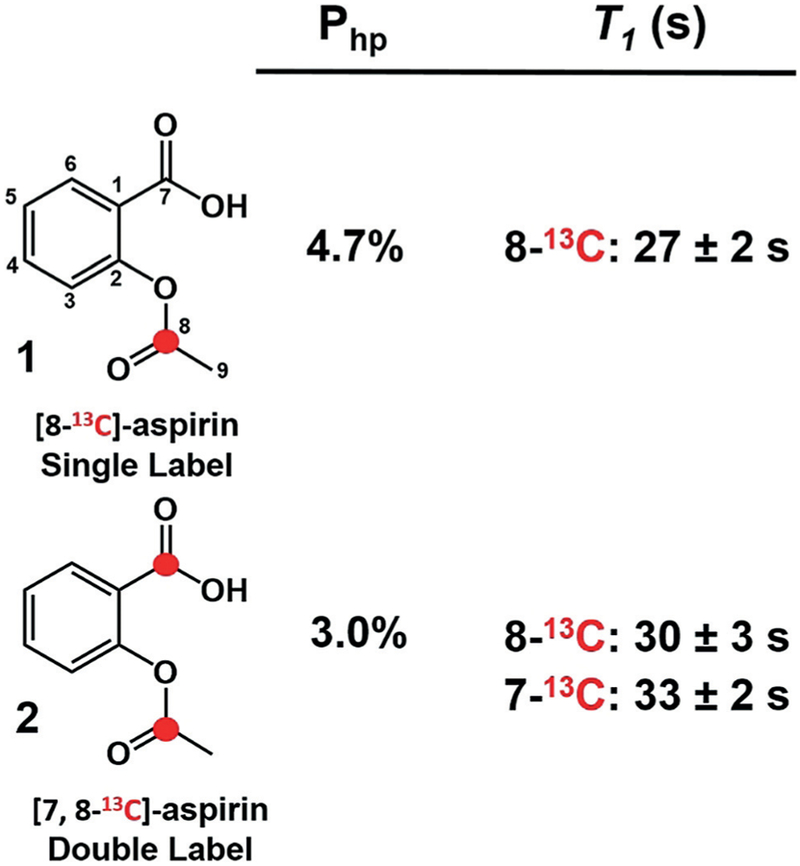
Aspirin is initially metabolized in vivo by hydrolysis of the O-acetyl group (position 8, Figure 1) to form acetate and salicylic acid. Following hydrolysis, salicylic acid is conjugated to glycine or glucuronic acid at the exocyclic carboxyl group (position 7). Aspirin metabolism is heterogeneous and can vary by as much as 20-fold among individuals,[4] potentially modulating its chemopreventive effect within patient populations.[5] Long-term aspirin use can also result in gastrointestinal bleeding and intracranial hemorrhages in some patients,[6] further complicating its routine use as a cancer chemopreventive.
Figure 1.

13C-labeled acetylsalicylic acid (aspirin) derivatives synthesized in this study. 13C-labeled carbons are represented by a red dot. The carbon numbering scheme used throughout this manuscript is shown. Percent polarization values (Php) and median longitudinal relaxation constants (T1) for single-labeled (n = 2) and double-labeled (n = 2) aspirin at 7 T are provided ± standard error of the mean.
Given this metabolic and toxicologic variability, it is desirable to develop a method to monitor aspirin metabolism and biodistribution in real time in patients. While radiotracer-based methods have been used to interrogate aspirin biodistribution and pharmacokinetics,[7] these approaches cannot distinguish between the intact compound and its metabolic byproducts and are poorly adaptable to routine patient imaging.
The advent of hyperpolarized nuclear magnetic resonance (NMR) spectroscopy enabled the real-time interrogation of imaging probe metabolism in living systems.[8] In 13C hyperpolarized NMR experiments, a 13C-labeled compound (for example, [1-13C]-pyruvate) is polarized by one of a variety of methods (for example, dynamic nuclear polarization [DNP],[9] parahydrogen and synthesis allow dramatically enhanced nuclear alignment [PASADENA],[10] or brute force[11]), rapidly injected into the animal or phantom, and its metabolism is observed by 13C spectroscopy or spectroscopic imaging.[12]
Here, we report the successful hyperpolarization of 13C-labeled aspirin; real-time monitoring of its in vitro hydrolysis, transacetylation, and albumin-binding reactions; and visualization of its early biodistribution in mice. This work represents one of the first demonstrations of 13C-NMR spectroscopy as a tool to track the biodistribution of a clinical drug in vivo as well as the first use of aspirin as a hyperpolarized MR probe.
We reasoned that labeling the O-acetyl (position 8) and carboxyl carbonyl (position 7) carbons of aspirin with 13C would allow us to monitor both aspirin transacetylation and metabolism in vivo by changes in the chemical shift of these nuclei. Single- (1) and double-labeled (2) aspirin (Figure 1) were readily obtained by the reaction of salicylic acid or [7-13C]-salicylic acid with [1,1-13C2]-acetic anhydride or [1-13C]-acetyl chloride followed by silica gel chromatography and recrystallization from ethanol[13] (Supporting Information, Figures S1–S6). Both aspirin derivatives were polarized using DNP (HyperSense, Oxford Instruments). In a typical hyperpolarization experiment, 13C-labeled aspirin was dissolved in a 63% (v/v) dimethyl sulfoxide-d6 and water solution to a final concentration of 1.5 M. Oxo63 free radical (Oxford Instruments) was added directly to the mixture to a final concentration of 15.6 mM. Approximately 168 μmoles of labeled aspirin were hyperpolarized in each experiment, with gadolinium III complex (Prohance, 1.8 mM, Bracco Diagnostics) added to each sample to enhance solid-state polarization. Samples were polarized for 1 to 1.5 hours and then dissolved in 4 mL of either phosphate-buffered saline (PBS) in deuterium oxide (pH 7.2) or PBS in 10% deuterium oxide to a final concentration of approximately 42 mM hyperpolarized aspirin. Following dissolution, the hyperpolarized material was rapidly injected in either a 7T horizontal-bore MR scanner or a vertical-bore 7T NMR spectrometer (See Figure S7 in the Supporting Information for a schematic of the experimental setup)
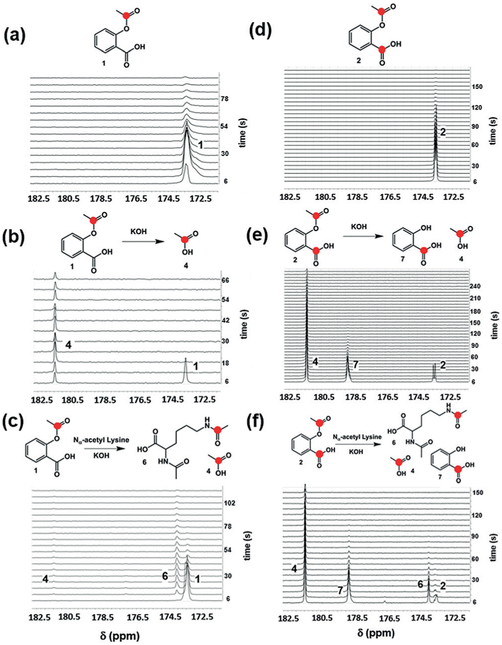
In the case of hyperpolarized 1, a single major peak at 173.3 ppm was observed by 13C-NMR spectroscopy (Figure 2a). The chemical shift of the major peak was consistent with the O-13C acetyl carbon of intact aspirin (Supporting Information, Figure S2). There was no indication of hydrolysis of the hyperpolarized compound after dissolution or during spectroscopy. The percent polarization (Php) was approximately 4.7% at the time of detection, determined by comparison to the signal from the same, thermally polarized sample. This represents a greater than 3000-fold signal enhancement relative to the unpolarized material at 7 T field strength.[14] 13C-NMR spectroscopy of hyperpolarized 2 showed two partially resolved resonances at 173.3 and 173.6 ppm (Figure 2d) corresponding to the O-13C acetyl carbonyl (position 8) and carboxylic acid carbonyl carbons (position 7), respectively (Supporting Information, Figure S4). The combined polarization for both carbonyls in 2 was approximately 3%.[14]
Figure 2.
In vitro reactions with hyperpolarized 1 and 2. a) Hyperpolarized 1 in phosphate-buffered saline (PBS, 100% D2O, 7 T). b) Hyperpolarized 1 in 1 m KOH hydrolyzes rapidly to form hyperpolarized acetate 4, seen at 181.5 ppm. c) Hyperpolarized 1 in 1 m KOH and 250 mM Nα-acetyl lysine undergoes rapid transacetylation to form Nα, 13C-Nε-diacetyl lysine 6, seen at 174.1 ppm. d) Hyperpolarized 2 in PBS (100% D2O). Both 13C-labeled carbons were observed as a partially resolved doublet at 173.3–173.6 ppm (7 T). e) Hydrolysis of hyperpolarized 2 in excess KOH resulted in the formation of 13C-acetate 4 and 13C-salicylic acid 7 (178.7 ppm). f) Reaction with hyperpolarized 2 and Nα-acetyl lysine showed the expected Nα, 13C-Nε-diacetyl lysine 6 as well as 13C-acetate and 13C-salicylic acid.
The T1 of the hyperpolarized O-acetyl 13C-carbonyl in hyperpolarized 1 was measured in 100 % D2O and at 37 °C by NMR using a 12° flip angle every 6 seconds and found to be 27±2 seconds in longitudinal relaxation experiments, sufficient for approximately 1 minute of imaging in vivo. These experiments showed nearly identical values for the O-acetyl 13C-carbonyl carbon in hyperpolarized 2 (30±3 seconds) and a T1 of 33±2 seconds for the 13C-labeled carboxylic acid carbon (position 7, Figure 1). Previous work showed that the incorporation of deuterium nuclei within 1–2 bonds of 13C nuclei eliminates relaxation pathways and enhances the T1 of the 13C label.[15] With this in mind, derivative 3, which is deuterated at the O-acetyl methyl carbon, was synthesized, and hyperpolarized by DNP. Unfortunately, no significant effect on the T1 of the O-acetyl carbonyl carbon was observed, which may indicate that the methyl protons of aspirin do not play a significant role in the spin-lattice relaxation of this nucleus (Supporting Information, Figure S8).
We next sought to determine whether hydrolysis and transacetylation reactions with hyperpolarized 1 could be observed by hyperpolarized 13C-NMR. Initial NMR and mass spectrometry studies of non-hyperpolarized, 13C-labeled aspirin showed rapid transacetylation of glycine and Nα-acetyl lysine (Supporting Information, Figures S9 and S10), as evidenced by the appearance of peaks at 173.9 ppm and 173.8 ppm corresponding to acetylation of the α-amino group of glycine and the Nε-amino group of Nα-acetyl lysine, respectively. The chemical shifts of the acetylated products are well-resolved from the intact aspirin O-acetyl carbonyl resonance at 173.3 ppm and are consistent with those observed in previous transacetylation studies with non-hyperpolarized 13C-labeled aspirin.[16] Reaction of hyperpolarized 1 with excess KOH (pH 10–11) showed rapid hydrolysis to acetate (Figure 2b). In contrast, no hydrolysis was observed at biological pH (pH 7.2). The addition of Nα-acetyl lysine (Figure 2c) in the presence of hyperpolarized 1 and excess KOH resulted in the rapid and complete conversion to the expected N,N-diacetyl product within approximately 20 seconds. A parallel set of experiments with hyperpolarized 2 resulted in the rapid conversion to acetate and salicylic acid (181.3 and 178.7 ppm, respectively) in the presence of KOH (Figure 2e), and conversion to acetate, salicylic acid, and Nα, 13C-Nε-diacetyl lysine in the presence of KOH and Nα-acetyl lysine (Figure 2f). The resonances for acetate and salicylic acid were well resolved from the parent resonance (Δδ = 8.0 and 5.4 ppm, respectively), suggesting that these products can be readily detected in vivo by MR spectroscopy. The T1 values for aspirin derivatives and reaction products (Supporting Information, Table S1) were similar to those of the carbons at positions 7 and 8 of aspirin, while the T1 of the acetate carbonyl carbon was significantly higher, as expected on the basis of previous studies.[17] These experiments demonstrated that transacetylation and hydrolysis reactions of both hyperpolarized aspirin derivatives could be monitored in real time by 13C-NMR on the time scale of the hyperpolarized signal.
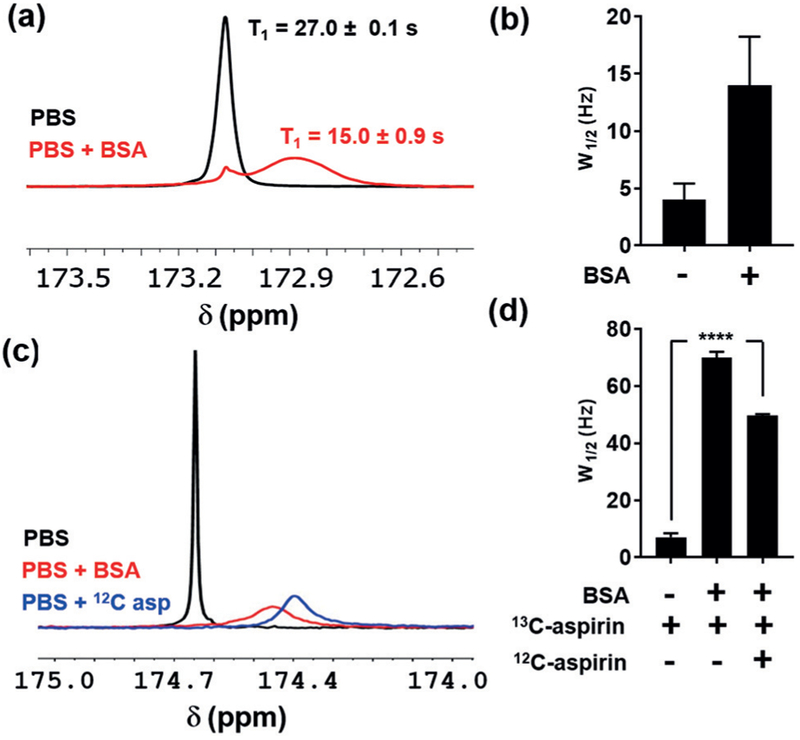
In preparation for animal studies, the interaction of hyperpolarized aspirin with serum albumin was investigated using hyperpolarized NMR. Human albumin contains multiple aspirin-binding sites[18] and is covalently acetylated by aspirin at lysine residues in a pH-dependent manner.[19] Incubation of hyperpolarized 1 with a 5% solution of bovine serum albumin (BSA) in PBS resulted in the appearance of a broad resonance centered at 172.9 ppm that was partially resolved from a sharp minor resonance at 173.1 ppm (Figure 3a). The linewidth of the broad resonance was 15 Hz, and the T1 was approximately 15 seconds. In contrast, the linewidth of the sharp minor resonance was 5 Hz, consistent with hyperpolarized 1 in PBS (Figure 3b). Analogous 13C-NMR experiments with non-hyperpolarized 1 showed a similar line-broadening effect in the presence of BSA, which was significantly reduced by competition with excess 12C-aspirin (Figures 3c,d).
Figure 3.

Interaction between hyperpolarized 1 and bovine serum albumin (BSA). a) Stacked 13C-NMR spectra of hyperpolarized 1 in phosphate-buffered saline (PBS, 10% D2O) and 50 mgmL−1 BSA in PBS (10% D2O). Median T1 values for the major resonances in each spectrum are shown±standard deviation (n = 2). b) Average linewidths of the major peaks (W1/2 in Hz) in each hyperpolarized spectrum are shown along with the standard deviation (n = 2). c) Stacked non-hyperpolarized 13C-NMR spectra of 1 in PBS, PBS+BSA, and PBS+BSA with 3-fold excess 12C-aspirin (1000 scans per spectrum). d) Median linewidths of the major aspirin resonance in each spectrum along with the standard deviation (n = 4). Two-way analysis of variance (ANOVA, multiple comparisons) was used to assess statistical significance (****, P<0.0001).
These experiments suggest that the increased linewidth and relaxation rate of 1 in the presence of BSA arises from exchange between the free and bound form. This finding is consistent with previous studies showing that the aromatic protons of aspirin undergo increased line-broadening and T1 reduction upon albumin binding,[20] likely owing to a decreased tumbling rate in the bound form. Further support for exchange-mediated line broadening is seen in the decreased linewidth of 1 in 12C-aspirin competition experiments where binding site occupancy by the unlabeled aspirin inhibits exchange of 1 with the protein. Although these observations support exchange-mediated line-broadening, we cannot rule out contributions from dipolar coupling between bound 1 and BSA.
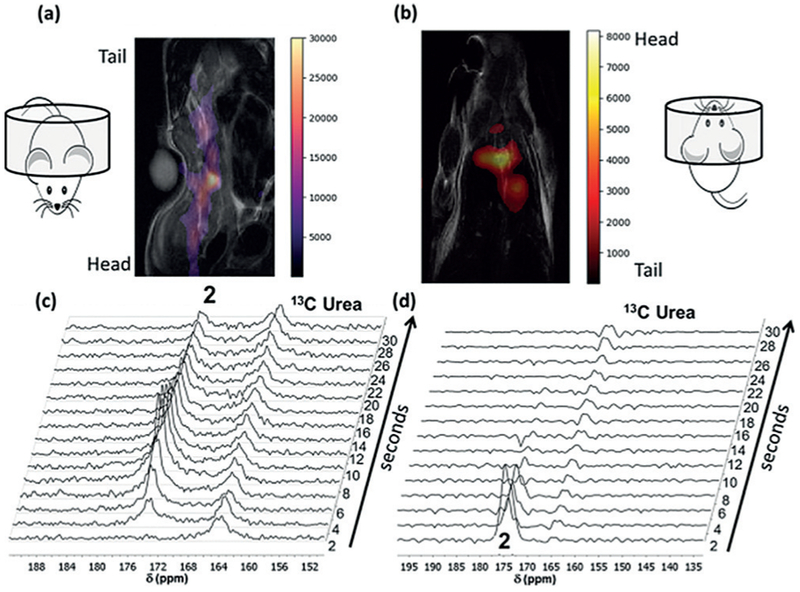
Finally, we sought to monitor the in vivo biodistribution and metabolism of hyperpolarized 2, which offered the possibility of monitoring metabolism at both the O-acetyl and carboxylic acid groups. Normal male nude mice were injected with 200 μL of hyperpolarized material (42 mM, 3% polarized) via a tail-vein catheter. An 8M 13C-urea phantom was used for chemical shift referencing. 13C-imaging was performed using an echo-planar imaging (EPI) sequence, and a hyperpolarized signal was observed in the inferior vena cava (less than 5 seconds post-injection) and the heart (more than 5 seconds post-injection) (Figures 4a,b).
Figure 4.

In vivo imaging and spectroscopy of hyperpolarized double-labeled aspirin 2. a) Overlaid 1H and 13C (false color) coronal image immediately after injection of hyperpolarized 2. The posterior of the mouse was placed inside the volume coil. b) Same as (a) except the anterior of the mouse occupies the volume coil and imaging was initiated 5 seconds after injection. Single 13C transient arrays following injection of hyperpolarized 2 with the posterior (c) or the anterior (d) of the mouse placed in the volume coil. The resonance for 2 is readily observed at 174.5 ppm for approximately 30 seconds when spectroscopy is initiated immediately after injection (c).
Images with an acceptable signal-to-noise ratio could be acquired for up to 10 seconds following injection of the hyperpolarized material. A series of slice-selective 13C spectra were collected 1–10 seconds after injection of hyperpolarized material. A single slice was placed over the majority of the animal, and single free induction decay (FID) signals were acquired every 2 seconds. The in vivo spectroscopy showed the expected double peak of 2, but no hydrolysis or transacetylation products were observed (Figures 4c,d). The full time-courses of both imaging experiments are shown in Figures S11 and S12 in the Supporting Information and enlarged versions of Figure 4a and 4b are shown in Figures S13 and S14 in the Supporting Information, respectively.
Both 13C-labeled aspirin derivatives synthesized in this work were efficiently polarized by DNP within 90 minutes and retained this polarization after dissolution. The longitudinal relaxation times for both 13C-labeled carbonyls were approximately 30 seconds, which was sufficient for in vivo imaging and spectroscopy. In vitro base-catalyzed hydrolysis and transacetylation reactions of both hyperpolarized derivatives could be followed in real-time by NMR spectroscopy, suggesting that this technique could be used to observe analogous reactions in vivo. Binding of hyperpolarized 1 to serum albumin was readily observed by changes in linewidth, relaxation time, and chemical shift, suggesting that hyperpolarized NMR spectroscopy can be used for label-free real-time analysis of aspirin-protein binding interactions. This finding is consistent with previous work showing the utility of hyperpolarized 19F-NMR for the study of ligand–protein binding interactions in the slow- and fast-exchange regimes.[21]
Although the parent hyperpolarized aspirin resonance was observed in mice using in vivo MR spectroscopy, there was no evidence of hydrolysis or transacetylation in any single spectrum or in a summation spectrum of the first 15 individual spectra (Supporting Information, Figure S15). This result may be attributable to the low initial polarization of 2 (3%), or the rapid decay of the 13C signal in vivo, which significantly reduced the imaging time available. We suspect that this signal decay arises from the reduction of the in vivo T1 as a result of serum-protein binding. Indeed, incubation of hyperpolarized 1 with mouse plasma and intact red blood cells showed approximately 50% reduction in the T1 of the parent 13C resonance (Supporting Information, Figure S16), which is consistent with the albumin-binding experiments (Figure 3a). Further enhancement of Php through microwave-gated DNP[22] or the use of clinical polarizers[23] may provide sufficient input signal to compensate for the increased relaxation rate of hyperpolarized aspirin in vivo.
To our knowledge, this study is the first demonstration of the use of hyperpolarization to directly visualize in vitro albumin binding and early in vivo biodistribution of a clinical drug. Previous work with hyperpolarized drugs[24] has not been extended to in vivo studies, owing in part to the low T1 values and dose-limiting toxicities of the hyperpolarized species. Hyperpolarized aspirin maintained an acceptable T1 in biological mixtures, and mice could tolerate multiple injections over a 2-week period (n = 3), with no apparent adverse effects. These results underscore the potential of hyperpolarized NMR to quantitatively and noninvasively assess the metabolic, biochemical, and pharmacological activity of aspirin in vitro and in vivo.
Supplementary Material
Acknowledgements
This work was supported by MD Anderson start-up funds (S.W.M., P.B.), R21CA181994 (S.W.M.), 2R44CA206771 (S.W.M.), R21CA185536 (P.B.), CPRIT RP180164 (P.B.), CDMRP PC110065 (N.Z., J.L., P.B.), Colleen’s Dream Foundation (NZ), an MD Anderson Institutional Research Grant (N.Z., P.B.), and a grant from the Gulf Coast Consortium (J.L., P.B.). Additional funding was provided by a GE In-kind Multi-investigator Imaging (MI2) Research Award (S.W.M., P.B.), the Boone Pickens Distinguished Chair for Early Prevention of Cancer, The Duncan Family Institute for Cancer Prevention and Risk Assessment, the Colorectal Moon Shot, 1R01CA187238, 5R01CA1722670, and 1R01CA184843. A.O. was supported by a cancer prevention educational award (R25T CA057730, Dr. Shine Chang, PI). S.P. was supported by Gulf Coast Consortia/Keck Center postdoctoral fellowship CPRIT RP170593. The MD Anderson Nuclear Magnetic Resonance Facility and Small Animal Imaging Facility (SAIF) are supported by the MD Anderson Cancer Center Support Grant 5P30CA016672 (Dr. Peter Pisters). We also thank the staff at the SAIF and the NMR facility for their assistance with the magnetic resonance imaging experiments and the Department of Scientific Publications at MD Anderson Cancer Center for reading and editing this manuscript.
Footnotes
Supporting information, including detailed synthetic protocols and experimental methods, along with Figures S1–S16 and Table S1, and the ORCID identification number(s) for the author(s) of this article can be found under: https://doi.org/10.1002/anie.201812759.
Conflict of interest
The authors declare no conflict of interest.
Contributor Information
Niki M. Zacharias, Department of Cancer Systems Imaging, The University of Texas MD Anderson Cancer Center, 1515 Holcombe Blvd., Houston, TX 77030 (USA).
Argentina Ornelas, Department of Cancer Systems Imaging, The University of Texas MD Anderson Cancer Center, 1515 Holcombe Blvd., Houston, TX 77030 (USA).
Jaehyuk Lee, Department of Cancer Systems Imaging, The University of Texas MD Anderson Cancer Center, 1515 Holcombe Blvd., Houston, TX 77030 (USA).
Jingzhe Hu, Department of Cancer Systems Imaging, The University of Texas MD Anderson Cancer Center, 1515 Holcombe Blvd., Houston, TX 77030 (USA).
Jennifer S. Davis, Department of Epidemiology, The University of Texas MD Anderson Cancer Center, 1515 Holcombe Blvd., Houston, TX 77030 (USA)
Nasir Uddin, Department of Cancer Systems Imaging, The University of Texas MD Anderson Cancer Center, 1515 Holcombe Blvd., Houston, TX 77030 (USA).
Shivanand Pudakalakatti, Department of Cancer Systems Imaging, The University of Texas MD Anderson Cancer Center, 1515 Holcombe Blvd., Houston, TX 77030 (USA).
David G. Menter, Department of Gastrointestinal Medical Oncology, The University of Texas MD Anderson Cancer Center, 1515 Holcombe Blvd., Houston, TX 77030 (USA)
Jose A. Karam, Department of Urology, The University of Texas MD Anderson Cancer, 1515 Holcombe Blvd., Houston, TX 77030 (USA)
Christopher G. Wood, Department of Urology, The University of Texas MD Anderson Cancer, 1515 Holcombe Blvd., Houston, TX 77030 (USA)
Ernest T. Hawk, Department of Clinical Cancer Prevention, The University of Texas MD Anderson Cancer Center, 1515 Holcombe Blvd., Houston, TX 77030 (USA)
Scott Kopetz, Department of Gastrointestinal Medical Oncology, The University of Texas MD Anderson Cancer Center, 1515 Holcombe Blvd., Houston, TX 77030 (USA).
Eduardo Vilar, Department of Gastrointestinal Medical Oncology, The University of Texas MD Anderson Cancer Center, 1515 Holcombe Blvd., Houston, TX 77030 (USA);Department of Clinical Cancer Prevention, The University of Texas MD Anderson Cancer Center, 1515 Holcombe Blvd., Houston, TX 77030 (USA).
Pratip K. Bhattacharya, Department of Cancer Systems Imaging, The University of Texas MD Anderson Cancer Center, 1515 Holcombe Blvd., Houston, TX 77030 (USA)
Steven W. Millward, Department of Cancer Systems Imaging, The University of Texas MD Anderson Cancer Center, 1515 Holcombe Blvd., Houston, TX 77030 (USA).
References
- [1].a)Algra AM, Rothwell PM, Lancet Oncol. 2012, 13, 518–527; [DOI] [PubMed] [Google Scholar]; b)Chan AT, Ogino S, Fuchs CS, JAMA J. Am. Med. Assoc 2009, 302, 649–658. [DOI] [PMC free article] [PubMed] [Google Scholar]
- [2].Wang D, Dubois RN, Oncogene 2010, 29, 781–788. [DOI] [PMC free article] [PubMed] [Google Scholar]
- [3].Ornelas A, Zacharias-Millward N, Menter DG, Davis JS, Lichtenberger L, Hawke D, Hawk E, Vilar E, Bhattacharya P, Millward S, Cancer Metastasis Rev. 2017, 36, 289–303. [DOI] [PMC free article] [PubMed] [Google Scholar]
- [4].Bhatt DL, Grosser T, Dong JF, Logan D, Jeske W, Angiolillo DJ, Frelinger AL 3rd, Lei L, Liang J, Moore JE, Cryer B, Marathi U, J. Am. Coll. Cardiol 2017, 69, 603–612. [DOI] [PubMed] [Google Scholar]
- [5].Chan AT, Tranah GJ, Giovannucci EL, Hunter DJ, Fuchs CS, J. Natl. Cancer Inst 2005, 97, 457–460. [DOI] [PubMed] [Google Scholar]
- [6].Rothwell PM, Algra A, Chen Z, Diener H-C, Norrving B, Mehta Z, Lancet 2016, 388, 365–375. [DOI] [PMC free article] [PubMed] [Google Scholar]
- [7].Hatori A, Shigematsu A, Tsuya A, Eur. J. Drug Metab. Pharmacokinet 1984, 9, 205–214. [DOI] [PubMed] [Google Scholar]
- [8].Ardenkjaer-Larsen JH, Fridlund B, Gram A, Hansson G, Hansson L, Lerche MH, Servin R, Thaning M, Golman K, Proc. Natl. Acad. Sci. USA 2003,100, 10158–10163. [DOI] [PMC free article] [PubMed] [Google Scholar]
- [9].Abragam A, Goldman M, Rep. Prog. Phys 1978, 41, 395. [Google Scholar]
- [10].a)Hövener J-B, Chekmenev EY, Harris KC, Perman WH, Robertson LW, Ross BD, Bhattacharya P, Magn. Reson. Mater. Phys. Biol. Med 2009, 22, 111–121; [DOI] [PMC free article] [PubMed] [Google Scholar]; b)Zacharias NM, Chan HR, Sailasuta N, Ross BD, Bhattacharya P, J. Am. Chem. Soc 2012,134, 934–943. [DOI] [PMC free article] [PubMed] [Google Scholar]
- [11].Hirsch ML, Kalechofsky N, Belzer A, Rosay M, Kempf JG, J. Am. Chem. Soc 2015,137, 8428–8434. [DOI] [PubMed] [Google Scholar]
- [12].Nelson SJ, Kurhanewicz J, Vigneron DB, Larson PE, Harzstark AL, Ferrone M, van Criekinge M, Chang JW, Bok R, Park I, Reed G, Carvajal L, Small EJ, Munster P, Weinberg VK, Ardenkjaer-Larsen JH, Chen AP, Hurd RE, Odegardstuen LI, Robb FJ, Tropp J, Murray JA, Sci. Transl. Med 2013, 5, 198ra108. [DOI] [PMC free article] [PubMed] [Google Scholar]
- [13].Wang J, Zhang CJ, Zhang J, He Y, Lee YM, Chen S, Lim TK, Ng S, Shen HM, Lin Q, Sci. Rep 2015, 5, 7896. [DOI] [PMC free article] [PubMed] [Google Scholar]
- [14].ISMRM Hyperpolarization Study Group, “Polarization Calculator”, can be found under http://www.hyperpolarizationstudygroup.com/Pcalcdhtml, Last accessed on January 11, 2019.
- [15].Allouche-Arnon H, Lerche MH, Karlsson M, Lenkinski RE, Katz-Brull R, Contrast Media Mol. Imaging 2011, 6, 499–506. [DOI] [PubMed] [Google Scholar]
- [16].Macdonald JM, LeBlanc DA, Haas AL, London RE, Biochem. Pharmacol 1999, 57, 1233–1244. [DOI] [PubMed] [Google Scholar]
- [17].Comment A, Rentsch J, Kurdzesau F, Jannin S, Uffmann K, van Heeswijk RB, Hautle P, Konter JA, van den Brandt B, van der Klink JJ, J. Magn. Reson 2008,194, 152–155. [DOI] [PMC free article] [PubMed] [Google Scholar]
- [18].Bojko B, Sulkowska A, Maciazek M, Rownicka J, Njau F, Sulkowski WW, Int. J. Biol. Macromol 2008, 42, 314–323. [DOI] [PubMed] [Google Scholar]
- [19].a)Hawkins D, Pinckard RN, Crawford IP, Farr RS, J. Clin. Invest 1969, 48, 536–542; [DOI] [PMC free article] [PubMed] [Google Scholar]; b)Hawkins D, Pinckard RN, Farr RS, Science 1968,160, 780–781. [DOI] [PubMed] [Google Scholar]
- [20].Honma K, Nakamura M, Ishikawa Y, Mol. Immunol 1991, 28, 107–113. [DOI] [PubMed] [Google Scholar]
- [21].Lee Y, Zeng H, Ruedisser S, Gossert AD, Hilty C, J. Am. Chem. Soc 2012,134, 17448–17451. [DOI] [PubMed] [Google Scholar]
- [22].Bornet A, Pinon A, Jhajharia A, Baudin M, Ji X, Emsley L, Bodenhausen G, Ardenkjaer-Larsen JH, Jannin S, Phys. Chem. Chem. Phys 2016,18, 30530–30535. [DOI] [PubMed] [Google Scholar]
- [23].Lee Y, Zacharias NM, Piwnica-Worms D, Bhattacharya PK, Chem. Commun 2014, 50, 13030–13033. [DOI] [PMC free article] [PubMed] [Google Scholar]
- [24].a)Roth M, Bargon J, Spiess HW, Koch A, Magn. Reson. Chem 2008, 46, 713–717; [DOI] [PubMed] [Google Scholar]; b)Roth M, Koch A, Kindervater P, Bargon J, Spiess HW, Munnemann K, J. Magn. Reson 2010, 204, 50–55. [DOI] [PubMed] [Google Scholar]
Associated Data
This section collects any data citations, data availability statements, or supplementary materials included in this article.


