Abstract
Ultrasound shear wave elastography is an imaging modality for noninvasive evaluation of tissue mechanical properties. However, many current techniques overestimate a lesion’s dimension or shape especially when small inclusions are taken into account. In this study we propose a new method called local phase velocity based imaging (LPVI) as an alternative technique to measure tissue elasticity. Two separate acquisitions with ultrasound push beams focused once on the left side and once on the right side of the inclusion were generated. A local shear wave velocity is then recovered in the frequency domain (for a single frequency or frequency band) for both acquired data sets. Finally, a two-dimensional shear wave velocity map is reconstructed by combining maps from two separate acquisitions. Robust and accurate shear wave velocity maps are reconstructed using the proposed LPVI method in calibrated liver fibrosis tissue mimicking homogeneous phantoms, a calibrated elastography phantom with stepped cylinder inclusions and a homemade gelatin phantom with ex vivo porcine liver inclusion. Results are compared with an existing phase velocity based imaging approach and a group velocity based method considered as the state-of-the-art. Results from the phantom study showed that increased frequency improved the shape of the reconstructed inclusions and contrast-to-noise ratio between the target and background.
Keywords: Shear wave elastography (SWE), ultrasound, soft tissue, local wavenumber, phantom, lesion, imaging
I. Introduction
Soft tissue pathology can cause changes in mechanical properties. Many methods for measurement of soft tissue mechanical properties have been developed over the past two decades. One class of methods called shear wave elastography (SWE) encompasses various different implementations including supersonic shear imaging, comb-push ultrasound shear elastography, among others [1]–[5]. These methods use acoustic radiation force to generate shear waves and ultrasound techniques to measure the shear wave motion.
These methods have been employed for imaging various tissues including liver, breast, thyroid, skeletal muscle, kidney, and prostate [5]. Liver fibrosis staging has been a primary use of SWE techniques that has had good success [6]. SWE has also been widely used for characterizing tumors in breast, thyroid, and prostate [7]–[9]. In SWE applications related to cancer imaging in breast, thyroid, liver, it has been found that inclusions are typically stiffer than the normal surrounding tissue [10]–[13]. These methods have been used to characterize lesions as benign and malignant and have found that typically malignant lesions are stiffer than benign lesions [7], [9], [10], [12]. In clinically implemented versions of SWE a few assumptions are made about the medium. These include that the material is elastic, homogeneous, isotropic, and incompressible. In the case of imaging inhomogeneities that are finite-sized, resolution is an important factor to take into account.
Among the various methods used to implement SWE measurements, there are also numerous techniques for reconstructing the mechanical properties, particularly the shear wave velocity. Most of the methods are based on time-domain data and measuring the time-of-flight of the shear wave in a local sense. Different features of the shear wave motion are used for estimation of the shear wave velocity including the peaks of the displacement or velocity waveforms [14]–[16]. Additionally, cross-correlation of time signals is used [2], [3], [17] and the size of the window used can affect the shear wave velocity results [15].
Another way to analyze the data for estimation of shear wave velocity is using frequency-domain approaches. Typically, frequency-domain assessment of shear wave velocity has been performed with phase gradient or Fourier transform methods [18], [19]. These methods have been used to estimate phase velocity dispersion due to material viscoelasticity and geometry [20]–[23]. Most of these measurement techniques, as implemented, use a limited spatial extent both in the lateral and axial directions. To fill that void, efforts have been made to extend these methods to create images of the phase velocity or viscoelastic properties such as the shear wave attenuation and material viscosity [24], [25].
We are proposing to use a method called local wavenumber imaging for the purposes of creating images of phase velocity in soft tissues. This method has been effectively used in the field of non-destructive structural health monitoring to image structural features and defects [26], [27]. Local estimates of the wavenumber of propagating guided Lamb waves were utilized. Wavenumber changes as a function of spatial position were studied where a short space Fourier transform has been developed to obtain a space-frequency-wavenumber representation [28], [29]. New wavenumber components created by abrupt wave changes at the structural discontinuity were identified in the frequency-wavenumber spectra [27].
The rest of the article is organized as follows. First, we present the Local Phase Velocity based Imaging (LPVI) method as applied for the shear wave velocity mapping. This method employs techniques from local wavenumber imaging and applies them to shear waves in soft tissues. In comparison to the local wavenumber imaging used in the non-destructive testing field the LPVI method does not require wavenumber filtering applied to guided waves since we are typically exciting only one wave mode (shear wave). The LPVI method was tested on data from numerical simulations and experimental measurements. The robustness of the method was tested in calibrated liver fibrosis tissue mimicking homogeneous phantoms and a calibrated elastography phantom with stepped cylinder inclusions. We also tested the method on data from a homemade gelatin phantom with an ex vivo porcine liver inclusion. In this paper we use simulations and phantoms that use inclusions that are softer and stiffer than the background material to address the clinically relevant problem of cancer lesion characterization. Results from these phantoms will be presented. The results will be followed with a discussion and conclusions.
II. Materials and Methods
In this section, the newly proposed LPVI method is adopted for shear wave phase velocity estimation. The resolution capabilities of LPVI are tested with the local interaction simulation approach (LISA) numerical elastic models, and experimentally using the CIRS elastic tissue-mimicking phantoms and a gelatin phantom. First, we provide the whole procedure for the LPVI method in Sec. II–A. Major steps of the technique are also presented in a flow chart, in Fig. 1 for clarity. A description of the numerical LISA elastic phantom is described in Sec. II–B. The experimental CIRS and gelatin phantoms used in our study are introduced in Secs. II–C, II–D and II–E, respectively. Appropriate examples are provided in order to show LPVI robustness in Sec. III.
Fig. 1:
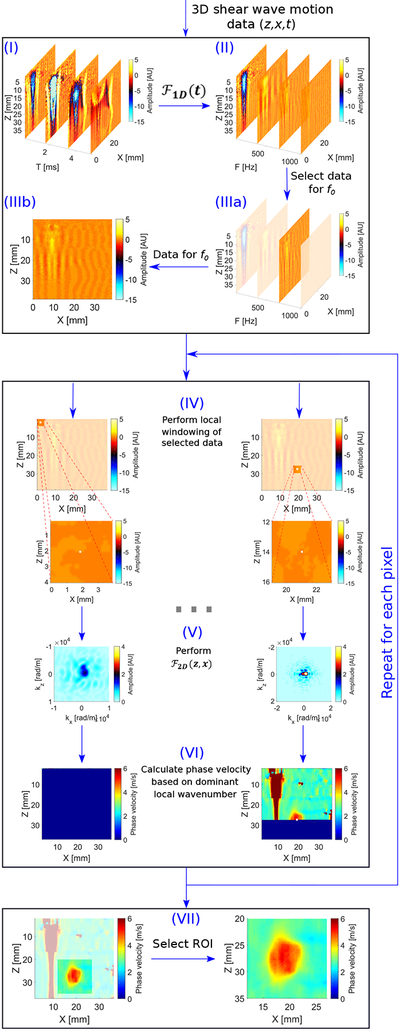
Flow chart of the proposed LPVI approach presented in this study. Main steps of the LPVI can be summarized as follow: (I) acquire a 3-D shear wave motion data (z,x,t); (II) transform spatio-temporal data into a frequency domain; (III) select the spatial spectrum at a specified frequency f0; (IV) perform a short space 2-D FT in space domains; (V) perform 2-D FT on the windowed wavefield regions; (VI) calculate spatial distribution of the phase velocity of the shear wave motion for a particular frequency or frequency band; (VII) select ROI.
A. Local-Phase-Velocity-based Imaging Approach
The newly proposed LPVI approach deals in a “k-space” (frequency-wavenumber) domain where additional information about shear wave modes and wavenumber distribution can be achieved in comparison to the time-space domain. Generally, the transformation of the spatio-temporal particle motion v(z, x, t) to the k-space domain is accomplished using the three-dimensional (3-D) Fourier transform
| (1) |
where, V (kz, kx, f) is the resulting 3-D k-space representation in terms of the frequency and wavenumber vectors, kz and kx. It is well known that frequency, f, is a counterpart of time domain whereas, wavenumbers kz and kx are the counterparts of the spatial dimensions z and x, respectively. With the obtained spectrum data V(kz, kx, f), a wavenumber spectrum can be acquired for a particular frequency f0(V(kz, kx, f)).
In the proposed approach the transformation of the spatiotemporal particle motion υ (z, x, t) is done in progressive steps. In summary, the steps of LPVI used for shear wave phase velocity imaging can be summarized as follows:
Step 1: The spatio-temporal particle motion υ (z, x, t) is transformed to the frequency domain using the one-dimensional Fourier transform as follows
| (2) |
where is the resulting particle velocity motion in the frequency-domain (marked as II in the flow chart in Fig. 1). Please note that at this step spatial domains of remained unchanged. With the acquired spectrum data , a wavefield data can be obtained for a particular frequency . This step is marked in flow chart the as (IIIa) in Fig. 1. A selected set of data (IIIb) shows the spatial spectrum at a specified frequency f0.
Step 2: Perform a short space two-dimensional (2-D) Fourier transform in space domains z and x [29], [30]. This step entails breaking down the wavefield into small segments over the spatial dimensions before Fourier transformation and retain the spatial information. In order to do this, the wavefield is multiplied by a window function which is non-zero for only a small region in space while constant over the entire frequency domain, which can be described as follows
| (3) |
where is a 2-D cosine-tapered window (i.e. Tukey window), which can be defined as
| (4) |
where defines a 1-D window applied along the generic coordinate ξ. The 1-D cosine-tapered window is used for two spatial directions in a form
| (5) |
where ξ0 and h denote the center and width of the window, respectively. is the retained spatial vector of the windowed part. The parameter α defines the shape of the window. Particularly, for α = 1 the window becomes a rectangular window, while α = 0 leads to a Hanning window. The Tukey window is specifically convenient in this matter as it provides the flexibility needed to avoid losing information near the window edges. At the same time this reduces truncation distortions and leakage errors associated with a sharp rectangular window. Based on trial and error analysis in our study we used α = 0.25 taper width across the spatial domains.
When the window slides along the spatial dimensions, windowed wavefield regions, , are generated. This action is marked as (IV) in Fig. 1.
The is applied to the region, resulting in a set of 2-D wavenumber (kz, kx) spectra for the particular frequency f0 - (V) in the flow chart - which mathematically is given as
| (6) |
The resulting spectra are indexed by the locations of the window such that the spatial information is retained.
Step 3: The final step of LPVI approach is to calculate the spatial distribution of the phase velocity of the shear wave motion for the frequency f0 - (VI) in Fig. 1. From the spectra, for all spatial parts, the phase velocity is calculated as
| (7) |
where |k| is a wavenumber magnitude described as
| (8) |
and k(z:m) and k(x:m) arguments are found using
| (9) |
Based on Eq. (7) the full field-of-view (FOV) of phase shear wave velocity image is reconstructed - (VII) in Fig. 1. It is worth noting that the frequency f0 can be a single frequency value as well as a frequency band (fband) centered about f0 (f0 − fb, …, f0, …, f0 + fb). When the frequency band is considered the phase velocity can be defined through an equation
| (10) |
where fi (i = 1, 2, …, N) is a frequency band centered about f0. Hence, Eq. 10 represents a phase shear wave velocity image at each location over selected frequency band. When fband = f0, Eq. 10 simplifies to Eq. 7.
The above procedure has been implemented in MATLAB to show and evaluate the principle and its basic performance. The FFT length in time and spatial dimensions z and x was 1024. We conducted tests using this new method on homogeneous phantoms as well as phantoms containing various types of cylindrical inclusions. For the inclusions study we used LISA numerical phantom data, as well as the CIRS and gelatin phantom experimental data. Results using LPVI for the CIRS with inclusions data were compared with the results obtained using phase velocity method described in [24] and the 2-D group velocity method with Anderssen-Hegland averaging [3]. Gelatin phantom data were compared with the 2-D group velocity method [3]. The results of these tests have demonstrated the potential of this approach for handling shear wave elastography with robust results.
1). The final image reconstruction:
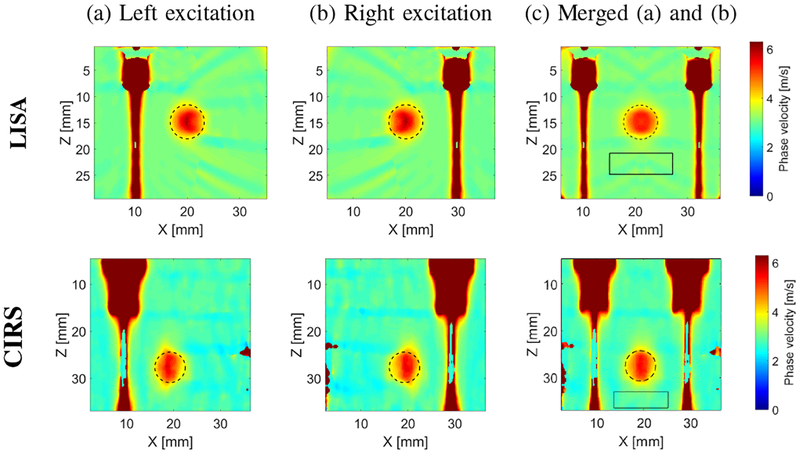
Figure 2 shows the 2-D shear wave phase velocity maps reconstructed from LISA numerical (top row) and CIRS experimental (bottom row) phantoms, for the inclusion with diameter of 6.49 mm, using the proposed LPVI technique. The 2-D spatial window , described by Eq. (4), used in this case was set to 4.5 × 4.5 mm length. A single frequency, f0 = 903 Hz was chosen. Figure 2a shows the reconstructed shear wave phase velocity map (using Eq. (7)) for the push beam excitation generated on the left side of the L7–4 probe, using 32 active elements. Figure 2b displays a similar map however, for the push beam excitation generated on the right side of the same probe. A combined map from images 2a and 2b is presented in Fig. 2c. The combined image is formed by averaging two images, 2a and 2b. On each map the actual inclusion position, obtained from the numerical phantom definition or B-mode image, is marked by a dashed line. Rectangles with solid lines show the selected background region for mean and SD of phase velocity investigation.
Fig. 2:
Two-dimensional shear wave phase velocity image reconstruction based on two separate excitation push beams, using the proposed LPVI technique. Used spatial window size was 4.5 × 4.5 mm and selected frequency, f0 = 903 Hz. Results for the (a) left and (b) right excitations. (c) final image map obtained based on combined results from (a) and (b). Presented results are for the CIRS phantom with an inclusion Type IV.
In our study we used only two maps (with left and right push beam excitations) for the final image reconstruction. Nevertheless, for some cases use of more maps reconstructed from various data acquisitions could provide improvements.
B. Numerical LISA Elastic Phantom Description
It is well known that, in practice, soft tissues are almost incompressible (their volume is conserved under load) [31] and their shear modulus, μ, is commonly several orders of magnitude smaller than the second Lame constant, i.e., λ (μ≪λ). Hence, an isotropic, homogeneous elastic material, which can be expressed using a constitutive relation (the stress-strain relation) in terms of two independent moduli as
| (11) |
simplifies to [31]
| (12) |
for the linear relationship between applied one-dimensional (1-D) stress and the axial strain along the same direction where the proportionality constant is the elastic modulus. The subscripts i and j represent the Cartesian coordinates, and δij is the Kronecker delta function. ε is a symmetric strain tensor and E is Young’s modulus.
To produce digital phantoms of elastic materials with circular inclusions for which the mechanical properties are known, we used a two-dimensional implementation of LISA. The LISA method has not been used for SWE applications before. Nevertheless, its advantages have been shown for guided wave propagation modeling in mechanical structures [32]–[36].
LISA is an algorithm that was proposed in physics for wave propagation in complex media with sharp impedance alterations. LISA was originally designed for use with a supercomputer with thousands of parallel processors and therefore it is well suited for parallel processing.
LISA can be used for wave propagation in any heterogeneous material of arbitrary shape and complexity. The method discretizes the structure under investigation into a grid of cells. The material properties are assumed to be constant within each cell but may vary between cells. If the cells are taken to be sufficiently small, this assumption represents a good approximation to realistic complex media. The same geometry of the phantom - as used in the experimental study in Sec. II–D - was modeled in numerical simulations. The entire model was discretized into square cells containing material data. A finite difference (FD) scheme is used to calculate spatial derivatives in these cells, leading to iterative principle displacement equations. The entire derivation scheme is described in detail in [32]–[34].
LISA has several advantageous. One of the major advantages of the LISA algorithm when used for wave propagation is the local interaction nature of boundaries in the model [37], [38]. The sharp interface model (SIM) was used to average physical properties at interface grid points which represent intersections of four elementary cells. In other words, the SIM imposes perfect contacts of displacements and stresses at interfaces and discontinuities. The SIM allows for a more physical and unequivocal treatment of interface discontinuities for different layers of material than standard FD schemes. The latter demands parameter smoothing across material interfaces, which depends on the applied scheme and severe errors or ambiguities may result. Therefore FD is not very precise for sharp interfaces of high impedance mismatch. In LISA physical parameter smoothing across material interfaces is applied, leading to more accurate results when treating wave propagation problems in complex media. This allows an exact treatment of any kind of discontinuity.
Another main advantage of LISA is that the method is designed to take full advantage of parallel computing, such as provided by the Connection Machine [39]. With a proper adaptation of the formalism, the speed-up can be equal to the number of processors. From a conceptual point of view, the idea of LISA is to transfer the local interaction among the cells directly to the processors, without passing through a partial differential equation [32], [33]. An additional important difference between LISA and conventional FD method is that the former does not require the use of many points in the iteration procedures. In contrast FD requires many formulas to reduce the number of mesh points.
The acoustic radiation force push beam was simulated using Field II [40]. The array that was simulated was a linear array with element width of 0.283 mm, element height of 7 mm, element pitch of 0.308 mm, elevation focus of 25 mm, center frequency of 5.0 MHz, and using a medium attenuation, α, of 0.5 dB/cm/MHz and sound speed, c, of 1540 m/s. The intensity, I, was calculated by squaring the pressure to be used in the body force defined by F = 2αI/c [4]. A focal depth of 30 mm was used for the push beams with a fixed f-number (F/N) of 2.
The elastic domains were uniformly spatially sampled at 0.15 mm. The dimensions of the simulated domain are x = ±50 mm in the lateral direction and z = 50 mm in the axial dimension Material properties studied in this work corresponded to the mechanical properties of the CIRS phantom with an inclusion Type IV provided by the manufacturer (see Sec. II–D for more details). The background Young’s modulus was set to 25 kPa and the circular inclusion Young’s modulus was set to 80 kPa. The density was set to 1000 kg/m3 and Poisson’s ratio was set to be 0.499 for both materials, i.e. background and the inclusion, respectively. In our study, with the numerical LISA phantom, we investigated an inclusion size of 6.49 mm diameter only.
In the LISA implementation, similar to the standard FD scheme, the future time step is calculated as a combination of the same quantities taken in the already calculated time steps. As a result, the algorithm can be parallelized very efficiently. We used parallel computation technology offered by modern graphics processing units (GPUs) and compute unified device architecture (CUDA) used in low-cost graphical cards for solving LISA numerical models. The entire process was implemented in MATLAB (Mathworks, Natick, MA) software.
C. Liver Fibrosis Tissue Mimicking Homogeneous Phantoms
Liver fibrosis tissue mimicking homogeneous, elastic phantoms (Model 039, CIRS Inc., Norfolk, VA, USA) were used in this examination to test the influence of the window size in the LPVI approach for shear wave phase velocity reconstruction. Phantoms have a sound speed of 1540 m/s and ultrasound attenuation of 0.5 dB/cm/MHz. Stiffnesses of all phantoms tested in this paper are 10, 25 and 45 kPa with a precision of ±4% (according to the information provided by manufacturer). The push duration was 400 μs and the push frequency was 4.09 MHz. The push beam was generated by 32 active elements shifted towards the end of the L7–4 probe. Two acquisitions were taken: (1) for the push beam located on the left side of the probe and (2) for the push beam located on the right side of the probe. Plane wave imaging was used for motion detection with a frame rate of 11.765 kHz. The data was reconstructed with axial and lateral resolution of 0.154 mm. The motion (shear wave particle velocity) was calculated from the in-phase/quadrature data using an autocorrelation algorithm [41].
D. CIRS Phantom With Inclusions
The CIRS elastography phantom with inclusions (Model 049A, CIRS Inc., Norfolk, VA, USA) was used in this study to test robustness of LPVI approach for shear wave phase velocity measurement. The phantom has a sound speed of 1540 m/s, ultrasound attenuation of 0.5 dB/cm/MHz and 8 stepped cylinder masses with 6 different sizes and locations centered about 30 and 60 mm from the phantom surface. According to CIRS Inc., the stiffness of the background is 25 kPa and the stiffness of the inclusions are 8, 14, 45 and 80 kPa for lesions Type I, Type II, Type III and Type IV, respectively. In this study we tested all types of lesions for acoustic radiation force push beams focused at 30 mm. The push duration was 400 μs and the push frequency was 4.09 MHz. The push beam was generated by 32 active elements shifted by 16 elements from the end of the L7–4 probe. Push beams were placed on each side of the inclusion. Data was acquired and processed in the same way as the liver fibrosis phantoms.
E. Gelatin Phantom With Ex Vivo Porcine Liver Inclusion
A gelatin phantom with an excised porcine liver inclusion was also used to test the robustness of LPVI approach. The gelatin phantom was made first and a cylinder was cored from the gelatin background. Then, the porcine liver (after placing in 10% formalin for 1 hour) was situated inside the gelatin phantom in a form of cylinder with an approximate 10 mm diameter. In order to ensure mechanical coupling between the tissue cylinder and the gelatin the tissue diameter was prepared to be slightly larger than previously made hole in gelatin. The acoustic radiation force push beams were focused at 20 mm with 32 active elements. The push duration was 400 μs and the push frequency was 4.09 MHz. A plane wave imaging compounding method was used to improve the signal-to-noise of shear wave tracking [42]. Three frames at different steering angles (−3°, 0°, +3°) were used to obtain each imaging frame, giving an effective frame rate of 4.166 kHz.
III. Results
A. The Local Phase Velocity based Imaging method investigation - Homogeneous Case Study
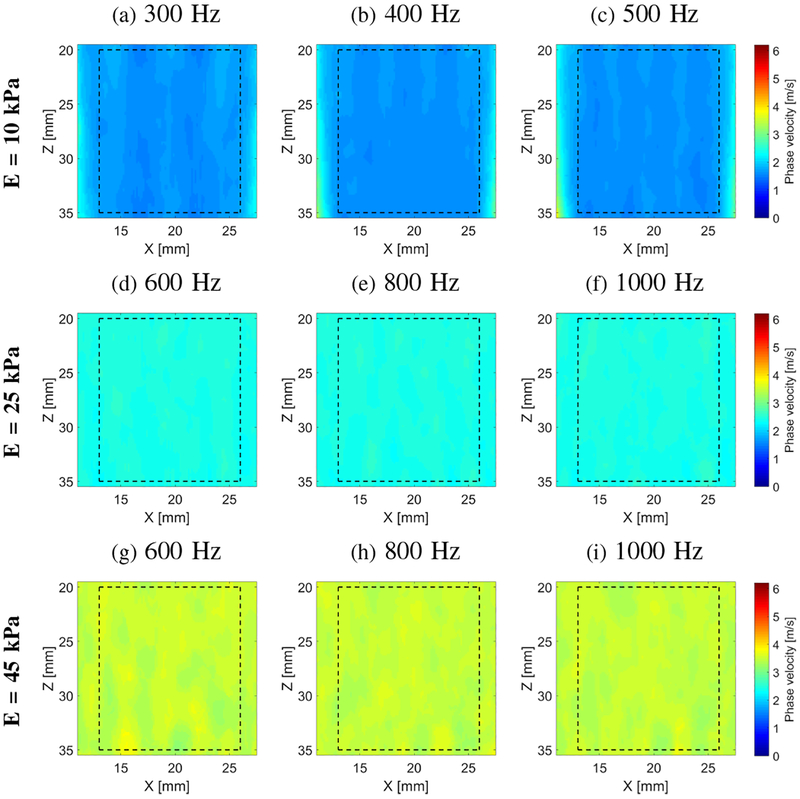
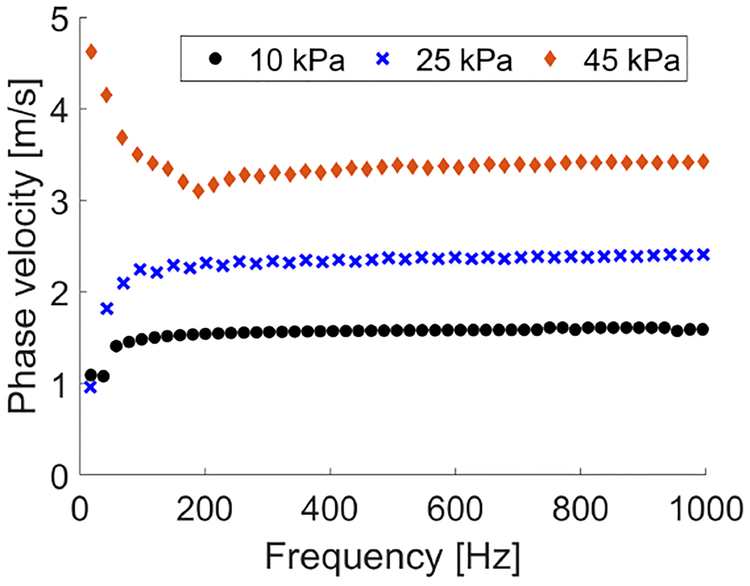
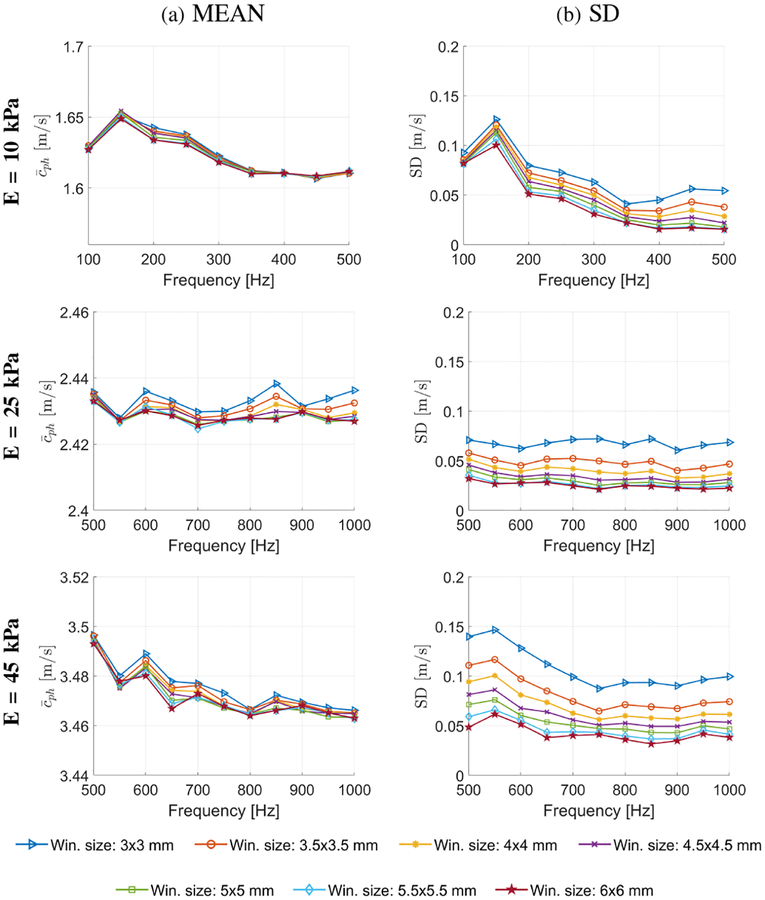
Figure 3 presents final 2-D shear wave velocity images for the homogeneous liver fibrosis tissue mimicking phantoms reconstructed using the LPVI approach. The final images were obtained by averaging reconstructed intermediate maps from two acquisition (as described in Sec. II–C). The spatial window size of 3.5 × 3.5 mm was used. Maps for three different frequencies are presented. We did not expect any changes in reconstructed images in Fig. 3 with varying frequency because the phantoms are considered to be elastic. For comparison dispersion phase velocity curves for the focal depth of 29.6 mm calculated using classical 2D-FT method are shown in Fig. 4. For each phantom a mean shear wave velocity and standard deviation (SD) were calculated within ROIs marked in Fig. 3. Results are presented in Fig. 5. These metrics were calculated for various frequencies from 100 to 500 Hz for E = 10 kPa and from 500 to 1000 Hz for E = 25 and 45 kPa phantoms, respectively and the spatial window, Wz,x, dimensions varying from 3.0 × 3.0 to 6.0 × 6.0 mm. It can be seen that with increasing the spatial window SD decreases for all phantoms. Larger window size contains data from a larger spatial area whereby reconstructed images are smoother compared to smaller Wz,x. Additional ROI metrics (bias, mean, median, SD, variance, minimum, and maximum) are tabulated in Tables S1, S2 and S3 and presented in Fig. S1 in the Supplementary Material.
Fig. 3:
Two-dimensional shear wave phase velocity images for the homogeneous liver fibrosis tissue mimicking phantoms. Phase velocity images were calculated based on LPVI approach for the spatial window size of 3.5 × 3.5 mm. Dashed lines present a ROI selected for all statistics calculations.
Fig. 4:
Dispersion phase velocity curves calculated for the homogeneous liver fibrosis tissue mimicking phantoms using the 2D-FT method for the focal depth of 29.6 mm.
Fig. 5:
Mean and standard deviation of the phase velocity computed for the homogeneous liver fibrosis tissue mimicking phantoms for various frequencies and the spatial window dimensions. The mean and SD were calculated for ROIs presented in Fig. 3.
B. The Local Phase Velocity based Imaging method investigation - Inclusion Study
1). A mean and SD of phase velocity investigation:
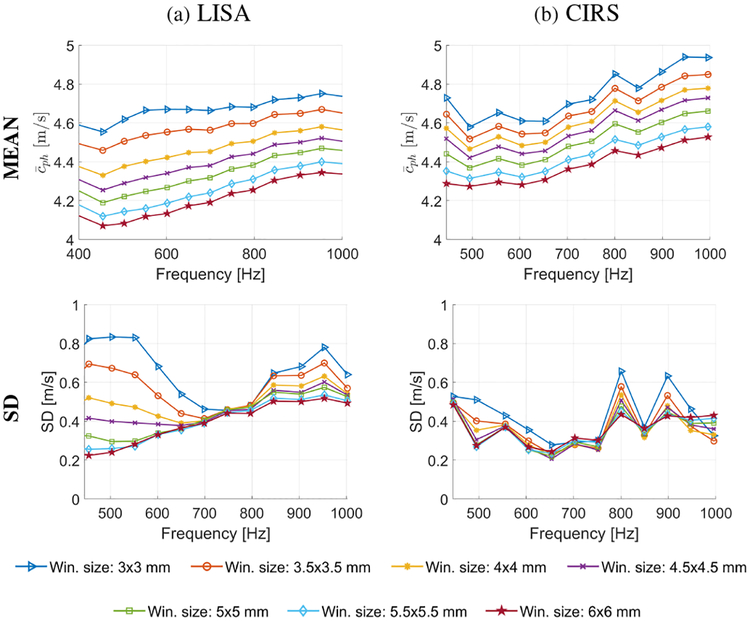
Figure 6 shows the mean, , (top row) and SD (bottom row) of shear wave velocity calculated within the inclusion of 6.49 mm diameter size. The mean velocity and SD were computed separately for various frequencies from 450 to 1000 Hz with a frequency step of 50 Hz and for different sizes of the spatial window Wz,x (from 3.0 ×3.0 to 6.0 × 6.0 mm). Figure 6a shows results for the numerical phantom data whereas, Fig. 6b represents data for the experimental CIRS phantom. For both cases progressive increase with increasing frequency was observed. This behavior is observed for all spatial windows dimensions investigated. Smooth trends are present for the numerical data. The experimental results exhibit a drop in for the frequency of 550 Hz. The progressive mean phase velocity increase in the investigated frequency range could be attributed to the change of wavelength. For higher frequencies shorter wavelengths exist whereby, more wavelengths or a higher fraction of a wavelength are present within the inclusion.
Fig. 6:
Mean (top row) and standard deviation (bottom row) of phase velocity computed within an inclusion size of 6.49 mm diameter for various frequencies and the spatial window dimensions, calculated for the (a) LISA numerical and (b) CIRS experimental data.
Increasing the spatial window size causes a decrease in the mean phase velocity. This behavior is caused by smoothing at the edges of the inclusion. The phase velocity is smoothed to a greater extent when larger spatial windows are used. Moreover, the SD decreases with increasing spatial window size for LISA and CIRS phantoms data.
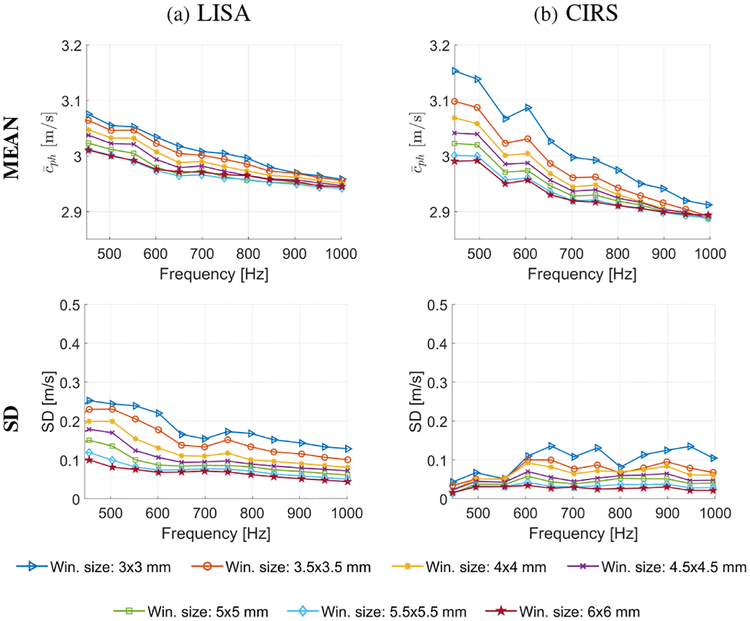
Figure 7 shows the mean (top row) and SD (bottom row) of shear wave phase velocity computed for the background material, for the numerical LISA data (Fig. 7a) and the experimental CIRS phantom (Fig. 7b), respectively. The mean and SD of phase velocity are presented for the frequency range from 450 to 1000 Hz, as in a case of the inclusion. Results for seven different spatial window dimensions, as in the previous case varying from 3.0 × 3.0 to 6.0 × 6.0 mm, are depicted. In contrast to the inclusion (Fig. 6), the mean shear wave phase velocity for the background decreases with the increase of the frequency. Similar behavior was observed for the homogeneous phantom data with elasticity of 45 kPa shown in Fig. 5a, bottom row. A greater drop in mean wave velocity is observed when a smaller window size is used for LISA numerical (Fig. 7a) and CIRS experimental (Fig. 7b) data. Again, the measured shear wave phase velocity magnitude slightly decreases with increasing spatial window dimension. The SD also decreases with larger spatial window size. Analogous behavior was observed for experimental liver fibrosis tissue mimicking phantoms in Sec. III–A, Fig. 5. Additional bias investigation for the inclusion and background for LISA and CIRS data are presented in Figs. S2 and S3, respectively, in the Supplementary Material.
Fig. 7:
Mean (top row) and standard deviation (bottom row) of phase velocity of the background computed for various frequencies and the spatial window dimensions, calculated for the (a) LISA numerical and (b) CIRS experimental data.
2). Window size and frequency selections investigation:
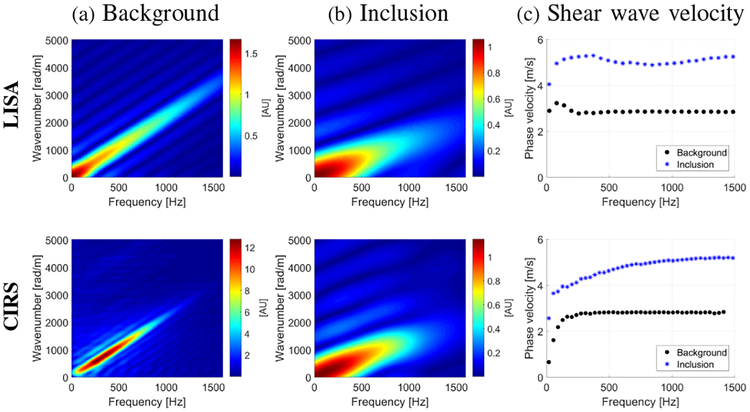
Figure 8 shows the k-space and the phase velocity curves for the background and within the inclusion that were investigated in Figs. 6 and 7 for LISA (top row) and CIRS (bottom row) phantoms data, i.e. the inclusion diameter of 6.49 mm. The dispersion curves for the background were calculated for 27.7 mm of the lateral extent whereas, within the inclusion for 6.3 mm, respectively.
Fig. 8:
The k-space spectra computed for the LISA (top row) and CIRS (bottom row) phantoms for a (a) background and (b) within 6.49 mm Type IV inclusion, calculated along lateral direction at a single axial point. (c) phase velocities for corresponding the k-space spectra presented in (a) and(b), respectively.
A main shear wave mode exists up to approximately 1500 Hz for both, the background and the inclusion Type IV materials. For the higher frequencies the difference between wavenumbers (resulting phase velocities) is larger. Faster shear wave velocity is observed within the investigated inclusion in comparison to the surrounding background material.
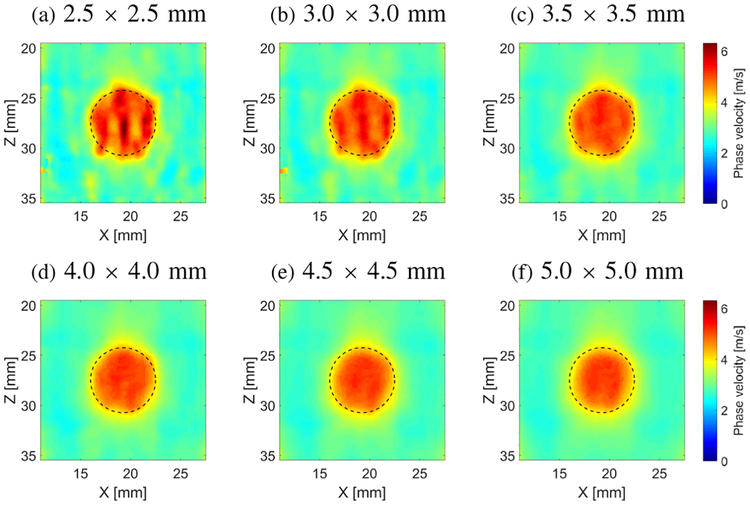
Figure 9 shows the final reconstructed 2-D images (merged from the left and right excitation maps of the CIRS phantom data) of the shear wave phase velocity for the inclusion size of 6.49 mm, calculated for 996 Hz and various spatial window dimensions starting from 2.5 × 2.5 (Fig. 9a) to 5.0 × 5.0 (Fig. 9f) mm, respectively. Here, only a region-of-interest (ROI) is presented instead of the full FOV since we are exclusively interested in inclusions shape and their mechanical properties evaluation in this paper.
Fig. 9:
Two-dimensional shear wave phase velocity images, reconstructed for the inclusion size of 6.49 mm calculated for a selected frequency of 996 Hz and various spatial window dimensions equal to (a) 2.5 × 2.5, (b) 3.0 × 3.0,(c) 3.5 × 3.5, (d) 4.0 × 4.0, (e) 4.5 × 4.5 and (f) 5.0 × 5.0, respectively. Presented results are computed for the CIRS phantom with an inclusion Type IV. Dashed lines present a true inclusion location estimated from B-mode.
The inclusion shape reconstructed becomes more circular with increasing the spatial window size. When the spatial window dimension is small (2.5 × 2.5 or 3.0 × 3.0 mm for the investigated case) shape distortions are observed in 9a and 9b. Nevertheless, these distortions are very small, approximately 0.5 mm, and still the shape of the inclusion is preserved. Additionally, higher shear wave phase velocity magnitude is observed in the middle of the inclusion. It is not entirely uniform inside the imaged region in Figs. 9a and 9b. The aforementioned drawbacks give way when larger spatial window dimensions are used (Figs. 9c-9f). For the investigated data, the best image is provided for the 4.0 × 4.0 (Fig. 9d) and 4.5× 4.5 (Fig. 9e) mm window sizes, respectively. If the spatial window becomes large in comparison to the inclusion size, i.e. 5.0 × 5.0 mm (Fig. 9f), the edges of the reconstructed inclusion becomes smoother. The effective size of the inclusion becomes smaller. Small shape distortions are observed at the level of approximately 0.5 mm, for the investigated inclusion phantom type.
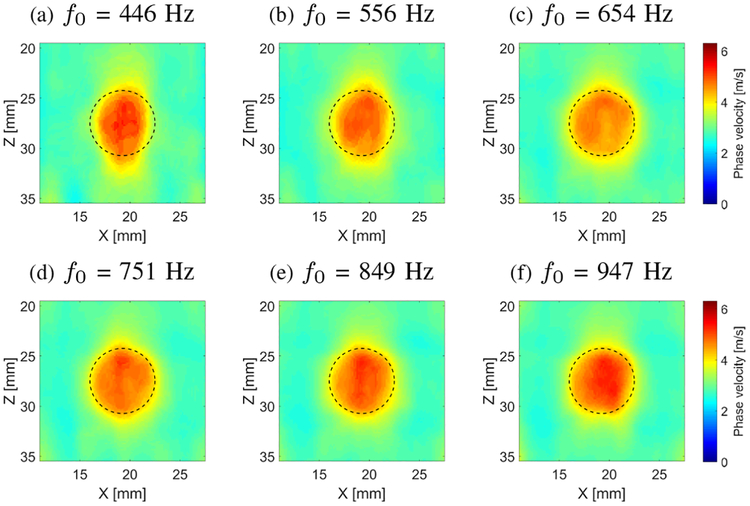
Figure 10 shows 2-D shear wave phase velocity images for the CIRS data, reconstructed for the inclusion size of 6.49 mm diameter. In this case a constant spatial window dimension was used in a size of 4.5 × 4.5 mm. Various frequencies, i.e. 446, 556, 654, 751, 849 and 947 Hz, for the shear wave velocity imaging were selected and presented in Figs. 10a – 10f. For the lowest frequency investigated (Fig. 10a), the reconstructed inclusion image is the least robust in a sense that the reconstructed shape is not circular. With increase in the selected frequency (up to the investigated 947 Hz in this paper, Fig. 10f) image quality improves in the sense of phase velocity is more uniform and shape of the inclusion is reconstructed properly. An oval shape is observed in Figs. 10a and 10b. Moreover, the magnitude of the shear wave velocity increases with increasing frequency, which was presented in Fig. 6 and can be estimated from Fig. 8, providing better contrast in the final results. Outcomes for the higher frequencies, investigated in this study, also eliminate the shape distortions as seen in Fig. 10f.
Fig. 10:
Two-dimensional shear wave phase velocity images, reconstructed for the inclusion size of 6.49 mm, calculated for a constant spatial window dimension of 4.5 × 4.5 mm and various, selected frequencies (f0) (a) 446, (b) 556, (c) 654, (d) 751, (e) 849 and (f) 947 Hz, respectively. Presented images are computed for the CIRS phantom with an inclusion Type IV. Dashed lines present a true inclusion location estimated from B-mode.
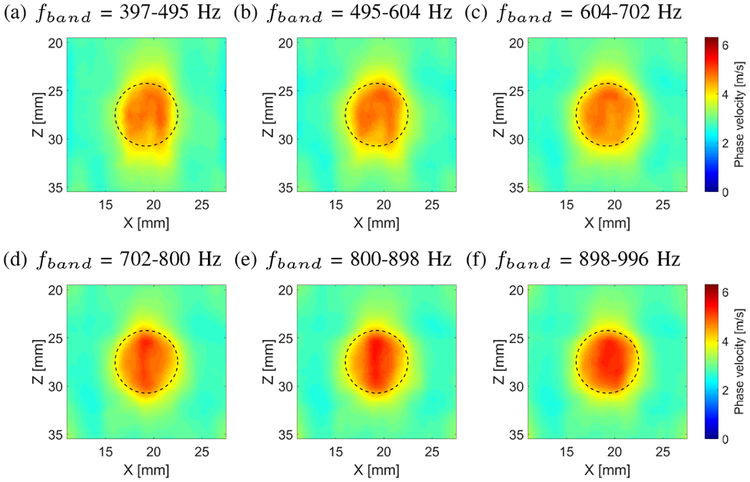
Figure 11 shows the 2-D shear wave phase velocity images, reconstructed for the inclusion size of 6.49 mm, calculated for a constant spatial window dimension of 4.5 × 4.5 mm and various frequency bands(fband) instead of just using a single f0 frequency, as it was the case in Fig. 10. Use of the fband for the shear wave phase velocity image reconstruction, using Eq. (10), causes flattening of the reconstructed shear wave velocity within the inclusion. It can be seen for example, when Fig. 11a is compared with Fig. 10a. The f0 = 446 Hz used for the image reconstruction in Fig. 10a is a center frequency applied for the fband in Fig. 11a. The fband used for the image reconstruction was equal to 397–495 Hz. Similar phase velocity images improvements are observed for the remaining cases, Figs. 11b–11f.
Fig. 11:
Two-dimensional shear wave phase velocity images, reconstructed for the inclusion size of 6.49 mm, calculated for a constant spatial window dimension of 4.5 × 4.5 mm and various frequency bands (fband) (a) 397–495, (b) 495–604, (c) 604–702, (d) 702–800, (e) 800–898 and (f) 898–996 Hz, respectively. Presented images are computed for the CIRS phantom with an inclusion Type IV. Dashed lines present a true inclusion location estimated from B-mode.
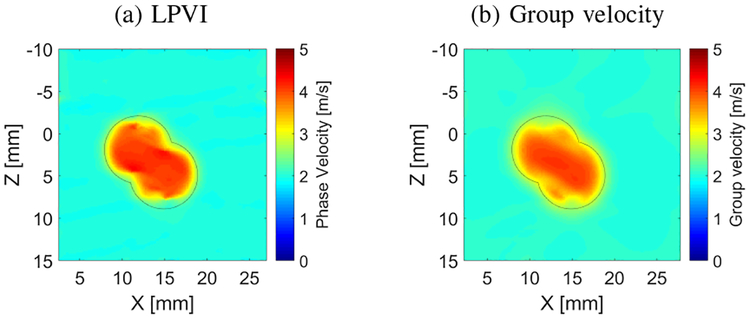
Figure 12 shows the 2-D shear wave phase (Fig. 12a) and group (Fig. 12b) velocity reconstructions for an irregularly shaped inclusion from LISA simulation data. The inclusion had a E = 48 kPa and the background had E = 12 kPa. The LPVI reconstruction done with a frequency band from 700–1100 Hz shows good contrast with a uniform background. The reconstructed mean and standard deviations in the inclusion and background were 3.62±0.55 m/s and 1.98±0.04 m/s, respectively, for the LPVI. Corresponding the signal-to-noise ratio (CNR) [43] was 32.26 dB. This demonstrates that LPVI can be used to reconstruct inclusions that deviate from a perfect circle that may be found in vivo. The group velocity method instead demonstrated mean and standard deviations in the inclusion and background at the level of 3.55±0.43 m/s and 2.42 ± 0.11 m/s, respectively. The CNR was 20.08 dB.
Fig. 12:
Two-dimensional shear wave (a) phase and (b) group velocity images, reconstructed for an asymmetric inclusion, calculated for a constant spatial window dimension of 4.5×4.5 mm. Fig. (a) was reconstructed for a frequency band from 900 to 1100 Hz. Presented images were computed for LISA numerical data.
C. LPVI vs Other Existing Techniques
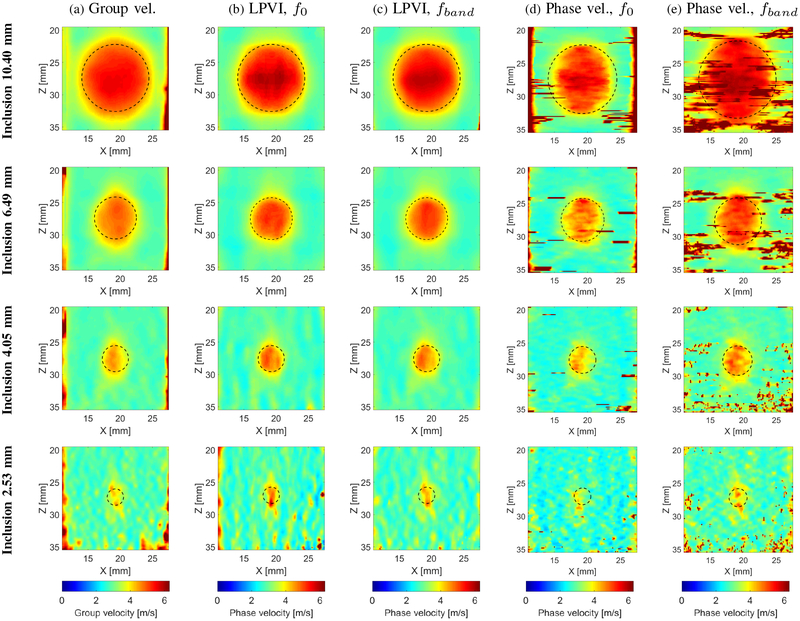
In this section we present a comparison of the proposed LPVI technique with the group velocity based method developed in [3], as well as the phase velocity method described in [24]. In the latter method only lateral shear waves are assumed and reconstructed through a curve fitting approach. All methods were used for the same experimental data where only a single focused push beam was used once on the left and once on the right side of the probe, to capture two acquisitions data, as described in Sec. II–D. The CIRS phantom with four different, Type IV cylindrical inclusion dimensions, i.e.10.40, 6.49, 4.05 and 2.53 mm diameter was tested. Results are presented in Fig. 13. Table I summarizes the measured mean and SD values of shear wave velocity. In addition, the contrast-to-noise ratio between the inclusion and background was calculated for the group velocity and LPVI methods. The CNR was computed as where, and are the mean shear wave of velocity of the inclusion and background, respectively [3], [43], [44]. The parameter Sb is the standard deviation of the shear wave velocity of the background. A region for the CNR calculations of the background was selected on the right side of the inclusion.
Fig. 13:
Two-dimensional shear wave group (a) and phase (b) (e) velocity images for the inclusion size of 10.40, 6.49, 4.05 and 2.53 mm diameter, respectively. Group velocity maps (a) are obtained from the group velocity method described in [3]. Phase velocity images (b)-(c) were calculated based on the approach developed in this manuscript. The f0 used for the calculations was equal to 1050 Hz, whereas fband was selected from 702 to 1106 Hz, respectively. Phase velocity maps for f0 = 800 Hz in (d) were calculated based on the approach presented in [24]. The fband in (e) was chosen the same as for LPVI approach. Presented images are computed for the CIRS phantom with an inclusion Type IV. Dashed lines present a true inclusion location estimated from B-mode. Reconstructed images for additional frequencies can be found in the Supplementary Material in Figs. S4 and S5.
TABLE I:
Shear wave speed and CNR of Type IV inclusion and background from different methods and various inclusions diameter. Methods presented here are: (1) cg with Anderssen-Hegland averaging, (2) LPVI, f0 = 1000 Hz, (3) LPVI, fband for 700 to 1100 Hz, (4) Phase vel. [24], f0 = 1000 Hz and (5) Phase vel. [24], fband for 700 to 1100 HZ.
| 10.40 mm | 6.49 mm | 4.05 mm | 2.53 mm | |||||||||
|---|---|---|---|---|---|---|---|---|---|---|---|---|
| Method | Inclusion mean±SD [m/s] | Background mean±SD [m/s] | CNR [dB] | Inclusion mean±SD [m/s] | Background mean±SD [m/s] | CNR [dB] | Inclusion mean±SD [m/s] | Background mean±SD [m/s] | CNR [dB] | Inclusion mean±SD [m/s] | Background mean±SD [m/s] | CNR [dB] |
| (1) | 4.95±0.44 | 3.00±0.16 | 21.89 | 4.50±0.33 | 2.85±0.06 | 29.03 | 4.16±0.37 | 2.80±0.10 | 22.26 | 3.76±0.35 | 2.80±0.16 | 15.73 |
| (2) | 4.96±0.67 | 2.91±0.12 | 24.36 | 4.64±0.58 | 2.82±0.10 | 24.80 | 4.27±0.36 | 2.74±0.15 | 20.39 | 3.80±0.32 | 2.72±0.30 | 11.06 |
| (3) | 4.90±0.64 | 2.91±0.13 | 23.55 | 4.57±0.44 | 2.80±0.08 | 26.72 | 4.27±0.35 | 2.73±0.09 | 24.41 | 3.84±0.39 | 2.71±0.18 | 15.81 |
| (4) | 5.24±0.62 | 3.14±0.67 | 9.94 | 4.77±0.41 | 2.99±0.60 | 9.43 | 4.37±0.41 | 2.91±0.62 | 7.52 | 4.00±0.49 | 2.90±0.59 | 5.36 |
| (5) | 5.32±0.56 | 3.61±0.93 | 5.28 | 4.72±0.46 | 3.54±1.06 | 0.95 | 4.27±0.36 | 3.23±0.82 | 2.10 | 3.81±0.41 | 3.12±0.73 | −0.40 |
Only the selected ROI is shown in Fig. 13. Dashed circles present true positions and profiles of the individual inclusions. Each inclusion was reconstructed with different spatial window size using LPVI, phase velocity and group velocity methods. For all techniques these windows were the same for a given inclusion. The largest inclusion, 10.40 mm, was imaged with Wz,x = 6.0 × 6.0 mm. Succeeding 6.49 and 4.05 mm inclusions were reconstructed with Wz,x = 4.5 × 4.5 and Wz,x = 2.8 ×2.8 mm, respectively. A Wz,x = 1.7 × 1.7 mm was applied for the smallest inclusion, 2.53 mm. Images for the examined inclusions using LPVI were computed for a single frequency equal to 1057, 996, 1080 and 1020 Hz, for the inclusions diameter of 10.40, 6.49, 4.05 and 2.53 mm, respectively (second column of Fig. 13b). Figures presented in the third column of Fig. 13 are based on the LPVI method where the fband was used instead of the single frequency, f0. For all four inclusions investigated the spatial window was kept the same as above and the fband was equal to 702–1106 Hz, resulting in 34 intermediate frequencies with a frequency step equal to 12.219 Hz. Fig. 13d show results reconstructed using the phase velocity method presented in [24]. The phase velocity maps were reconstructed for f0 = 800 Hz. The reconstructions as higher frequencies encountered more substantial noise. The first column of Fig. 13 presents results for the group velocity method used as a state-of-the-art for comparison.
In the group velocity image for the inclusion size of 10.40 mm (Fig. 13a, first row) the size of the inclusion is overestimated around the entirety of the inclusion. In contrast to the phase velocity maps (first row of Figs. 13b and 13c) smaller distortions are observed outside the dashed circles. LPVI maps for the inclusion 6.49 mm (second row of Figs. 13b and 13c) are nearly ideal, with no spatial distortions. The reconstructed inclusion images are located entirely within the dashed circles. The group velocity map instead, for the same inclusion size, exhibits blur in the axial direction as is visible in the first row of Fig. 13a. The reconstructed shape is overestimated in the lateral orientation. The poorest reconstructed image quality was observed for the phase velocity method presented in Fig. 13d where the lateral direction of the inclusion is highly underestimated. Moreover, generally better contrast of the reconstructed inclusion is present for LPVI (fband)in comparison to the group velocity and phase velocity approaches, as summarized in Table I. The CNRs for the group velocity and LPVI, f0, (fband) methods, for the inclusion 10.40 mm, are approximately 22 and 24 (23) dB. However, the phase velocity algorithm provided a CNR of approximately 10 (5) dB. The CNRs for the inclusion 6.49 mm, are approximately 29 and 25 (27) dB for the group velocity and LPVI techniques, respectively. The phase velocity algorithm provided a CNR of 9 (1) dB. With the inclusion size of 4.05 mm all techniques exhibit some flaws. Nevertheless, the LPVI method reflects inclusion shape to a better extent (the shape is more uniform) in comparison to the group velocity and phase velocity methods (third row of Fig. 13). Here, the CNR is in a range from 20 to 22 dB for LPVI and the group velocity methods. At the same time phase velocity method exhibits CNR in a range from approximately 2–7 dB.
The fourth row of Fig. 13 shows results for the smallest CIRS inclusion investigated in this study, i.e. diameter of 2.53 mm. All techniques have difficulties to properly reconstruct the inclusion profile. However, as in the previous cases, the proposed LPVI technique was able to depict the inclusion with higher contrast. The CNR for the smallest inclusion is 16 dB for the group velocity and 11 (16) dB for the LPVI technique. The phase velocity algorithm produced CNR of 5 (−1) dB. The shape of the reconstructed images is not identical to the expected circular shape. However, it more closely resembles the exact shape (fourth row of Figs. 13b and 13c) in comparison to the time-domain and phase velocity methods (fourth row of Figs. 13a and 13d). Moreover, the proposed LPVI approach exhibits lower background noise, caused by selection of small spatial window size, in comparison to other techniques. Application of the fband instead of using just only a single frequency, f0 in LPVI method, reduces this noise to an even greater extent. The difference can be seen in Figs. 13b and 13c fourth row, respectively, where smaller background noise is observed. More reconstructed 2-D phase velocity images for other frequencies are presented in the Supplementary Material in Figs. S6 and S7. Additionally, mean, median, standard deviation, variance, maximum and minimum values of shear wave velocity are tabulated in the Supplementary Material in Tables S4 and S5.
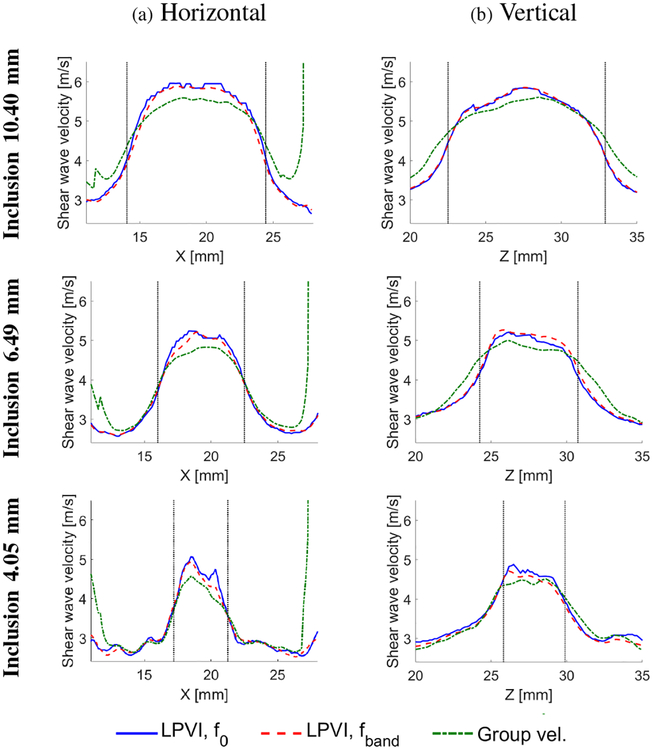
Figure 14 presents a horizontal (lateral, Fig. 14a) and vertical (axial, Fig. 14b) cross-section profiles for three of the largest inclusions presented in Fig. 13, i.e. 10.40, 6.49 and 4.05 mm, respectively. The edge reconstruction can be observed in Fig. 14 and compared with Fig. 13. Each figure presents reconstructed cross-section profiles based on the LPVI method for the single f0 frequency and the frequency band, fband. The f0 and fband are the same as used for the velocity images reconstructed in Fig. 13. Results for the group velocity method are also included. Vertical dotted, black lines correspond to the edges of the inclusions estimated based on the B-mode images.
Fig. 14:
Cross section profiles for the three inclusions presented in Fig. 13, in a (a) horizontal and (b) vertical directions, respectively. Vertical dotted, black lines correspond to the edges of the inclusions estimated based on the B-mode images.
The reconstructed profiles for the LPVI results where f0 or fband were used are very similar. The group velocity method reconstructed edges with less sharpness in the horizontal direction for the inclusion of 10.40 mm (first row of Fig. 14a). The remaining two inclusions are reconstructed with nearly the same sharpness as by LPVI method in the horizontal direction. However, the inclusions’ profiles in the vertical direction are wider for the group velocity method. For the inclusions of 10.40 and 6.49 mm diameter the transition representing the edges of the shear wave velocity is broad for the group velocity method. The LPVI method provides a shorter transition region. The 4.05 mm inclusion profiles in the vertical direction are similar for the LPVI and the group velocity techniques.
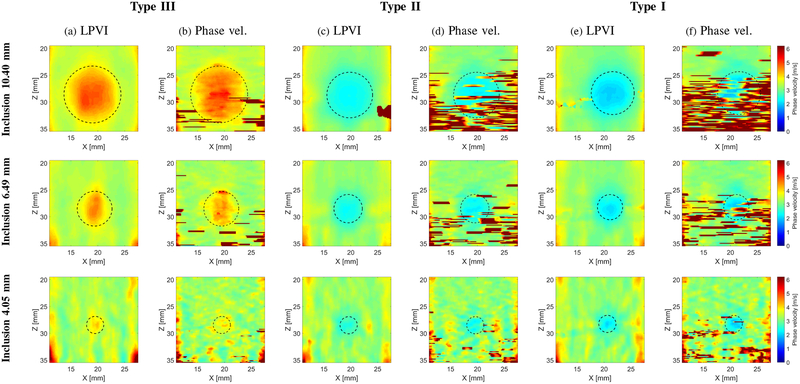
Figure 15 shows 2-D shear wave phase velocity images for the inclusions Type I, Type II and Type III, respectively. Results for inclusion size of 10.40 (top row), 6.49 (middle row) and 4.05 (bottom row) mm diameter are presented. Results obtained using LPVI are compared with the phase velocity method presented in [24]. The same window sizes were used as for the inclusion Type IV investigated in Fig. 13. Reconstructed images are presented for a single frequency of 800 Hz. We did not show results for the inclusion size of 2.53 mm diameter, as for the inclusion Type IV in Fig. 13, because we were not able to estimate true inclusions position using B-mode imaging. It can be clearly seen that the reconstructed wave velocity maps using LPVI (Figs. 15a, 15c and 15e) do not exhibit much noise in comparison to the phase velocity method [24] (Figs. 15b, 15d and 15f). Spurious high velocity values are pronounced when Type I and Type II inclusions are investigated using [24] method. One of the reasons for that behavior might be that this technique is based on a phase gradient search which is susceptible to any changes observed in measured shear wave signal. Secondly, only the lateral direction is taken into account when reconstructing shear wave velocity maps. At the same time LPVI takes into account information from both lateral and axial directions. LPVI is capable to properly reconstruct softer inclusions (Type I and II).
Fig. 15:
Two-dimensional shear wave phase velocity images for the inclusion size of 10.40, 6.49 and 4.05 diameter, respectively. Phase velocity images were calculated based on (a), (c), (e) LPVI method and (b), (d), (f) the phase velocity approach presented in [24] for f0 = 800 Hz. Presented images are computed for the CIRS phantom with an inclusion Types III (E = 45 kPa), II (E = 14 kPa) and I (E = 8 kPa). Dashed lines present a true inclusion location and size estimated from B-modes. Reconstructed images for additional frequencies can be found in the Supplementary Material in Figs S6–S12.
2-D shear wave phase velocity images for more frequency values are shown in the Supplementary Material in Figs. S8–S12. The Supplementary Material also includes mean, median, standard deviation, variance, maximum and minimum values of shear wave velocity calculated for all inclusion types (I-IV) and various sizes for LPVI (Tables S4, S6, S8 and S10) and phase velocity approach described in [24] (Tables S5, S7, S9 and S11).
D. Gelatin Phantom with Excised Porcine Liver Inclusion Results
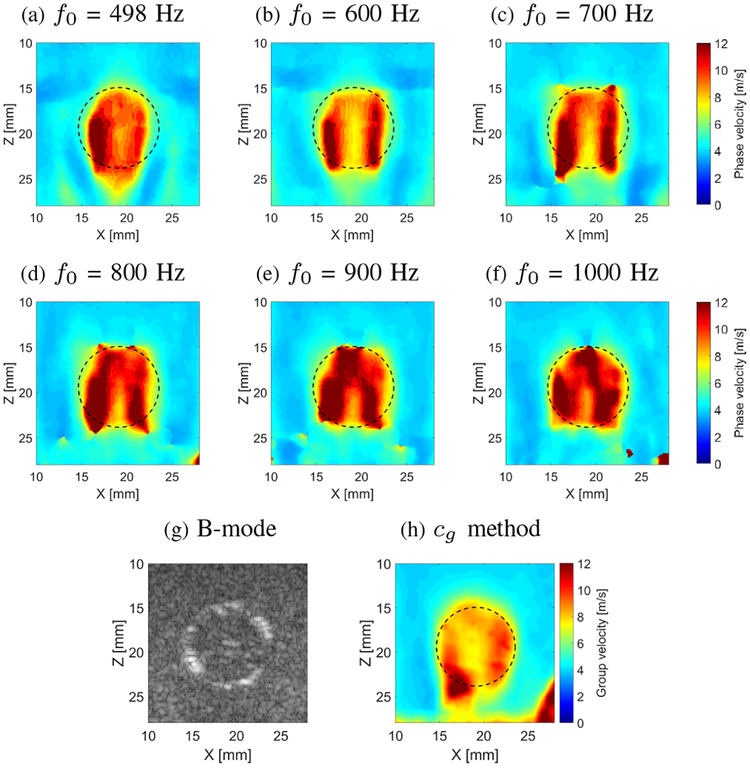
Figure 16 presents a reconstructed 2-D shear wave phase velocity image for the gelatin phantom with the cylindrical porcine liver inclusion. Six different f0 frequencies were chosen for the shear wave velocity reconstruction using LPVI within a selected ROI, i.e. 498 (Fig. 16a), 600 (Fig. 16b), 700 (Fig. 16c), 800 (Fig. 16d), 900 (Fig. 16e) and 1000 (Fig. 16f) Hz, respectively. Fig. 16h shows the ROI reconstructed using the group velocity method. A spatial window size was set to be constant and equal to 5 × 5 mm for all reconstructions. Superimposed, dashed lines show the true position of the liver lesion, estimated based on the B-mode image presented in Fig. 16g.
Fig. 16:
Two-dimensional shear wave velocity images, reconstructed for the liver lesion surrounded by gelatin phantom, calculated for a selected spatial window of 5 × 5 mm. Results for the LPVI method, reconstructed for various frequencies, are presented in (a) 498, (b) 600, (c) 700, (d) 800, (e) 900 and (f) 1000 Hz, respectively. B-mode is presented in (g). Image reconstructed by the group velocity method is presented in (h). Dashed lines present a true inclusion location estimated from the B-mode. In the Supplementary Material CNR for various frequencies and window sizes is shown in Fig. S13.
The reconstructed lesion demonstrates good contrast with respect to the background as can be seen in Figs. 16a–16d. Shape changes of the image are observed for various frequencies, as in the case of the CIRS phantom presented in Fig. 10. The reconstructed shear wave velocity did not become as uniform within the lesion with increasing frequency, as it was observed in the CIRS phantom. Similarly for the group velocity method the reconstructed shear wave velocity is not uniform within the inclusion, as can be seen in Fig. 16h. The reason for that might be that the ex vivo liver inclusion placed in the gelatin phantom is more heterogeneous, due to tissue heterogeneity and formalin diffusion, than the inclusion in the CIRS phantom. Hence, the liver stiffness may not be uniform within whole cross section as it is visible in Fig. 16. In the Supplementary Material CNR for various frequencies and window sizes is shown in Fig. S13.
E. Discussion
In this study we present a new technique called LPVI for the shear wave velocity imaging in soft tissues. The approach is based on a frequency-domain approach unlike most other techniques which operate in the time-domain. The study shows promising results of using LPVI to reconstruct 2-D shear wave phase velocity maps with high contrast and accurate shape representation. The proposed technique is capable of reconstruction of shear velocity images based on one data acquisition only (Figs. 2a and 2b). However, utilization of two acquisition data improves the inclusion shape reconstruction (Fig. 2c). We did not study in this paper LPVI feasibility for a scenario where multiple shear waves were produced and processed simultaneously. This is a separate, interesting topic that will be investigated in future work.
The inclusion phantom experiments show that LPVI is able to provide a more robust contrast between an inclusion and surrounding background in comparison to the group velocity method. The results indicate that LPVI is robust for small inclusions of size smaller than 5 mm as well. Tested inclusions were designed to be cylindrical and thus image cross sections should be circular. The reconstructed inclusions are circular for investigated dimensions 10.40 and 6.49 mm (first and second rows of Figs. 13b–13c), and nearly circular for 4.05 mm (third row of Figs. 13b–13c). There were small or no spatial distortions for these inclusions. LPVI is also able to detect very small inclusions, like 2.53 mm (fourth row of Figs. 13b–13c). The time-domain technique had reduced sensitivity to detecting this type of inclusion.
The spatial resolution of the proposed method is determined by the spatial wavelengths which are shorter at the higher frequencies. This is important for resolving small inclusions with high contrast. However, using a single frequency may not provide adequate signal-to-noise levels. Using a frequency band can preserve the general spatial wavelength but improve the signal-to-noise.
The LPVI algorithm ideally requires one or more wavelengths to precisely estimate the shear wave velocity of inclusions. In our study the inclusions have a shear wave speed of about 5.16 m/s (for E = 80 kPa). This corresponds to a wavelength of about 6.45 mm at 800 Hz. At 849 Hz and 947 Hz, the inclusion in a diameter of 6.49 mm has a more than one wavelength and the reconstructed inclusion profiles are very close to a true inclusion location estimated from B-mode (Figs. 10e and 10f).
The inclusion 4.05 mm diameter reconstructed at 1050 Hz, presented in Fig. 13b, is biased since it contains less than one shear wavelength. The ideal frequency for the image reconstruction, for this size of the inclusion, would be about 1300 Hz or higher.
Ideally, high frequency is preferred for LPVI because the shorter wavelength of shear waves at higher frequencies is beneficial for resolving small inclusions and providing more accurate quantitative results.
The LPVI algorithm assumes local homogeneity by selecting a spatial window size. This is violated near boundaries between regions with different stiffness. The shear wave velocity gradually transitions between regions [45], leading to elevated shear wave velocities in the background and diminished shear wave velocity inside the inclusion near the boundary. The shear wave wavelength decreases over the frequency leading to a reduced transition region and a reduction of underestimation bias for the inclusion.
A smaller spatial window (Wz,x) size gives better spatial resolution of shear wave velocity estimates. However, choosing a Wz,x that is too small provides a noisier image in the form of blur (fourth row of Fig. 13b, where Wz,x = 1.7 × 1.7 mm). Thus, the choice of the spatial window size should depend on the inclusion size that is evaluated. One approach is to gradually increase Wz,x for image reconstruction. This approach could be used to choose an optimal window size, which should be smaller than the investigated inclusion in order to avoid excessive flattening and blurring of the edges.
There are two ways that can improve noise reduction in the reconstructed images. One is selection of the appropriate window size. Larger Wz,x makes the reconstructed shear wave phase velocity image smoother and hence reduces noise more. However, at the same time small lesions may be concealed by noise. Consequently, this action should be taken only when larger lesions are investigated (larger than approximately 4 mm diameter, based on the authors’ investigation provided in this paper). The second way to reduce the background noise is to use a frequency band (fband) instead of using just a single f0 frequency for the shear wave velocity image reconstruction. This step has a grater impact when at the same time small spatial window size is used for very small lesions examination, e.g. 2.53 mm diameter as presented in the fourth row of Fig. 13c.
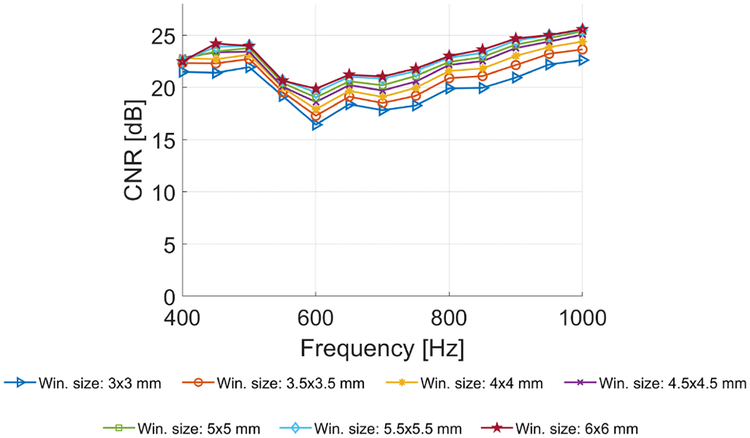
Figure 17 presents the CNR of the LPVI method for various spatial windows used and for different frequencies. It is shown that with increasing the spatial window Wz,x from 3 × 3 to 6 × 6 mm the CNR increases about 5 dB. This happens because a larger Wz,x will average wave velocity from a larger area. Consequently this reduces local discontinuities and makes the reconstructed shear wave velocity maps smoother. In a frequency range from 400 to 600 Hz the CNR oscillates between 16.5 dB for Wz,x = 3 × 3 mm and 24.2 dB for Wz,x = 6 × 6 mm. Above 600 Hz the CNR increases up to approximately 26 dB for window size of 6 × 6 mm.
Fig. 17:
The contrast-to-noise ratio (CNR) estimated for the LPVI, computed for various frequencies and the spatial window dimensions, calculated for the CIRS experimental data with the inclusion diameter of 6.49 mm.
The optimal window size could be determined based on several different metrics with user interaction. These metrics could include contrast between two regions, or reducing the coefficient of variation (ratio of standard deviation to the mean) or interquartile to median ratio. Regions or inclusions could be defined by a user and the window size could be optimized to meet a user-defined threshold to preserve resolution with smaller windows, but reduce the variation in the images.
One important finding in this paper is depicted in Fig. 6, where, regardless of the window size used, the measured velocity in the inclusion varied with frequency and seemed to plateau at higher frequencies (> 850 Hz). The level of variation was 0.1–0.3 m/s in the CIRS phantom data and about 0.1–0.2 m/s in the simulated data. If these phantoms were not known to be elastic, one might interpret this as dispersion due to viscoelasticity. This raises the need to perhaps choose a frequency or band of frequencies to create images so that reporting of shear wave velocities is standardized across different ultrasound scanners.
Using a frequency domain approach could provide a way to standardize shear wave velocity reconstructions. Some issues have arisen in SWE practice because different techniques utilize different acoustic radiation force push geometries and reconstruction strategies which produce differences in measured wave velocities [46]. This has been investigated by the Radiological Society of North America Quantitative Imaging Biomarker Alliance work by the Shear Wave Speed Committee in phantom studies, where it was found that measurements using scanners from different manufacturers gave different values and different levels of variation [47].
There are other methods that have used harmonic excitations such as magnetic resonance elastography (MRE) and probe oscillation shear elastography (PROSE), typically with mechanical actuation, that reconstruct images of the wave velocity at specific frequencies [48], [49]. The method in this paper could be compared with local frequency estimation or direct inversion techniques to evaluate reconstruction results [50], and could be used for reconstructions with these methods that use mechanical vibration.
The phantoms used in this study are assumed to be elastic, but this method could also be used to conduct studies in viscoelastic media to examine velocity dispersion caused by viscoelasticity and geometry. This will be explored in future work, particularly using LISA simulations so that ground truth is known and we can explore variations with the frequency of the reconstruction. There are two other methods that have been proposed to create maps of the phase velocity and viscoelastic parameters. In the work presented in [24] a local estimation of the shear wave velocity, c(f), was done by a linear fitting of the phase delay with a lateral distance over sliding a spatial window at a fixed axial depth. This procedure is repeated for each frequency and axial depth. This method was implemented and compared in this study in Fig. 13, where the results were not as good as LPVI due to only taking the lateral shear waves into account. The frequency-dependent phase velocity presented in [25] was computed from the median estimates of shear wave velocities and a material viscosities distributions, respectively. These measurements were analyzed by fitting c(f) with a linear dispersion model of the form . These two methods use data fitting to reconstruct a final shear wave velocity maps. The LPVI method instead is a data driven based approach. A fitting of additional dispersion model does not occur.
There are some limitations of this method. The reconstructions are computationally expensive and scale with the window size and the number of frequencies. Optimization of the step size of the moving window will be pursued in future studies. The method is also limited to the bandwidth in the shear wave motion, which is determined by the medium as well as the acoustic radiation force push beam geometry and push duration [46].
Future work will be directed towards using the LPVI method with different combinations of background and inclusion moduli as well as size. We need to systematically explore the performance of the LPVI method which may also lead to a standardization of the window size and frequency for reconstruction. This could also be compared against the aforementioned optimization approach to evaluate the robustness of either method for in vivo imaging.
F. Conclusions
This paper introduces a novel shear wave phase velocity imaging technique termed LPVI and demonstrates the feasibility of using LPVI to reconstruct a 2-D shear wave phase velocity map. Results from inclusion phantoms show that LPVI is able to accurately reconstruct 2-D shear wave velocity maps and provide good contrast between the inclusion and surrounding background without artifacts. In addition, the proposed technique is capable to reconstruct very small inclusions like 4.05 and 2.53 mm of diameter whereas, the time-domain method has difficulties with it. Further work includes in vitro and in vivo experiments of viscoelastic tissues.
Supplementary Material
Acknowledgments
This work was supported in part by grant R01DK092255 from the National Institutes of Health and in part from Mayo Clinic Research Committee. The content is solely the responsibility of authors and does not necessarily represent the official views of the National Institute of Diabetes and Digestive and Kidney Diseases or the National Institutes of Health.
Contributor Information
Piotr Kijanka, Department of Radiology, Mayo Clinic, Rochester, MN 55905 USA, and also with the Department of Robotics and Mechatronics, AGH University of Science and Technology, 30-059 Krakow, Poland (kijanka.piotr@mayo.edu or piotr.kijanka@agh.edu.pl)..
Matthew W. Urban, Department of Radiology, Mayo Clinic, Rochester, MN 55905 USA and also with the Department of Physiology and Biomedical Engineering, Mayo Clinic, Rochester, MN 55905 USA..
References
- [1].Sarvazyan AP, Rudenko OV, Swanson SD, Fowlkes JB, and Emelianov SY, “Shear wave elasticity imaging: a new ultrasonic technology of medical diagnostics,” Ultrasound in medicine & biology, vol. 24, no. 9, pp. 1419–1435, 1998. [DOI] [PubMed] [Google Scholar]
- [2].Bercoff J, Tanter M, and Fink M, “Supersonic shear imaging: a new technique for soft tissue elasticity mapping,” IEEE Trans. Ultrason., Ferroelect., Freq. Control, vol. 51, no. 4, pp. 396–409, 2004. [DOI] [PubMed] [Google Scholar]
- [3].Song P, Zhao H, Manduca A, Urban MW, Greenleaf JF, and Chen S, “Comb-push ultrasound shear elastography (cuse): a novel method for two-dimensional shear elasticity imaging of soft tissues,” IEEE Trans. Med. Imag, vol. 31, no. 9, pp. 1821–1832, 2012. [DOI] [PMC free article] [PubMed] [Google Scholar]
- [4].Doherty JR, Trahey GE, Nightingale KR, and Palmeri ML, “Acoustic radiation force elasticity imaging in diagnostic ultrasound,” IEEE Trans. Ultrason., Ferroelect., Freq. Control, vol. 60, no. 4, pp. 685–701, 2013. [DOI] [PMC free article] [PubMed] [Google Scholar]
- [5].Sarvazyan A, Hall T, Urban M, Fatemi M, Aglyamov S, and Garra B, “Elasticity imaging-an emerging branch of medical imaging. an overview,” Curr. Med. Imaging Rev, vol. 7, no. 4, pp. 255–282, 2011. [DOI] [PMC free article] [PubMed] [Google Scholar]
- [6].Bota S, Herkner H, Sporea I, Salzl P, Sirli R, Neghina AM, and Peck-Radosavljevic M, “Meta-analysis: Arfi elastography versus transient elastography for the evaluation of liver fibrosis,” Liver International, vol. 33, no. 8, pp. 1138–1147, 2013. [DOI] [PubMed] [Google Scholar]
- [7].Sebag F, Vaillant-Lombard J, Berbis J, Griset V, Henry J, Petit P, and Oliver C, “Shear wave elastography: a new ultrasound imaging mode for the differential diagnosis of benign and malignant thyroid nodules,” The Journal of Clinical Endocrinology & Metabolism, vol. 95, no. 12, pp. 5281–5288, 2010. [DOI] [PubMed] [Google Scholar]
- [8].Barr RG, Memo R, and Schaub CR, “Shear wave ultrasound elastography of the prostate: initial results,” Ultrasound quarterly, vol. 28, no. 1, pp. 13–20, 2012. [DOI] [PubMed] [Google Scholar]
- [9].Berg WA, Cosgrove DO, Doré CJ, Schäfer FK, Svensson WE, Hooley RJ, Ohlinger R, Mendelson EB, Balu-Maestro C, Locatelli M et al. , “Shear-wave elastography improves the specificity of breast us: the be1 multinational study of 939 masses,” Radiology, vol. 262, no. 2, pp. 435–449, 2012. [DOI] [PubMed] [Google Scholar]
- [10].Barr RG and Zhang Z, “Shear-wave elastography of the breast: value of a quality measure and comparison with strain elastography,” Radiology, vol. 275, no. 1, pp. 45–53, 2014. [DOI] [PubMed] [Google Scholar]
- [11].Mehrmohammadi M, Song P, Meixner DD, Fazzio RT, Chen S,Greenleaf JF, Fatemi M, and Alizad A, “Comb-push ultrasound shear elastography (cuse) for evaluation of thyroid nodules: Preliminary in vivo results,” IEEE transactions on medical imaging, vol. 34, no. 1, pp. 97–106, 2015. [DOI] [PMC free article] [PubMed] [Google Scholar]
- [12].Denis M, Mehrmohammadi M, Song P, Meixner DD, Fazzio RT, Pruthi S, Whaley DH, Chen S, Fatemi M, and Alizad A, “Comb-push ultrasound shear elastography of breast masses: Initial results show promise,” PloS one, vol. 10, no. 3, p. e0119398, 2015. [DOI] [PMC free article] [PubMed] [Google Scholar]
- [13].Gerber L, Fitting D, Srikantharajah K, Weiler N, Kyriakidou G,Bojunga J, Schulze F, Bon D, Zeuzem S, and Friedrich-Rust M, “Evaluation of 2d-shear wave elastography for characterisation of focal liver lesions.” Journal of Gastrointestinal & Liver Diseases, vol. 26, no. 3, 2017. [DOI] [PubMed] [Google Scholar]
- [14].Palmeri ML, Wang MH, Dahl JJ, Frinkley KD, and Nightingale KR, “Quantifying hepatic shear modulus in vivo using acoustic radiation force,” Ultrasound in medicine & biology, vol. 34, no. 4, pp. 546–558, 2008. [DOI] [PMC free article] [PubMed] [Google Scholar]
- [15].Rouze NC, Wang MH, Palmeri ML, and Nightingale KR, “Parameters affecting the resolution and accuracy of 2-d quantitative shear wave images,” IEEE Trans. Ultrason., Ferroelect., Freq. Control, vol. 59, no. 8, pp. 1729–1740, 2012. [DOI] [PMC free article] [PubMed] [Google Scholar]
- [16].Carrascal CA, Chen S, Manduca A, Greenleaf JF, and Urban MW, “Improved shear wave group velocity estimation method based on spatiotemporal peak and thresholding motion search,” IEEE Trans. Ultrason., Ferroelect., Freq. Control, vol. 64, no. 4, pp. 660–668, 2017. [DOI] [PMC free article] [PubMed] [Google Scholar]
- [17].Song P, Manduca A, Zhao H, Urban MW, Greenleaf JF, and Chen S, “Fast shear compounding using robust 2-d shear wave speed calculation and multi-directional filtering,” Ultrasound in Medicine and Biology, vol. 40, no. 6, pp. 1343–1355, 2014. [DOI] [PMC free article] [PubMed] [Google Scholar]
- [18].Chen S, Fatemi M, and Greenleaf JF, “Quantifying elasticity and viscosity from measurement of shear wave speed dispersion,” The Journal of the Acoustical Society of America, vol. 115, no. 6, pp. 2781–2785, 2004. [DOI] [PubMed] [Google Scholar]
- [19].Bernal M, Nenadic I, Urban MW, and Greenleaf JF, “Material property estimation for tubes and arteries using ultrasound radiation force and analysis of propagating modes,” The Journal of the Acoustical Society of America, vol. 129, no. 3, pp. 1344–1354, 2011. [DOI] [PMC free article] [PubMed] [Google Scholar]
- [20].Chen S, Urban MW, Pislaru C, Kinnick R, Zheng Y, Yao A, and Greenleaf JF, “Shearwave dispersion ultrasound vibrometry (sduv) for measuring tissue elasticity and viscosity,” IEEE Trans. Ultrason., Ferroelect., Freq. Control, vol. 56, no. 1, pp. 55–62, 2009. [DOI] [PMC free article] [PubMed] [Google Scholar]
- [21].Brum J, Bernal M, Gennisson J, and Tanter M, “In vivo evaluation of the elastic anisotropy of the human achilles tendon using shear wave dispersion analysis,” Physics in Medicine & Biology, vol. 59, no. 3, p. 505, 2014. [DOI] [PubMed] [Google Scholar]
- [22].Widman E, Maksuti E, Larsson D, Urban MW, Bjällmark A, and Larsson M, “Shear wave elastography plaque characterization with mechanical testing validation: a phantom study,” Physics in Medicine & Biology, vol. 60, no. 8, p. 3151, 2015. [DOI] [PubMed] [Google Scholar]
- [23].Kijanka P, Qiang B, Song P, Amador C, Chen S, and Urban MW, “Robust phase velocity dispersion estimation of viscoelastic materials used for medical applications based on the multiple signal classification method,” IEEE Trans. Ultrason., Ferroelect., Freq. Control, vol. 65, no. 3, pp. 423–439, 2018. [DOI] [PMC free article] [PubMed] [Google Scholar]
- [24].Budelli E, Brum J, Bernal M, Deffieux T, Tanter M, Lema P,Negreira C, and Gennisson J-L, “A diffraction correction for storage and loss moduli imaging using radiation force based elastography,” Physics in medicine and biology, vol. 62, no. 1, p. 91, 2016. [DOI] [PubMed] [Google Scholar]
- [25].van Sloun RJ, Wildeboer RR, Wijkstra H, and Mischi M, “Viscoelasticity mapping by identification of local shear wave dynamics,” IEEE Trans. Ultrason., Ferroelect., Freq. Control, vol. 64, no. 11, pp. 1666–1673, 2017. [DOI] [PubMed] [Google Scholar]
- [26].Flynn EB, Chong SY, Jarmer GJ, and Lee J-R, “Structural imaging through local wavenumber estimation of guided waves,” Ndt & E International, vol. 59, pp. 1–10, 2013. [Google Scholar]
- [27].Yu L, Tian Z, and Leckey CA, “Crack imaging and quantification in aluminum plates with guided wave wavenumber analysis methods,” Ultrasonics, vol. 62, pp. 203–212, 2015. [DOI] [PubMed] [Google Scholar]
- [28].Rogge MD and Leckey CA, “Characterization of impact damage in composite laminates using guided wavefield imaging and local wavenumber domain analysis,” Ultrasonics, vol. 53, no. 7, pp. 1217–1226, 2013. [DOI] [PubMed] [Google Scholar]
- [29].Tian Z and Yu L, “Lamb wave frequency–wavenumber analysis and decomposition,” Journal of Intelligent Material Systems and Structures, vol. 25, no. 9, pp. 1107–1123, 2014. [Google Scholar]
- [30].Tian Z, Yu L, and Leckey C, “Delamination detection and quantification on laminated composite structures with lamb waves and wavenumber analysis,” Journal of Intelligent Material Systems and Structures, vol. 26, no. 13, pp. 1723–1738, 2015. [Google Scholar]
- [31].Herrmann LR, “Elasticity equations for incompressible and nearly incompressible materials by a variational theorem,” AIAA J, vol. 3, no. 10, pp. 1896–1900, 1965. [Google Scholar]
- [32].Delsanto P, Schechter R, Chaskelis H, Mignogna R, and Kline R, “Connection machine simulation of ultrasonic wave propagation in materials. ii: the two-dimensional case,” Wave Motion, vol. 20, no. 4, pp. 295–314, 1994. [Google Scholar]
- [33].Delsanto P, Schechter R, and Mignogna R, “Connection machine simulation of ultrasonic wave propagation in materials iii: The three-dimensional case,” Wave Motion, vol. 26, no. 4, pp. 329–339, 1997. [Google Scholar]
- [34].Paćko P, Bielak T, Spencer A, Staszewski W, Uhl T, and Worden K, “Lamb wave propagation modelling and simulation using parallel processing architecture and graphical cards,” Smart Materials and Structures, vol. 21, no. 7, p. 075001, 2012. [Google Scholar]
- [35].Kijanka P, Radecki R, Packo P, Staszewski W, and Uhl T, “Gpu-based local interaction simulation approach for simplified temperature effect modelling in lamb wave propagation used for damage detection,” Smart materials and structures, vol. 22, no. 3, p. 035014, 2013. [Google Scholar]
- [36].Nadella KS and Cesnik CE, “Local interaction simulation approach for modeling wave propagation in composite structures,” CEAS Aeronautical Journal, vol. 4, no. 1, pp. 35–48, 2013. [Google Scholar]
- [37].Lee B and Staszewski W, “Modelling of lamb waves for damage detection in metallic structures: Part i. wave propagation,” Smart Materials and Structures, vol. 12, no. 5, p. 804, 2003. [Google Scholar]
- [38].Lee B and Staszewski W, “Modelling of lamb waves for damage detection in metallic structures: Part ii. wave interactions with damage,” Smart Materials and Structures, vol. 12, no. 5, p. 815, 2003. [Google Scholar]
- [39].Hillis WD, The connection machine. MIT press, 1989. [Google Scholar]
- [40].Jensen JA and Svendsen NB, “Calculation of pressure fields from arbitrarily shaped, apodized, and excited ultrasound transducers,” IEEE Trans. Ultrason., Ferroelect., Freq. Control, vol. 39, no. 2, pp. 262–267, 1992. [DOI] [PubMed] [Google Scholar]
- [41].Kasai C, Namekawa K, Koyano A, and Omoto R, “Real-time two-dimensional blood flow imaging using an autocorrelation technique,” IEEE Trans. Sonics Ultrason, vol. 32, no. 3, pp. 458–464, 1985. [Google Scholar]
- [42].Montaldo G, Tanter M, Bercoff J, Benech N, and Fink M, “Coherent plane-wave compounding for very high frame rate ultrasonography and transient elastography,” IEEE Trans. Ultrason., Ferroelect., Freq. Control, vol. 56, no. 3, pp. 489–506, 2009. [DOI] [PubMed] [Google Scholar]
- [43].Hendrick R, Raff U, Stark D, and Bradley W, “Magnetic resonance imaging. 2,” St. Louis: Mosby, 1992. [Google Scholar]
- [44].Nabavizadeh A, Song P, Chen S, Greenleaf JF, and Urban MW, “Multi-source and multi-directional shear wave generation with intersecting steered ultrasound push beams,” IEEE transactions on ultrasonics, ferroelectrics, and frequency control, vol. 62, no. 4, p. 647, 2015. [DOI] [PMC free article] [PubMed] [Google Scholar]
- [45].Manduca A, Muthupillai R, Rossman P, Greenleaf JF, and Ehman RL, “Image processing for magnetic-resonance elastography,” in Medical Imaging 1996: Image Processing, vol. 2710 International Society for Optics and Photonics, 1996, pp. 616–624. [Google Scholar]
- [46].Palmeri ML, Deng Y, Rouze NC, and Nightingale KR, “Dependence of shear wave spectral content on acoustic radiation force excitation duration and spatial beamwidth,” in Ultrasonics Symposium (IUS), 2014 IEEE International. IEEE, 2014, pp. 1105–1108. [Google Scholar]
- [47].Palmeri M, Nightingale K, Fielding S, Rouze N, Deng Y, Lynch T,Chen S, Song P, Urban M, Xie H et al. , “Rsna qiba ultrasound shear wave speed phase ii phantom study in viscoelastic media,” in Ultrasonics Symposium (IUS), 2015 IEEE International. IEEE, 2015, pp. 1–4. [Google Scholar]
- [48].Muthupillai R, Lomas D, Rossman P, Greenleaf JF, Manduca A, and Ehman RL, “Magnetic resonance elastography by direct visualization of propagating acoustic strain waves,” Science, vol. 269, no. 5232, pp. 1854–1857, 1995. [DOI] [PubMed] [Google Scholar]
- [49].Mellema DC, Song P, Kinnick RR, Urban MW, Greenleaf JF, Manduca A, and Chen S, “Probe oscillation shear elastography (prose): A high frame-rate method for two-dimensional ultrasound shear wave elastography,” IEEE Trans. Med. Imag, vol. 35, no. 9, pp. 2098–2106, 2016. [DOI] [PMC free article] [PubMed] [Google Scholar]
- [50].Manduca A, Oliphant TE, Dresner M, Mahowald J, Kruse SA,Amromin E, Felmlee JP, Greenleaf JF, and Ehman RL, “Magnetic resonance elastography: non-invasive mapping of tissue elasticity,” Medical image analysis, vol. 5, no. 4, pp. 237–254, 2001. [DOI] [PubMed] [Google Scholar]
Associated Data
This section collects any data citations, data availability statements, or supplementary materials included in this article.


