

Abstract
Hematopoietic reconstitution after bone marrow transplantation is thought to be driven by committed and multipotent progenitor cells followed by long-term engrafting hematopoietic stem cells (HSCs). Here, we observed a population of early-engrafting cells displaying HSC-like behavior, which persisted long-term in vivo in an autologous myeloablative transplant model in nonhuman primates. To identify this population, we characterized the phenotype and function of defined nonhuman primate hematopoietic stem and progenitor cell (HSPC) subsets and compared these to human HSPCs. We demonstrate that the phenotype of CD34+CD45RA-CD90+ cells is highly enriched for HSCs. Most importantly, this population fully supported rapid short-term recovery and robust multilineage hematopoiesis in the nonhuman primate transplant model, and quantitatively predicted transplant success and time to neutrophil and platelet recovery. Application of this cell population has potential in the setting of HSC transplantation and gene therapy/editing.
One Sentence Summary:
A population of hematopoietic stem cells with superior engraftment and repopulating abilities has been identified in nonhuman primates.
Accessible Summary:
The gold standard target cell population for stem cell gene therapy and transplantion of stem cell enriched grafts are CD34+ cells. However, most of the cells within this population will not contribute to engraftment. Using a robust nonhuman primate transplantation model, we identified a stem cell-enriched sub-phenotype of CD34+ cells which is exclusively responsible for engraftment. Cell doses of this phenotype correlated with neutrophil and platelet engraftment and reliably predicted transplant success. Importantly, we observed phenotypic and transcriptomic similarity of these cells to human cells. These data suggest a refined cell population with potential in transplantation including gene therapy/editing approaches.
INTRODUCTION
Stringent confirmation of a hematopoietic stem cell (HSC) phenotype can only be achieved after robust long-term multilineage reconstitution of an irradiated recipient. Of the various models developed, retrovirus transduction and subsequent transplantation of CD34+ cells into human or animal recipients has permitted tracking of tens of thousands of individual cells in vivo over time (1).
A majority of these studies apply provirus insertion site analysis, which assigns the genomic locus of retrovirus integration as the clone signature. These reports generally identify successive waves of hematopoietic reconstitution after transplant wherein committed hematopoietic progenitor cells provide short-term recovery and HSCs provide long-term blood cell production, with waves of clones emerging and succeeding one another over the lifetime of the recipient (2–7). However, differences in experimental design, species studied, and the HSC definition applied have resulted in conflicting models.
Large animals such as the pigtailed macaque (Macaca nemestrina) and the rhesus macaque (Macaca mulatta) share a close evolutionary relationship with humans and have been used as pre- clinical model systems to study basic HSC biology (8) or to develop specific HSC gene therapy approaches (9). A critical advantage of these models is the ability to support both short- and long-term hematopoiesis, as well as multilineage reconstitution in an autologous, myeloablative transplant setting.
We previously used the pigtailed macaque as a stem cell transplant model (8, 9) to study long-term hematopoietic reconstitution after transplantation of autologous lentivirus-gene modified CD34+ cells in the myeloablative setting (10–16). In the present study, we wanted to examine HSC engraftment kinetics by applying a stringent definition for HSC behavior in vivo in the pigtailed macaque transplantation model. We retrospectively followed hundreds of thousands of hematopoietic clones in five pigtailed macaques by insertion site analysis for up to 7 years after transplantation to identify HSC behavior. We then coupled these studies with prospective, competitive transplantation and additional retrospective analyses to identify a CD34+ subpopulation capable of immediate, long-term and stable multilineage hematopoietic reconstitution in our nonhuman primate model.
RESULTS
Persistence of early engrafting clones up to 7.5 years after transplant
We first established the time to full, multilineage hematopoietic reconstitution in the pigtailed macaque model by discreet analysis of hematopoietic subsets in five retrospectively transplanted animals (fig. S1). We defined the day of engraftment for each lineage as the first day ≥1% fluorophore+ cells were observed with consecutive increases over the next three measurements. Based on these data, we established the following time frames: “initial engraftment” 0–3 months, “stabilization” 3 months to 1 year, “homeostasis” >1 year, and “long-term” engraftment >2 years after transplant.
To study the kinetics of individual blood cell clones in autologous CD34+ hematopoietic stem and progenitor cell (HSPC) grafts, we retrospectively analyzed the engraftment of individual lentivirus gene-modified cell clones by high-throughput retrovirus insertion site analysis (Fig. 1A). We followed 134,528 clones (range 6,830 to 43,558 unique clones per animal, n=5) for 2 to 7.5 years after transplant (table S1). In all five animals, clones engrafting in the first 0–3 months contributed more than half of the detected, gene-modified blood cells stably for >2 years posttransplant (Fig. 1A).
Fig. 1. Persistence of early-engrafting stem-cell like clones after transplant.
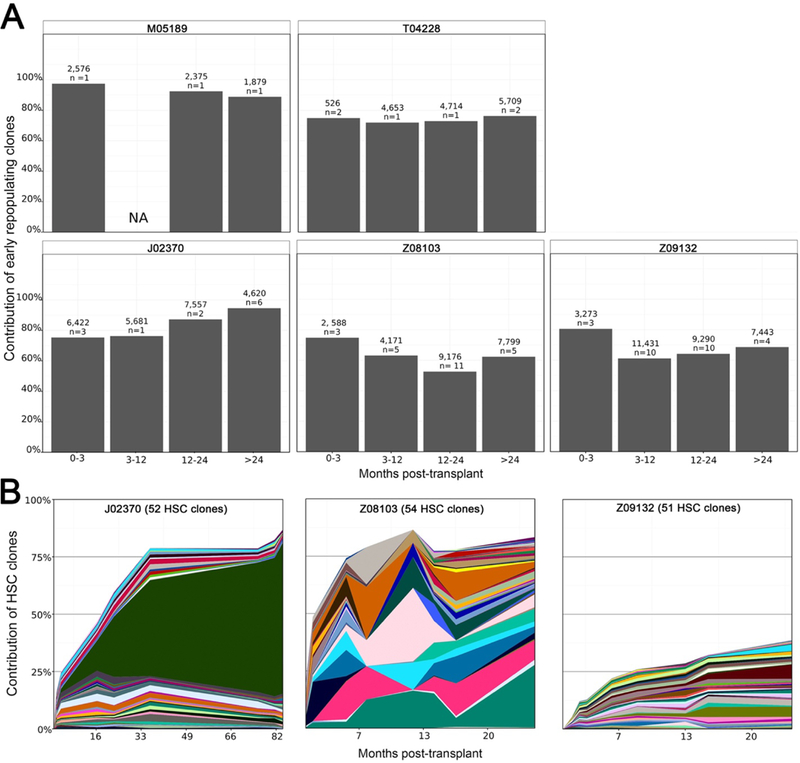
(A) In vivo hematopoietic cell clone tracking data for five retrospectively analyzed pigtailed macaques followed for more than 2 years after myeloablative transplant of lentivirus gene modified autologous CD34+ cells. Bars represent the contribution of clones identified in peripheral blood <3 months after transplant (first bar in each graph), over time. The number above each bar is the total number of clones identified in the time period; n = number of individual blood samples analyzed during that time period. NA, means no samples available within this time period. (B) Longitudinal contributions of abundant HSC clones (maximum clone contribution > mean maximum contribution for all HSC clones identified in the animal). Each colored band represents one HSC clone. Band width corresponds to the clone frequency (y-axis). To be called an HSC clone, the clone signature (lentivirus insertion locus) had to be present in one short-lived and one long-lived mature blood cell lineage and present at more than a single time period of analysis, one of which had to be later than 1 year post-transplant.
Early engraftment of persistent HSC clones
To deduce whether any of these early engrafting and persistent clones displayed HSC biology in vivo, the specific clone signature (i.e. genomic locus of lentivirus integration) had to be detected in multiple mature cell lineages ≥1 year after transplant and detected at additional time points. We analyzed clone signatures shared between short-lived granulocytes or monocytes and longer-lived B cells or T cells at time points ≥6 months after transplant in three of five animals (table S1). We observed 175, 291 and 740 shared (i.e. HSC) clone signatures, representing 0.4%, 0.9% and 2.1% of all clones detected in these animals, respectively (table S1). We then tracked the most abundant of these HSC clone signatures over time (Fig. 1B). Clones were characterized as “high abundance” HSC clones if their maximum contribution over time was greater than the mean maximum contribution for all HSC clones identified in the animal. We observed abundant HSC clones within the first 6 months after transplant which were stably maintained throughout follow-up. These data demonstrated a subpopulation of CD34+ cells with multilineage capacity that engrafted very early after autologous transplantation and was stably maintained for years in the recipient nonhuman primates. We then sought to identify such a population for targeted cellular therapy applications.
Identification of a HSC-enriched subpopulation in the nonhuman primate CD34+ cell population
Self-renewal and multilineage potential are classic characteristics of HSCs. To determine which subpopulations of CD34+ cells could be HSCs, we prospectively tested the cross-reactivity of human HSPC markers with pigtailed macaque and rhesus macaque stem cells (table S2). Focusing on the cross-reactive markers CD34 (17, 18), CD45RA (19), CD90 (20), CD117 (21),and CD123 (22) we identified nine (I-IX) phenotypically distinct HSPC subpopulations in unmanipulated, steady-state bone marrow (ssBM), growth factor-primed BM (pBM) and umbilical cord blood (Fig. 2A,B and fig. S2A-D). The average frequency of CD34+ cells in ssBM was 5.8 ± 2.9% in pigtailed macaques and 2.2 ± 0.7% in rhesus macaques, with equal proportions of the identified subpopulations (fig. S2E-G). Very low numbers of CD34+ cells were found in pigtailed macaque umbilical cord blood (0.13 ± 0.04%), but increased proportions of populations I, IV and VII were observed (fig. S2H).
Fig. 2. Identification of phenotypically defined steady state bone marrow-derived CD34+ subpopulations in the pigtailed macaque.
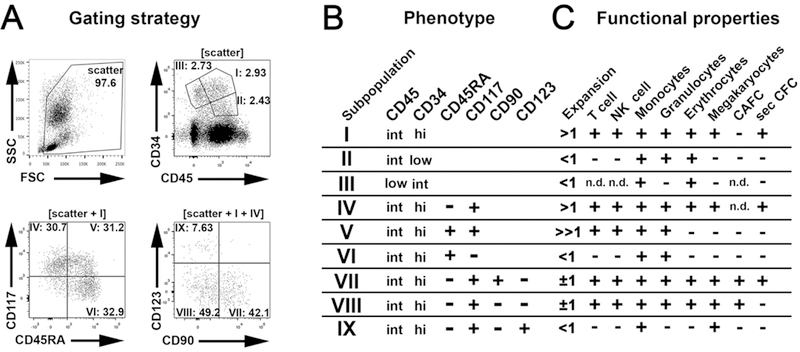
(A) Cell surface expression of CD45 vs. CD34, CD45RA vs. CD117, and CD90 vs. CD123 on pigtailed macaque steady state bone marrow-derived white blood cells. CD45RA/CD117 expression is gated on CD34highCD45int (I) populations; CD90/CD123 analysis is shown for CD34highCD45intCD45RA-CD117+ (IV) populations. (B) Phenotypically distinct subpopulations were labeled I-IX (int = intermediate staining). Corresponding data can be found in fig. S2 and S3. (C) Summary of the in vitro functional properties observed in each subpopulation. (n.d.: not determined). Corresponding data can be found in fig. S3-S9.
To evaluate self-renewal capacity, we examined the proliferation potential of defined HSPC subpopulations after flow-based sorting. All subpopulations lost CD34, CD90 and CD117 marker expression and gained CD45RA marker expression when cultured (fig. S3A). Population V demonstrated the greatest proliferation potential (fold-expansion >> 1), followed by populations I and IV (fold-expansion > 1). In contrast, populations VII and VIII demonstrated no change in cell number (fold-expansion ±1), and populations II, III, VI and IX demonstrated cell loss after culture (fold-expansion < 1) (Fig. 2C, fig. S3B).
We next wanted to identify which subpopulations contained HSC and multipotent progenitor cell activity and applied functional in vitro assays for differentiation of T cells (fig. S4), NK cells (fig. S5), granulocytes (fig. S5, S6 and S9), monocytes/macrophages (fig. S5, S6 and S9), erythrocytes (fig. S6 and S9), and megakaryocytes (fig. S7). Populations I, IV, VII and VIII were capable of generating all of the tested lineages (Fig 2C). Given that population VII and VIII were more discreet subdivisions of populations I and IV, these cells were considered to be the more refined HSC/multipotent progenitor cell containing subpopulations.
The formation of colonies containing cobblestone area-forming cells and the ability to form secondary colonies were also suggestive of primitive, multipotent cell types (23, 24). In the MS-5 stromal cell line co-culture assay, we observed the greatest number of cells with cobblestone area- forming cell potential within population VII (fig. S8 and table S3). In standard colony-forming cell assays, autonomous cobblestone area-forming cells from populations VII and VIII demonstrated secondary myeloid and erythroid colony-forming cell potential (fig. S9A-C). Overall, secondary colony-forming cell potential was most highly enriched in population VII across all species and stem cell populations from different source tissues (fig. S9D-H).
Together these data indicate that the most primitive nonhuman primate HSPCs were enriched in CD34+CD117+CD45RACD90+ cells (population VII), which gave rise to multipotent CD34+CD117+CD45RA-CD90- HSPCs (population VIII), whereas lympho-myeloid restricted progenitor cells were enriched in population V. Given these in vitro observations, we hypothesized that these cell fractions could contribute to the early and sustained engraftment in vivo observed in animals analysed retrospectively.
CD34+CD45RA-CD90+ nonhuman primate cells provide complete multilineage engraftment after autologous, myeloablative transplantation
To study the in vivo biology of identified HSPC subsets, we performed prospective competitive reconstitution experiments in the myeloablative, autologous nonhuman primate stem cell transplant model (Fig. 3A). Enriched CD34+ cells from an additional four animals were sorted into three distinct fractions based on CD45RA and CD90 expression: fraction i (CD34+CD45RA- CD90+), fraction ii (CD34+CD45RA-CD90-), and fraction iii (CD34+CD45RA+CD90-) (Fig. 3B, table S4). Together these three fractions represented all CD34highCD45int cell phenotypes (populations IV through IX). Purified fractions were then transduced with lentivirus vectors encoding green fluorescent protein (GFP), mCherry or mCerulean fluorescent proteins to independently track in vivo performance of each cell population after transplant (Fig. 3C and fig. S10A). To ensure that expression of a specific fluorophore did not influence in vivo observations, fluorophores assigned to each transplanted cell population were varied across animals (Fig. 3C and table S4).
Fig. 3. Multilineage engraftment is exclusively driven by CD34+CD45RA-CD90+ cell fractions.
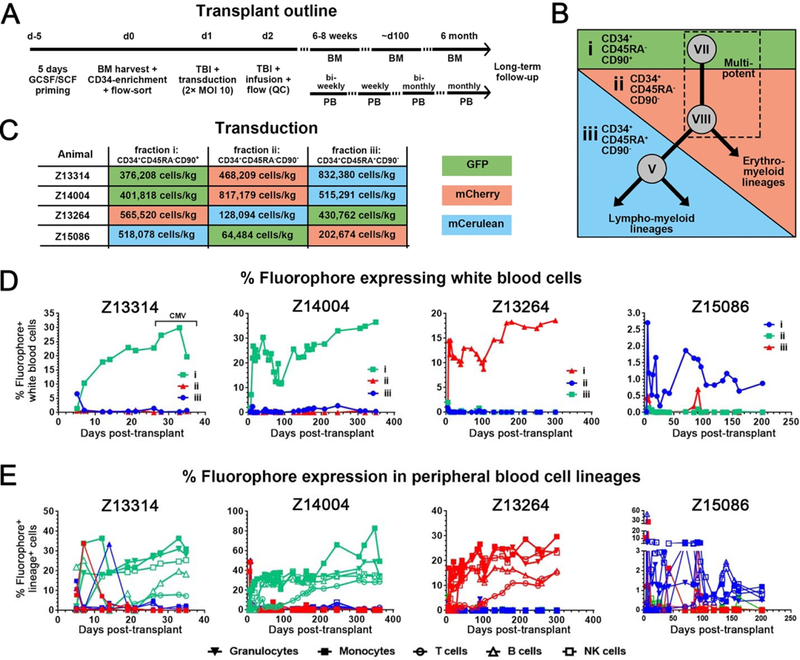
(A) Outline for autologous nonhuman primate stem cell transplantation experiments including time points for peripheral blood and bone marrow analysis. (B) Bone marrow-derived nonhuman primate CD34+ HSPCs were separated into fractions i, ii and iii by FACS based on the expression of CD45RA and CD90. These fractions contained all CD34highCD45int subpopulations as follows: fraction i (population VII), fraction ii (populations IV, VIII and IX), and fraction iii (populations V and VI). The dashed box highlights presumed multipotent cell phenotypes expected to contribute to engraftment in vivo. (C) A total of four animals were used for this study. FACS-purified HSPC fractions were transduced in different combinations with lentivirus encoding GFP (green), mCherry (red) and mCerulean (blue) as indicated. (D) Long-term follow-up of gene-marking in nonhuman primate white blood cells. (E) Frequency of gene-marked granulocytes (CD11b+CD14), monocytes (CD11b+CD14+), B cells (CD20+), T cells (CD3+) and NK cells (CD16+) in the peripheral blood of nonhuman primates.
Purified, transduced cell fractions from all four nonhuman primates maintained fraction- specific marker expression (fig. S10A) and colony-forming cell potential (fig. S10B) after culture. Total cell doses ranged from 0.8×10⁶ cells/kg to 1.7×10⁶ cells/kg at transplant (fig.3C). Despite these low cell doses, peripheral blood absolute neutrophil counts and platelet counts rapidly rebounded in all animals within 9–10 and 10–20 days, respectively (figs. S11and S12). Surprisingly, peripheral blood white blood cells in all animals exclusively expressed fluorophore proteins assigned to fraction i (CD34+CD45RA-CD90+ cells) (Fig. 3D). Detailed analysis of peripheral blood (fig. S10C) showed stable gene marking in all cell lineages (Fig. 3E). The frequency of fluorophore-expressing T cells remained low for the first 3 months and reached stable engraftment 6 months after transplant (Fig. 3E).
All animals demonstrated robust engraftment of both unmodified (fluorophore-) and gene-modified (fluorophore+) white blood cells and HSPCs in the bone marrow at 5–8 weeks posttransplant (fig. S13A). Marrow reconstitution was also exclusively driven by fraction i cells, which were initially skewed towards lympho-myeloid progenitor cells, but then established a more balanced composition over time (fig. S13B). Bone marrow was harvested and both gene-modified and non gene-modified HSPC subpopulations were sorted to determine if gene-modified cells displayed similar colony-forming cell potential relative to non-transduced repopulating cells. No significant differences were observed between fluorochrome+ and fluorochrome- HSPCs in colony-forming cell assays (fig. S13C).
These observations suggested that CD34+CD45RA-CD90+ (fraction i) cells were exclusively responsible for multilineage cell engraftment and initial hematopoietic recovery in peripheral blood and bone marrow following autologous, myeloablative transplantation.
Multilineage reconstitution demonstrated by clonal analysis
To test whether multipotent HSCs were represented by this early engraftment of fraction i cells, fluorophore+ peripheral blood cell lineages were sort-purified from two evaluable animals at 4 months (Z13264, mCh+) and 6.5 months (Z14004, GFP+) post-transplant for insertion site analysis (Fig. 4). Cell populations sorted included short-lived granulocytes (CD11b+CD14-) and monocytes (CD11b+CD14+), and long-lived B cells (CD20+) and T cells (CD3+).
Fig. 4. Clone tracking by insertion site analysis confirms early, multilineage hematopoietic engraftment of CD34+CD45RA-CD90+ cells.
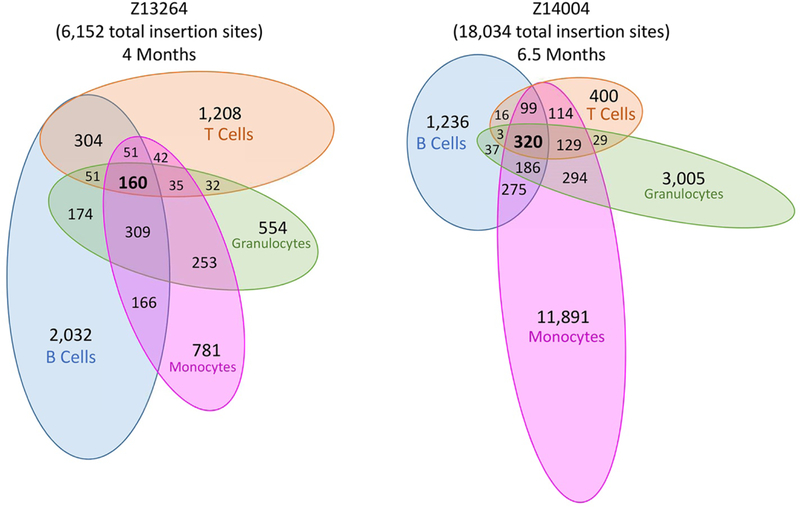
Venn diagrams illustrate the number of shared clone signatures between fluorophore and cell surface marker sorted peripheral blood cell lineages in two animals at 4 months (Z13264) and 6.5 months (Z14004) after transplant. Fluorophore+ fraction i cells were mCherry+ (Z13264) or GFP+ (Z14004). Subsets include B cells (CD20+), T cells (CD3+), granulocytes (CD11b+CD14-) or monocytes (CD11b+CD14+).
Clonal analysis demonstrated highly polyclonal engraftment with 6,152 and 18,034 unique clones signatures detected for animals Z13264 and Z14004, respectively (Fig. 4). Of these, 694 (Z13264) and 546 (Z14004) were shared clone signatures between granulocytes and B cells, and 288 (Z13264) and 662 (Z14004) were shared clone signatures between monocytes and T cells, similar to what was analyzed retrospectively in long-term follow-up animals. In total, 1,577 clone signatures (25.6% of total) were shared by two or more lineages in animal Z13264, and 1,502 clone signatures (8.3% of total) were shared by two or more lineages in animal Z14004. These data confirmed that fraction i cells conferred multilineage reconstitution in vivo after transplant.
Given this observation, we next wanted to determine the range of fraction i cell doses required for hematopoietic recovery after myeloablative transplant in this animal model.
CD34+CD45RA-CD90+ cell dose predicts hematopoietic recovery
To evaluate CD34+CD45RA-CD90+ cell doses required for successful multilineage engraftment, we retrospectively analyzed flow cytometric data from the infusion products of eleven additional animals (table S5). Initial neutrophil engraftment (absolute neutrophil count > 500/μl and platelet engraftment (platelets > 20,000/μl) were achieved in all animals (figs. S11and S12). However, two animals were not able to sustain platelet and neutrophil engraftment without additional supportive care during the first 3 months after transplant (fig. S14). We therefore defined these two animals as “engraftment failures”, and the remaining nine animals with long-term engraftment as “engraftment successes.”
Animals displaying engraftment success received ~6-fold the mean dose of CD34+CD45RA-CD90+ cells/kg body weight compared to animals displaying engraftment failure (p=0.019) (Fig. 5A). No significant differences were observed among animals displaying engraftment success and failure for CD34+, CD34+CD45RA-CD90- or CD34+CD45RA+CD90- transplanted cells/kg body weight (Fig. 5A and fig. S15A). Notably, we observed a strong correlation between the CD34+CD45RA-CD90+ cell dose transplanted and the onset of neutrophil and platelet recovery in animals displaying engraftment success (Fig. 5B), whereas total nucleated cells, number of CD34+, CD34+CD45RA-CD90-, or CD34+CD45RA+CD90- cells or colony- forming cells did not correlate with recovery of neutrophils or platelets (fig. S15B). These data suggest that a minimum dose of 122,000 CD34+CD45RA-CD90+ cells/kg was sufficient to elicit engraftment in this transplant model.
Fig. 5. Correlation between CD34+CD45RA-CD90+ cell dose, engraftment success and onset of neutrophil/platelet recovery in nonhuman primates.
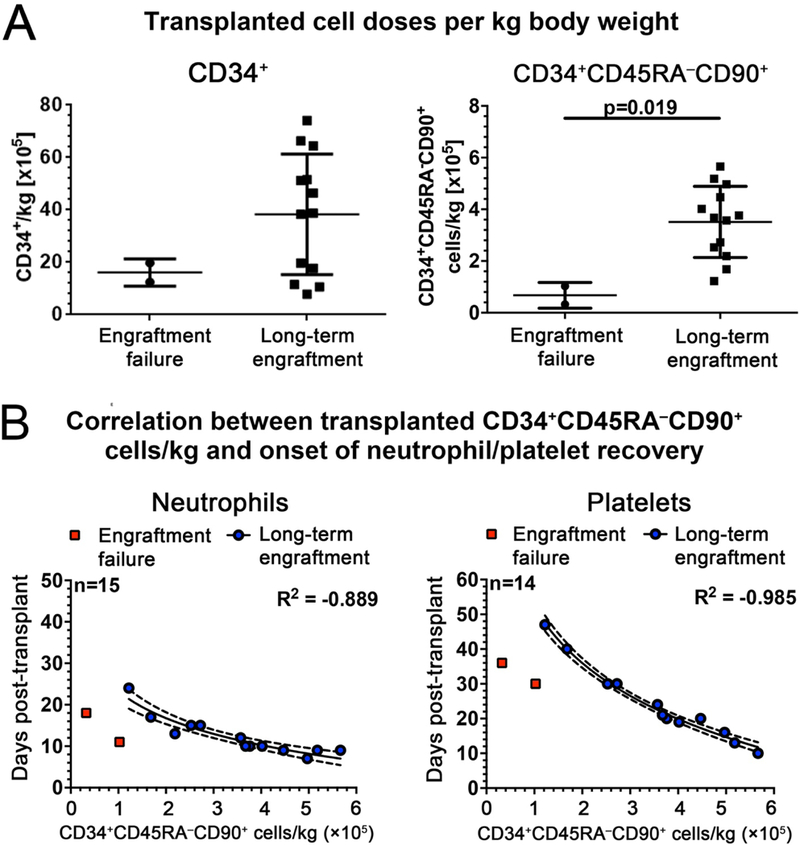
(A) Statistical comparison of transplanted CD34+ and CD34+CD45RA-CD90+ cells/kg body weight in animals with engraftment failure or long-term engraftment (unpaired, two-sided t-test). (B)Logarithmic correlation of transplanted CD34+CD45RA-CD90+ cells/kg body weight with the day of neutrophil and platelet recovery as calculated using Spearman’s rank correlation coefficient. The linear regression and the 95% confidence interval for each correlation are indicated with the solid and the dotted lines, respectively.
CD34+CD45RA-CD90+ cells are enriched for CD34+CD38low/- cells in human mobilized peripheral blood stem cells and umbilical cord blood
To evaluate whether the markers CD45RA and CD90 used in the nonhuman primate (Fig. 6A) enrich a similar cell fraction in human CD34+ HSPCs, we tested our strategy on human granulocyte colony-stimulating factor (G-CSF)-mobilized peripheral blood stem cells (PBSCs) (Fig. 6B) and umbilical cord blood (fig. S16). Classical gating-strategies including CD38 (20, 25) resulted in a low to moderate enrichment for CD34+CD45RA-CD90+ cells (Fig. 6B). CD34+CD45RA-CD90+ fractions were enriched for CD38- and CD38low cells in PBSCs (Fig. 6B). This enrichment of CD38- cells was even greater in CD34+CD45RA-CD90+ fractions from umbilical cord blood (fig. S16).
Fig. 6. Phenotypic and transcriptomic similarities observed between human and nonhuman primate HSC-enriched cell fractions.
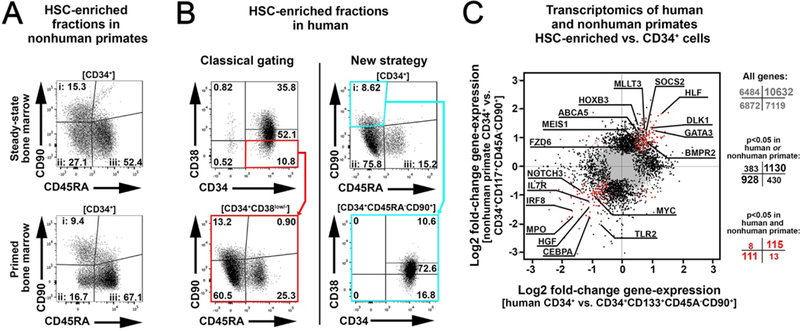
(A) Gating of the HSC-enriched CD34+CD45RA-CD90+ cell fraction in nonhuman primate steady-state bone marrow and primed bone marrow. (B) Gating of an HSC-enriched cell fraction in human G-CSF-mobilized peripheral blood stem cells using classical gating (left) and our new gating strategy (right) for a CD34+CD45RA-CD90+ subfraction. (C) Comparison of transcript expression in human and nonhuman primate HSC-enriched cell fractions to that of bulk CD34+ cells. The log2 fold-change in gene expression was calculated for each species and gene individually. The number of genes included in each quadrant for all genes (grey), differentially expressed genes in human or nonhuman primate (black), and differentially expressed genes in both species (red) with a p-value <0.05 is given next to the scatter plot, with genes showing the same pattern (lower left and upper right quadrant), highlighted in bold. Key genes of HSCs and hematopoietic differentiation are tagged and labeled.
Transcript expression of key molecules has been described for human HSCs (26, 27). To determine whether nonhuman primate and human HSC-enriched cells displayed similar transcript expression, we performed ribonucleic acid sequencing (RNA-Seq) analysis. We sorted human (CD34+CD133+CD45RA-CD90+) and nonhuman primate (CD34+CD117+CD45RA-CD90+) HSC- enriched cell fractions, isolated and sequenced poly-adenylated RNA molecules, and compared these to gold standard bulk CD34+ cells. Key factors reported to be up-regulated in multipotent human HSCs such as ABCA5, HOXB3, MEIS1, BMPR2, MLLT3, SOCS2 and FZD6 (28–32) were also found to be significantly (p<0.05) upregulated in nonhuman primate CD34+CD117+CD45RA-CD90+ cells, whereas low expression was observed for the differentiation markers TLR2, IL7R, IRF8, HGF, CEBPA or MPO (26, 27)> in this cell population from both species (Fig. 6C, table S6).
These data suggest a phenotypic and transcriptomic similarity between human and nonhuman primate HSC-enriched cell populations, which could be biologically discriminated by expression of CD34, CD45RA and CD90.
DISCUSSION
Here we describe a CD45RA-CD90+ subset of enriched CD34+ hematopoietic cells which is responsible for rapid multilineage hematopoiesis in a clinically relevant, autologous nonhuman primate HSC transplantation model. We demonstrated evidence for early-engrafting HSC-like clones, which were stably maintained long-term. These observations were supported by tracking hundreds of thousands of unique clone signatures in animals during up to 7.5 years of follow-up. Most importantly, we demonstrated that the phenotype and transcriptomes of these cells were highly similar between nonhuman primates and humans. Biologically robust competitive repopulation experiments in four animals demonstrated the capacity of CD34+CD45RA-CD90+ cells to completely reconstitute hematopoiesis in the autologous, myeloablative transplant setting. We also demonstrated that limited cell doses were needed for successful hematopoietic reconstitution in this setting. The number of nonhuman primates included in the present study, validation in vivo both retrospectively and prospectively, and the tracking of individual clones to confirm these observations suggested early engraftment of HSC clones with stable contributions to hematopoiesis over time after autologous transplantation. Most importantly for the fields of HSC biology and transplantation, gene therapy and gene editing, this study identified a highly refined, small cell population capable of complete functional hematopoietic reconstitution.
These findings markedly contrast with a recent report using insertion site analysis alone to describe hematopoietic reconstitution in rhesus macaques over a decade after autologous transplant of gene-modified CD34+ cells (33). This study identified between 846 and 5,758 total clones in each of four rhesus macaques transplanted with either lentivirus or simian immunodeficiency virus (SlV)-based vector transduced cells, which followed a bi-phasic reconstitution over the first year, then sequential expansion of HSC-like clones. This study also reported that the number of clones identified in each animal was directly proportional to the CD34+ cell dose at the time of transplant, and that HSC-like clonal signatures were not observed in vivo until 7–9 months after transplant, gradually increasing in contribution >1 year after transplant, the time period in our study defined as homeostasis. There are notable differences between these two studies. First, different nonhuman primate species were used for in vivo studies (rhesus macaques versus pigtailed macaques), as well as different sources of CD34+ cells (G-CSF mobilized leukapheresis-derived CD34+ cells in rhesus macaque versus G-CSF- and stem cell factor-primed bone marrow-derived CD34+ cells in pigtailed macaque). The fraction of repopulating HSCs declines in mobilized leukapheresis products compared to bone marrow products, with the highest proportion of HSCs found in umbilical cord blood (34). Thus, the lower number of clones transplanted and tracked in the rhesus macaque study could reflect lower HSC content in mobilized leukapheresis products.
Additionally, there are technical differences between insertion site analysis methods used to track the clones: the rhesus macaque study used a restriction enzyme-based insertion site analysis method different from the acoustic shearing-based method we employed. Our method allowed for quality control of clone abundance by capturing different fragment sizes of the same flanking genomic sequence by single-end sequencing, whereas the rhesus macaque method relied on paired-end sequencing of resulting genomic fragments. The paired-end approach can reduce bias, but also displays lower sequencing efficiency, resulting in lower clone numbers. Additionally, the rhesus macaque study collected samples from each animal a total of 7 to 12 times after transplant, over as many as 140 months, with very few samples (≤3 time points) collected within the first year. Thus, the bi-phasic reconstitution and clonal succession observed in the rhesus macaque study may have resulted from under-sampling.
A more comprehensive sampling of early time points within the first 9.5 months after transplant was reported by Wu and colleagues in a side-by-side report to the rhesus macaque study (35). In this study, the same rhesus macaque model was used (n = 3), with unique clones tracked by retrovirus DNA barcode sequencing. Monthly sampling was performed over the early reconstitution and stabilization periods we describe. Similar to our observations, cumulative clone numbers detected did not correlate with the CD34+ cell dose at time of transplant over the brief period of follow-up included in this report. This report identified multilineage clones over the first 9.5 months after transplant, beginning 2–3 months after infusion. Longer follow-up and additional animals will be required to demonstrate long-term persistence of these clones in the rhesus macaque model. Additionally, the DNA barcode sequencing study reported a unique ontogeny of NK cells. This analysis was not performed in our retrospective study due to lack of sorted NK cell samples. However, we did observe CD34+CD45RA-CD90+ cells contributing to the NK compartment in competitive repopulation experiments. Additional clone tracking studies will be required to confirm clonal origins of the NK lineage in our model.
Our most striking observation was that the highly HSC-enriched CD34+CD45RA-CD90+ fraction accounted for all gene-modified cells observed in peripheral blood and bone marrow following transplantation in this model. This suggested that everything required for short- and long-term, multilineage hematopoietic reconstitution was contained within this cell phenotype. Indeed, we observed clone signatures which were both shared and exclusive to sorted blood cell lineages in two of the four animals studied. We also observed up to 25% of these clones shared by two or more blood cell lineages, which is a dramatic increase relative to animals in the retrospectively analyzed cohort. However, these studies sampled very disparate time points of follow-up in these two cohorts. Additionally, analysis in competitively repopulated animals consists of a single time point, compared to multiple time points of analysis in the retrospective cohort.
In vivo observations in competitively transplanted animals suggest that the CD34+CD45RA-CD90+ population could be a significant refinement in the target cell population for transplantation in the autologous setting, as well as in approaches such as gene therapy and gene editing. Currently, the gold-standard for gene therapy is lentivirus transduction of enriched CD34+ cells. Focusing on CD34+CD45RA-CD90+ cells would result in a 20-fold reduction in overall cell numbers and thus dramatically reduce materials required for vector-based or nuclease-mediated gene therapy and editing protocols. Ongoing studies are currently also evaluating whether this enrichment strategy can result in more efficient gene modification. When comparing human and nonhuman primate CD34+CD45RA-CD90+ HSPCs, we found significant overlap in gene expression of key stem cell factors and low expression of differentiation factors. Given the cross-species conservation of the HSC-enriched CD34+CD45RA-CD90+ phenotype, we would expect important implications for human transplantation and gene therapy studies.
We observed a strong correlation between CD34+CD45RA-CD90+ HSPCs/kg body weight and the success of multilineage engraftment, as well as the time to neutrophil and platelet recovery, further supporting the biological importance of our phenotypically defined, HSC-enriched population. Our data demonstrate a direct correlation of a phenotypically defined HSPC subpopulation with engraftment properties after autologous transplant. We also found that the correlation between CD34+CD45RA-CD90+ cell dose and engraftment was not affected by different stem cell sources, gene modifications, expansion protocols, or cryopreservation, making this phenotype a valuable tool for the in vitro analysis of HSC modification, expansion strategies and quality control of stem cell infusion products.
The follow up of animals prospectively transplanted with sort-purified and fluorophore-coded subpopulations in this study is currently limited to 1 year and remains ongoing. While this length of follow up has been predictive of long-term outcome (> 7 years) in our retrospective nonhuman primate studies, longer follow up will be required to fully assess the safety and feasibility of this approach for clinical stem cell transplantation and gene therapy studies. Also, our evaluation of this new phenotype in human HSC sources is currently limited to phenotypic and transcriptomic analyses. Further comprehensive in vivo studies of these human HSPC subpopualtions should be performed in either prospective mouse xenograft assays or retrospectively analyzed in patients if the required marker expression data and post-transplant follow-up data are available. Finally, this study did not address whether this refined HSC-enriched phenotype requires the co-transplantation of the other, supporting cell phenotypes. Such studies will further support the clinical translation of this HSC-enriched cell phenotype.
In conclusion, retrospective detection of persistent and HSC-like clonal signatures early after transplant, before all lineages have reconstituted, suggests a subpopulation of transplanted CD34+ hematopoietic cells that immediately contributes to long-term, multilineage hematopoietic reconstitution lasting up to 7+ years in this clinically relevant model. Most notably, using prospective transplantation studies we have identified a subset of CD34+ cells expressing CD90 and lacking CD45RA markers, which rapidly and exclusively reconstitutes multilineage hematopoiesis at low cell doses in the autologous, myeloablative transplant setting in nonhuman primates. This cell population is similar between humans and nonhuman primates based on phenotypic and transcriptomic analyses. Moreover, enumeration in the autologous setting is rapid and predictive of engraftment success and extent of supportive care required after transplant. These findings may impact the development of HSC transplantation and gene therapy and gene editing approaches.
METHODS
Study design
Retrospective insertion site analysis after autologous, myeloablative transplantation of gene-modified, CD34+ HSPCs in the nonhuman primate model suggested early, multilineage contribution of long-term engrafting blood cells. Based on these findings, the main goal of this study was to identify this subpopulation and evaluate its engraftment and differentiation potential. Combining HSPC cell surface marker expression with functional in vitro read-outs, distinct HSPC subpopulations were identified in pigtailed macaque and rhesus macaque stem cell populations from different tissue sources. Contributions of these candidate populations to short-term and long-term hematopoietic recovery were tested in prospective competitive reconstitution experiments in four additional pigtailed macaques. We longitudinally tracked the engraftment of gene-modified cells in the peripheral blood and bone marrow of pigtailed macaques by flow cytometry, functional in vitro assays, and insertion site analysis over 1 year after transplant. Correlation of HSC-enriched target cell populations with engraftment success and hematologic recovery kinetics was established with an additional eleven retrospectively transplanted animals. Finally, relevance to human hematopoiesis was studied by flow cytometry and RNA-sequencing, demonstrating similar cell surface marker phenotypes and transcriptomic profiles between these two species.
Cell sources, CD34+ enrichment and in vitro culture
Pigtailed macaque steady-state bone marrow, primed bone marrow and umbilical cord blood, rhesus macaque steady-state bone marrow as well as human CD34+ cells were harvested, enriched and cultured as previously described (11, 36). For more details on the CD34+ enrichment see Supplemental Methods. Enriched CD34+ cells were cultured in StemSpan (Stemcell Technologies, Vancouver, British Columbia, Canada) supplemented with 100 U/ml penicillin streptomycin (Gibco by Life Technologies, Waltham, MA) and either stem cell factor (Peprotech, Rocky Hill, NJ), TPO (Thrombopoietin, Peprotech) and FLT3-L (Fms-related tyrosine kinase 3 ligand, Miltenyi Biotec), or stem cell factor and IL-3 (Interleukin 3, Peprotech) (100 ng/ml each).
Flow cytometry analysis and FACS
Antibodies used for FACS (Fluorescence-activated cell sorting) analysis and sorting of pigtailed macaque, rhesus macaque and human cells are listed in table S1. Dead cells and debris were excluded via FSC/SSC gating. 123count eBeads (eBioscience, San Diego, CA) were used for quantification purposes. Flow cytometric analysis were performed on an LSR Ilu (BD, Franklin Lakes, NJ) and FACSAria Ilu (BD). Cells for in vitro assays as well as autologous nonhuman primate stem cell transplants were sorted using a FACSAria IIu cell sorter (BD) and sort purity assessed by recovery of sorted cells.
Functional in vitro read-outs
Analysis of sort-purified pigtailed macaque and rhesus macaque cells in functional in vitro readouts for the evaluation and quantification of erythroid, myeloid (granulocyte, monocyte/macrophage), lymphoid (T, B, NK cells) and megakaryocytic differentiation potentials was performed as previously described (37–39) (Supplemental Methods).
Autologous nonhuman primate transplants and ex vivo engineering of HSPCs
Autologous nonhuman primate transplants, priming (mobilization), collection of cells and genetic engineering were conducted consistent with our previously published protocols (11). All experimental procedures performed were reviewed and approved by the Institutional Animal Care and Use Committee of the Fred Hutchinson Cancer Research Center and University of Washington (Protocol #3235–01). This study was carried out in strict accordance with the recommendations in the Guide for the Care and Use of Laboratory Animals of the National Institutes of Health (“The Guide”) and monkeys were randomly assigned to the study. Detail protocols for the performed nonhuman primate transplants including i) ex vivo engineering of HSPCs, ii) animal housing and care, iii) preconditioning and supportive care can be found in the Supplemental Methods.
RNA isolation, RNA quality control, RNA-Seq, RNA-Seq expression and data analysis
Isolation of total RNA from human and nonhuman primate bulk CD34+ cells and sort-purified HSC-enriched cell fractions was performed according to manufacturer instructions (>Supplemental Methods. Total RNA integrity was analyzed using an Agilent 2200 TapeStation (Agilent Technologies, Inc., Santa Clara, CA) and quantified using a Trinean DropSense96 spectrophotometer (Caliper Life Sciences, Hopkinton, MA). RNA-Seq expression analysis was performed in Shared Recources at the Fred xgHutchinson Cancer Research Center. Detailed protocols for data analyses can be found in Suxgpplemental Methods. All custom R and Python codes are available on request. All other codes are publicly available and cited in the appropriate methods description (see Supplemental Methods).
Insertion site analysis
Detailed protocols for the insertion site analysis, persistence analysis and determination of HSC signatures can be found in Supplemental Methods. All custom R and Python codes are available on request. All other codes are publicly available and cited in the appropriate methods description (see Supplemental Methods).
Statistics
Statistical analysis of data generated from all experiments except RNA-Seq analysis was performed using GraphPad Prism Version 5. These statistical data are presented as mean ± standard error of the mean (SEM). Significance analyses were performed with the paired/unpaired, two-sided Student t test (*p < 0.05; **p < 0.01; ***p <0.001). Correlations were calculated using Spearman’s rank correlation coefficient (correlation coefficient R2 0.0–0.19 = very weak, 0.20–0.39 = weak, 0.4–0.59 = moderate, 0.6–0.79 = strong, 0.8–1.0 = very strong). Statistical analysis of RNA-Seq data was performed using DESeq2.
Supplementary Material
ACKNOWLEDGEMENTS:
Human peripheral blood stem cells were kindly provided by Shelly Heimfeld. We thank Helen Crawford for help in preparing this manuscript. We also thank Veronica Nelson, Erica Curry, and Kelvin Sze for excellent support in our pigtailed macaque studies.
FUNDING:
This work was supported in part by grants to HPK from the National Institutes of Health: HL115128, HL098489, AI096111 and by funds to JEA from the Fred Hutchinson Cancer Research Center and the Cuyamaca Foundation. HPK is a Markey Molecular Medicine Investigator and received support as the inaugural recipient of the José Carreras/E. Donnall Thomas Endowed Chair for Cancer Research and the Fred Hutchinson Cancer Research Center Endowed Chair for Cell and Gene Therapy.
Footnotes
COMPETING INTERESTS:
SR, JEA and HPK are coinventors on the U.S. Provisional Patent Applications No. 62/351,761 and No. 62/428,994 “Selection and use of cell popualtions for research and therapeutic purposes” and the International Patent Application No. PCT/US2017/037967 “Strategies to assess and/or produce cell populations with predictive engraftment potential.” HPK and JEA are consultants for Rocket Pharmaceuticals. The other authors declare no competing interests.
DATA AND MATERIALS AVAILABILITY:
All original RNA-Seq data were uploaded to the NCBI database (BioProject Accession codes PRJNA320857 nonhuman primate, and PRJNA320858 human).
REFERENCES AND NOTES
- 1.Bystrykh LV, Verovskaya E, Zwart E, Broekhuis M, de Haan G, Counting stem cells: methodological constraints. Nat Methods 9, 567–574 (2012). [DOI] [PubMed] [Google Scholar]
- 2.Snodgrass R, Keller G, Clonal fluctuation within the haematopoietic system of mice reconstituted with retrovirus-infected stem cells. EMBO Journal 6, 3955–3960 (1987). [DOI] [PMC free article] [PubMed] [Google Scholar]
- 3.Brady G, Billia F, Knox J, Hoang T, Kirsch IR, Voura EB, Hawley RG, Cumming R, Buchwald M, Siminovitch K, Analysis of gene expression in a complex differentiation hierarchy by global amplification of cDNA from single cells. Current biology : CB 5, 909–922 (1995). [DOI] [PubMed] [Google Scholar]
- 4.Jordan CT, Lemischka IR, Clonal and systemic analysis of long-term hematopoiesis in the mouse. Genes & Development 4, 220–232 (1990). [DOI] [PubMed] [Google Scholar]
- 5.Drize N, Chertkov J, Sadovnikova E, Tiessen S, Zander A, Long-term maintenance of hematopoiesis in irradiated mice by retrovirally transduced peripheral blood stem cells. Blood 89, 1811–1817 (1997). [PubMed] [Google Scholar]
- 6.Schmidt M, Glimm H, Lemke N, Muessig A, Speckmann C, Haas S, Zickler P, Hoffmann G, von Kalle C, A model for the detection of clonality in marked hematopoietic stem cells. Annals of the New York Academy of Sciences 938, 146–155; discussion 155–146 (2001). [DOI] [PubMed] [Google Scholar]
- 7.Drize NJ, Olshanskaya YV, Gerasimova LP, Manakova TE, Samoylina NL, Todria TV, Chertkov JL, Lifelong hematopoiesis in both reconstituted and sublethally irradiated mice is provided by multiple sequentially recruited stem cells. Exp Hematol 29, 786–794 (2001). [DOI] [PubMed] [Google Scholar]
- 8.Shepherd BE, Kiem HP, Lansdorp PM, Dunbar CE, Aubert G, Larochelle A, Seggewiss R, Guttorp P, Abkowitz JL, Hematopoietic stem-cell behavior in nonhuman primates. Blood 110, 1806–1813 (2007). [DOI] [PMC free article] [PubMed] [Google Scholar]
- 9.Peterson CW, Wang J, Norman KK, Norgaard ZK, Humbert O, Tse CK, Yan JJ, Trimble RG, Shivak DA, Rebar EJ, Gregory PD, Holmes MC, Kiem HP, Long-term multi-lineage engraftment of genome-edited hematopoietic stem cells after autologous transplantation in nonhuman primates. Blood, (2016). [DOI] [PMC free article] [PubMed] [Google Scholar]
- 10.Kiem HP, Sellers S, Thomasson B, Morris JC, Tisdale JF, Horn PA, Hematti P, Adler R, Kuramoto K, Calmels B, Bonifacino A, Hu J, von Kalle C, Schmidt M, Sorrentino B, Nienhuis A, Blau CA, Andrews RG, Donahue RE, Dunbar CE, Longterm clinical and molecular follow-up of large animals receiving retrovirally transduced stem and progenitor cells: no progression to clonal hematopoiesis or leukemia. Molecular Therapy 9, 389–395 (2004). [DOI] [PubMed] [Google Scholar]
- 11.Trobridge GD, Beard BC, Gooch C, Wohlfahrt M, Olsen P, Fletcher J, Malik P, Kiem HP, Efficient transduction of pigtailed macaque hematopoietic repopulating cells with HIV-based lentiviral vectors. Blood 111, 5537–5543 (2008). [DOI] [PMC free article] [PubMed] [Google Scholar]
- 12.Beard BC, Trobridge GD, Ironside C, McCune JS, Adair JE, Kiem HP, Efficient and stable MGMT-mediated selection of long-term repopulating stem cells in nonhuman primates. Journal of Clinical Investigation 120, 2345–2354 (2010). [DOI] [PMC free article] [PubMed] [Google Scholar]
- 13.Younan PM, Polacino P, Kowalski JP, Peterson CW, Maurice NJ, Williams NP, Ho O, Trobridge GD, von Laer D, Prlic M, Beard BC, DeRosa S, Hu SL, Kiem HP, Positive selection of mC46-expressing CD4+ T cells and maintenance of virus specific immunity in a primate AIDS model. Blood 122, 179–187 (2013). [DOI] [PMC free article] [PubMed] [Google Scholar]
- 14.Chandrasekaran D, Nakamoto B, Watts KL, Kiem HP, Papayannopoulou T, Modeling promising nonmyeloablative conditioning regimens in nonhuman primates. Hum Gene Ther 25, 1013–1022 (2014). [DOI] [PMC free article] [PubMed] [Google Scholar]
- 15.Younan PM, Peterson CW, Polacino P, Kowalski JP, Obenza W, Miller HW, Milless BP, Gafken P, DeRosa SC, Hu SL, Kiem HP, Lentivirus-mediated gene transfer in hematopoietic stem cells is impaired in SHIV-infected, ART-treated nonhuman primates. Mol Ther 23, 943–951 (2015). [DOI] [PMC free article] [PubMed] [Google Scholar]
- 16.Peterson CW, Haworth KG, Burke BP, Polacino P, Norman KK, Adair JE, Hu SL, Bartlett JS, Symonds GP, Kiem HP, Multilineage polyclonal engraftment of Cal-1 gene-modified cells and in vivo selection after SHIV infection in a nonhuman primate model of AIDS. Mol Ther Methods Clin Dev 3, 16007 (2016). [DOI] [PMC free article] [PubMed] [Google Scholar]
- 17.Civin CI, Strauss LC, Brovall C, Fackler MJ, Schwartz JF, Shaper JH, Antigenic analysis of hematopoiesis. III. A hematopoietic progenitor cell surface antigen defined by a monoclonal antibody raised against KG-1a cells. J Immunol 133, 157–165 (1984). [PubMed] [Google Scholar]
- 18.Katz FE, Tindle R, Sutherland DR, Greaves MF, Identification of a membrane glycoprotein associated with haemopoietic progenitor cells. Leuk Res 9, 191–198 (1985). [DOI] [PubMed] [Google Scholar]
- 19.Lansdorp PM, Sutherland HJ, Eaves CJ, Selective expression of CD45 isoforms on functional subpopulations of CD34+ hemopoietic cells from human bone marrow. J Exp Med 172, 363–366 (1990). [DOI] [PMC free article] [PubMed] [Google Scholar]
- 20.Majeti R, Park CY, Weissman IL, Identification of a hierarchy of multipotent hematopoietic progenitors in human cord blood. Cell Stem Cell 1, 635–645 (2007). [DOI] [PMC free article] [PubMed] [Google Scholar]
- 21.Kikushige Y, Yoshimoto G, Miyamoto T, Iino T, Mori Y, Iwasaki H, Niiro H, Takenaka K, Nagafuji K, Harada M, Ishikawa F, Akashi K, Human Flt3 is expressed at the hematopoietic stem cell and the granulocyte/macrophage progenitor stages to maintain cell survival. J Immunol 180, 7358–7367 (2008). [DOI] [PubMed] [Google Scholar]
- 22.Manz MG, Miyamoto T, Akashi K, Weissman IL, Prospective isolation of human clonogenic common myeloid progenitors. Proc Natl Acad Sci U S A 99, 11872–11877 (2002). [DOI] [PMC free article] [PubMed] [Google Scholar]
- 23.Ploemacher RE, van der Sluijs JP, Voerman JS, Brons NH, An in vitro limiting- dilution assay of long-term repopulating hematopoietic stem cells in the mouse. Blood 74, 2755–2763 (1989). [PubMed] [Google Scholar]
- 24.de Kruijf EJ, Hagoort H, Velders GA, Fibbe WE, van Pel M, Hematopoietic stem and progenitor cells are differentially mobilized depending on the duration of Flt3-ligand administration. Haematologica 95, 1061–1067 (2010). [DOI] [PMC free article] [PubMed] [Google Scholar]
- 25.Zonari E, Desantis G, Petrillo C, Boccalatte FE, Lidonnici MR, Kajaste- Rudnitski A, Aiuti A, Ferrari G, Naldini L, Gentner B, Efficient ex vivo engineering and expansion of highly purified human hematopoietic stem and progenitor cell populations for gene therapy. Stem Cell Reports,(2017). [DOI] [PMC free article] [PubMed] [Google Scholar]
- 26.Notta F, Zandi S, Takayama N, Dobson S, Gan OI, Wilson G, Kaufmann KB, McLeod J, Laurenti E, Dunant CF, McPherson JD, Stein LD, Dror Y, Dick JE, Distinct routes of lineage development reshape the human blood hierarchy across ontogeny. Science,(2015). [DOI] [PMC free article] [PubMed] [Google Scholar]
- 27.Paul F, Arkin Y, Giladi A, Jaitin DA, Kenigsberg E, Keren-Shaul H, Winter D, Lara-Astiaso D, Gury M, Weiner A, David E, Cohen N, Lauridsen FK, Haas S, Schlitzer A, Mildner A, Ginhoux F, Jung S, Trumpp A, Porse BT, Tanay A, Amit I, Transcriptional Heterogeneity and Lineage Commitment in Myeloid Progenitors. Cell 163, 1663–1677 (2015). [DOI] [PubMed] [Google Scholar]
- 28.Tang L, Bergevoet SM, Gilissen C, de Witte T, Jansen JH, van der Reijden BA, Raymakers RA, Hematopoietic stem cells exhibit a specific ABC transporter gene expression profile clearly distinct from other stem cells. BMC Pharmacol. 10, 12 (2010). [DOI] [PMC free article] [PubMed] [Google Scholar]
- 29.Vitali C, Bassani C, Chiodoni C, Fellini E, Guarnotta C, Miotti S, Sangaletti S, Fuligni F, De Cecco L, Piccaluga PP, Colombo MP, Tripodo C, SOCS2 Controls Proliferation and Stemness of Hematopoietic Cells under Stress Conditions and Its Deregulation Marks Unfavorable Acute Leukemias. Cancer Res 75, 2387–2399 (2015). [DOI] [PubMed] [Google Scholar]
- 30.Crisan M, Kartalaei PS, Vink CS, Yamada-Inagawa T, Bollerot K, van IW, van der Linden R, de Sousa Lopes SM, Monteiro R, Mummery C, Dzierzak E, BMP signalling differentially regulates distinct haematopoietic stem cell types. Nature communications 6, 8040 (2015). [DOI] [PMC free article] [PubMed] [Google Scholar]
- 31.Kocabas F, Zheng J, Thet S, Copeland NG, Jenkins NA, DeBerardinis RJ, Zhang C, Sadek HA, Meis1 regulates the metabolic phenotype and oxidant defense of hematopoietic stem cells. Blood 120, 4963–4972 (2012). [DOI] [PMC free article] [PubMed] [Google Scholar]
- 32.Cabezas-Wallscheid N, Klimmeck D, Hansson J, Lipka DB, Reyes A, Wang Q, Weichenhan D, Lier A, von Paleske L, Renders S, Wunsche P, Zeisberger P, Brocks D, Gu L, Herrmann C, Haas S, Essers MA, Brors B, Eils R, Huber W, Milsom MD, Plass C, Krijgsveld J, Trumpp A, Identification of regulatory networks in HSCs and their immediate progeny via integrated proteome, transcriptome, and DNA methylome analysis. Cell Stem Cell 15, 507–522 (2014). [DOI] [PubMed] [Google Scholar]
- 33.Kim S, Kim N, Presson AP, Metzger ME, Bonifacino AC, Sehl M, Chow SA, Crooks GM, Dunbar CE, An DS, Donahue RE, Chen IS, Dynamics of HSPC repopulation in nonhuman primates revealed by a decade-long clonal-tracking study. Cell Stem Cell 14, 473–485 (2014). [DOI] [PMC free article] [PubMed] [Google Scholar]
- 34.Wang JC, Doedens M, Dick JE, Primitive human hematopoietic cells are enriched in cord blood compared with adult bone marrow or mobilized peripheral blood as measured by the quantitative in vivo SCID-repopulating cell assay. Blood 89, 3919–3924 (1997). [PubMed] [Google Scholar]
- 35.Wu C, Li B, Lu R, Koelle SJ, Yang Y, Jares A, Krouse AE, Metzger M, Liang F, Lore K, Wu CO, Donahue RE, Chen IS, Weissman I, Dunbar CE, Clonal tracking of rhesus macaque hematopoiesis highlights a distinct lineage origin for natural killer cells. Cell Stem Cell 14, 486–499 (2014). [DOI] [PMC free article] [PubMed] [Google Scholar]
- 36.Adair JE, Waters T, Haworth KG, Kubek SP, Trobridge GD, Hocum JD, Heimfeld S, Kiem HP, Semi-automated closed system manufacturing of lentivirus gene- modified haematopoietic stem cells for gene therapy. Nat Commun 7, 13173 (2016). [DOI] [PMC free article] [PubMed] [Google Scholar]
- 37.La Motte-Mohs RN, Herer E, Zuniga-Pflucker JC, Induction of T-cell development from human cord blood hematopoietic stem cells by Delta-like 1 in vitro. Blood 105, 1431–1439 (2005). [DOI] [PubMed] [Google Scholar]
- 38.Doulatov S, Notta F, Eppert K, Nguyen LT, Ohashi PS, Dick JE, Revised map of the human progenitor hierarchy shows the origin of macrophages and dendritic cells in early lymphoid development. Nat Immunol 11, 585–593 (2010). [DOI] [PubMed] [Google Scholar]
- 39.Gorgens A, Radtke S, Mollmann M, Cross M, Durig J, Horn PA, Giebel B, Revision of the human hematopoietic tree: granulocyte subtypes derive from distinct hematopoietic lineages. Cell Rep 3, 1539–1552 (2013). [DOI] [PubMed] [Google Scholar]
- 40.La Motte-Mohs RN, Herer E, Zuniga-Pflücker JC, Induction of T-cell development from human cord blood hematopoietic stem cells by Delta-like 1 in vitro. Blood 105, 1431–1439 (2005). [DOI] [PubMed] [Google Scholar]
- 41.Schmitt TM, Zuniga-Pflucker JC, Induction of T cell development from hematopoietic progenitor cells by delta-like-1 in vitro. Immunity 17, 749–756 (2002). [DOI] [PubMed] [Google Scholar]
- 42.Itoh K, Tezuka H, Sakoda H, Konno M, Nagata K, Uchiyama T, Uchino H, Mori KJ, Reproducible establishment of hemopoietic supportive stromal cell lines from murine bone marrow. Exp Hematol 17, 145–153 (1989). [PubMed] [Google Scholar]
- 43.Rosenbloom KR, Armstrong J, Barber GP, Casper J, Clawson H, Diekhans M, Dreszer TR, Fujita PA, Guruvadoo L, Haeussler M, Harte RA, Heitner S, Hickey G, Hinrichs AS, Hubley R, Karolchik D, Learned K, Lee BT, Li CH, Miga KH, Nguyen N, Paten B, Raney BJ, Smit AF, Speir ML, Zweig AS, Haussler D, Kuhn RM, Kent WJ, The UCSC Genome Browser database: 2015 update. Nucleic Acids Res 43, D670–681 (2015). [DOI] [PMC free article] [PubMed] [Google Scholar]
- 44.Li H, Durbin R, Fast and accurate short read alignment with Burrows-Wheeler transform. Bioinformatics 25, 1754–1760 (2009). [DOI] [PMC free article] [PubMed] [Google Scholar]
- 45.Li H, Handsaker B, Wysoker A, Fennell T, Ruan J, Homer N, Marth G, Abecasis G, Durbin R, Genome S Project Data Processing, The Sequence Alignment/Map format and SAMtools. Bioinformatics 25, 2078–2079 (2009). [DOI] [PMC free article] [PubMed] [Google Scholar]
- 46.Huber W, Carey VJ, Gentleman R, Anders S, Carlson M, Carvalho BS, Bravo HC, Davis S, Gatto L, Girke T, Gottardo R, Hahne F, Hansen KD, Irizarry RA, Lawrence M, Love MI, MacDonald J, Obenchain V, Oles AK, Pages H, Reyes A, Shannon P, Smyth GK, Tenenbaum D, Waldron L, Morgan M, Orchestrating high- throughput genomic analysis with Bioconductor. Nat Methods 12, 115–121 (2015). [DOI] [PMC free article] [PubMed] [Google Scholar]
- 47.Love MI, Anders S, Kim V, Huber W, RNA-Seq workflow: gene-level exploratory analysis and differential expression. F1000Res 4, 1070 (2015). [DOI] [PMC free article] [PubMed] [Google Scholar]
- 48.Lawrence M, Huber W, Pages H, Aboyoun P, Carlson M, Gentleman R, Morgan MT, Carey VJ, Software for computing and annotating genomic ranges. PLoS Comput Biol 9, e1003118 (2013). [DOI] [PMC free article] [PubMed] [Google Scholar]
- 49.Love MI, Huber W, Anders S, Moderated estimation of fold change and dispersion for RNA-seq data with DESeq2. Genome Biol 15, 550 (2014). [DOI] [PMC free article] [PubMed] [Google Scholar]
- 50.Beard BC, Dickerson D, Beebe K, Gooch C, Fletcher J, Okbinoglu T, Miller DG, Jacobs MA, Kaul R, Kiem HP, Trobridge GD, Comparison of HIV-derived lentiviral and MLV-based gammaretroviral vector integration sites in primate repopulating cells. Molecular therapy : the journal of the American Society of Gene Therapy 15, 1356–1365 (2007). [DOI] [PubMed] [Google Scholar]
- 51.Beard BC, Adair JE, Trobridge GD, Kiem HP, High-throughput genomic mapping of vector integration sites in gene therapy studies. Methods Mol Biol 1185, 321–344 (2014). [DOI] [PubMed] [Google Scholar]
- 52.Hocum JD, Battrell LR, Maynard R, Adair JE, Beard BC, Rawlings DJ, Kiem HP, Miller DG, Trobridge GD, VISA--Vector Integration Site Analysis server: a web-based server to rapidly identify retroviral integration sites from next-generation sequencing. BMC Bioinformatics 16, 212 (2015). [DOI] [PMC free article] [PubMed] [Google Scholar]
- 53.Zhang J, Kobert K, Flouri T, Stamatakis A, PEAR: a fast and accurate Illumina Paired- End reAd mergeR. Bioinformatics 30, 614–620 (2014). [DOI] [PMC free article] [PubMed] [Google Scholar]
- 54.Kent WJ, Sugnet CW, Furey TS, Roskin KM, Pringle TH, Zahler AM, Haussler D, The human genome browser at UCSC. Genome research 12, 996–1006 (2002). [DOI] [PMC free article] [PubMed] [Google Scholar]
- 55.Kent WJ, BLAT--the BLAST-like alignment tool. Genome research 12, 656–664 (2002). [DOI] [PMC free article] [PubMed] [Google Scholar]
Associated Data
This section collects any data citations, data availability statements, or supplementary materials included in this article.