Abstract
Preclinical studies have demonstrated that the combination of systemic subcutaneous (s.c.) vaccination with intratumoral (i.t.) vaccination was superior in the induction of anti-tumor activity vs. vaccination with either route alone. A subsequent Phase I study employing i.t.-s.c. vaccination was carried out in men with locally recurrent or progressive prostate cancer. rF-PSA-TRICOM (PROSTVAC) vaccine was administered intraprostatically and rV-PSA-TRICOM followed by rF-PSA-TRICOM vaccine was administered systemically. In that study no dose limiting toxicities were observed, 19/21 patients had stable or improved prostate-specific antigen (PSA) values, and tumor-infiltrating lymphocytes (TILs) increased in post- vs. pre-treatment tumor biopsies, analyzed employing conventional immunohistochemistry (IHC). In the studies reported here, 31 phenotypes of peripheral blood mononuclear cells (PBMCs) were analyzed pre- and post-vaccination as well as the functions of PBMC regulatory T cells (Tregs) and natural killer cells. A trend was observed in decreases in serum PSA with the reduction of circulating Tregs post-vaccination. Digital IHC was employed pre- and post-vaccination to measure CD4 and CD8 TILs, as well as Treg TILs by conventional IHC. Few correlations were observed with CD4, CD8, or Treg in TILs vs. PBMCs. However, patients with lower levels of CD4 TILs pre-vaccine showed the greatest increases in CD4 TILs post-vaccine, while Treg TILs decreased post-vaccine. There was also a strong correlation between decreases in serum PSA and increases in CD8 TILs post-vaccine. These studies provide additional rationale for the use of i.t.-s.c. vaccinations and demonstrate a non-coordinate expression of specific immune subsets in PBMCs vs. tumor.
Keywords: Cancer vaccine, tumor-infiltrating lymphocytes, intratumoral vaccine, PROSTVAC, digital immunohistochemistry
Introduction
Intratumoral vaccination (i.t.) represents a potential modality for the therapy of solid tumors. We previously reported in a murine preclinical study that i.t. vaccination in combination with systemic subcutaneous (s.c.) vaccination was more potent in inducing anti-tumor activity than either vaccine route used alone.1 In that model the vaccine employed was recombinant fowlpox (rF)-CEA-TRICOM administered i.t. and recombinant vaccinia (rV)-CEA-TRICOM prime followed by rF-CEA-TRICOM booster vaccines given systemically. In a recent study2 the safety and feasibility of intraprostatic (i.p) vaccination in combination with systemic vaccination was carried out in a Phase I clinical trial in patients with locally recurrent or progressive prostate cancer, where rF-PSA-TRICOM (PROSTVAC) vaccine was administered i.p. and rV-PSA-TRICOM followed by rF-PSA-TRICOM vaccine was administered systemically. In that study 19 of 21 patients had stable or improved PSA values and conventional (non-digital) immunohistochemistry (IHC) showed an increase in both CD4 and CD8 tumor-infiltrating lymphocytes (TILs) after vaccine. In the present study, we have compared the frequencies of immune cell subsets circulating in the peripheral blood and lymphocytes in the tumor microenvironment in an effort to identify similarities and/or differences of immune responses to the vaccine within the two compartments. We also evaluated if any changes in a particular immune cell subset, either in peripheral blood mononuclear cells (PBMCs) or in TILs, correlated with decreases in serum PSA values of patients.
Material and Methods
Patients
Twenty-one patients with prostate cancer (19 of 21 had locally recurrent prostate cancer after definitive radiation therapy, and 2 of 21 did not receive any local therapy) were enrolled on a 5-cohort 3+3 dose escalation phase I trial to determine the safety and feasibility of intraprostatic administration of PSA-TRICOM, a poxviral vaccine encoding for the tumor-associated antigen PSA and the triad of T-cell costimulatory molecules B7.1, ICAM-1, and LFA-3. All cohorts received initial s.c. vaccination with rV-PSA-TRICOM and intraprostatic boost vaccinations with rF-PSA-TRICOM scheduled every 4 weeks for 3 times. Cohorts 3–5 also received intraprostatic rF-GM-CSF. Cohort 5 received additional subcutaneous boosters with rF-PSA-TRICOM and rF-GM-CSF (ClinicalTrials.gov number NCT000965513). Recombinant F-GM-CSF was given with each s.c. vaccination and with the intraprostatic vaccines in cohorts 3–5 (Supporting Information Table 1). All injections were given at the NIH Clinical Center, Bethesda, MD, USA. This protocol was approved by the Institutional Review Board of the NCI, and all patients gave written informed consent. Transrectal ultrasound-guided prostate biopsies were performed prior to initial vaccine and approximately on day 113, which was 4 weeks after the last vaccine boost. Pre-vaccination and post-vaccine biopsies were taken concurrently with peripheral blood collection in order to compare PBMC immune subsets with tumor immune infiltrates. A pre-treatment prostate biopsy that was taken at an outside institution and that indicated locally recurrent disease was considered acceptable.
PSA monitoring and other clinical features
Serum PSA values were measured at 28-day intervals. Assessment of PSA response was based on PSA Cancer Clinical Trials Working Group criteria.4 PSA doubling times (DTs) were determined using the Memorial Sloan-Kettering PSA DT online calculator,5 and were calculated using pre-enrollment PSA values from each patient’s home laboratory and post-enrollment PSA values from the NIH Clinical Center laboratory to ensure consistency in the assessment of PSA values for calculation. Patients’ clinical characteristics that have been tested for correlations with intraprostatic immune infiltration and PBMC immune cell subsets were: age, previous androgen deprivation therapy (ADT), castration resistance, Gleason score, stage at diagnosis, serum PSA value at diagnosis, time since radiotherapy, serum PSA value doubling time (PSA DT) at study entry, PSA DT at the end of the study, percentage of change of PSA DT, serum PSA value on study entry, nadir of serum PSA value on study, best serum PSA value on study, last serum PSA value on study, serum PSA value change, and response to treatment based on PSA response criteria.
Collection of PBMCs for functional assays and PBMC immune cell subsets analysis
PBMCs were collected at baseline and around 113 days after the beginning of treatment. Briefly, 60 mL of blood were collected, followed by mononuclear fractioning by Ficoll-Hypaque density gradient separation, washed three times, and preserved in 90% heat-inactivated human AB serum (Gemini Bio-Products, W. Sacramento, CA) and 10% DMSO in liquid nitrogen at a concentration of 1×10⁷ cells/mL until assayed.
Regulatory T-cell suppression assay
Regulatory T lymphocytes (Treg) were isolated from patients’ PBMCs using a human CD4+CD25+ Regulatory T Cell Isolation Kit (Miltenyi Biotec, Auburn, CA) following the manufacturer’s instructions. A suppression assay was performed on PBMC of 15 patients collected at baseline and around day 113 after treatment. CD4+ CD25neg T cells (1×10⁴ cells/mL) were cultured alone, or co-cultured with CD4+ CD25+ Tregs at Treg vs. CD4 ratios of 1:1, 1:0.5 and 1:0.1 with 0.5 µg/mL of anti-CD3 plate-bound antibody (clone OKT3; eBioscience, San Diego, CA) and irradiated (3,500 rad) T cell-depleted PBMCs (1×10⁵ cells/mL) in a 96-well round-bottomed plate at 37°C and 5% CO2. Cells were cultured in RPMI 1640 (Mediatech, Manassas, VA) supplemented with 100 U/mL of penicillin, 100 µg/mL of streptomycin (Mediatech) and 2 mM of L-glutamine (Mediatech) in 10% heat-inactivated human AB serum (Gemini Bio-Products, West Sacramento, CA) at a total volume of 200 µL/well. T-cell proliferation was measured by [3H]thymidine (PerkinElmer, Waltham, MA) incorporation pulsed on day 4, at 1 µCi (0.037 MBq)/well and quantified 16 hours later using a liquid scintillation counter (PerkinElmer, Waltham, MA). All experiments were performed in triplicate. Proliferation of CD4+ CD25neg T cells without co-culturing with CD4+ CD25high Tregs was defined as 100% proliferation, and the percentage of suppression was calculated.
NK-cell cytotoxicity assay
A 5-hour 111In-release assay was used to measure NK-cell activity after magnetic isolation of NK-cells (Miltenyi Biotec) from PBMCs of 14 patients collected at baseline and around day 113. 2×10⁶ K562 cells were labeled with 60µCi 111In-oxyquinoline (GE Healthcare, Silver Spring, MD) at 37°C for 20 minutes, and used as targets at 3000 cells/well in 96-well round-bottom culture plates.6 We used effector cell:target cell (E:T) ratios of 100, 50, 25, and 12.5:1. Results shown are at the 50:1 ratio. Assays were performed in RPMI medium (Mediatech, Manassas, VA) supplemented with fetal bovine serum (Gemini Bio-Products, W Sacramento, CA), glutamine and antibiotics (Mediatech). Spontaneous release was determined by incubating target cells with medium alone, and complete lysis by incubation with 2.5% Triton X-100. Lysis was calculated using the formula: Lysis (%) = [observed release (cpm) – spontaneous release (cpm)] / [complete release (cpm) – spontaneous release (cpm)] x 100.
Flow cytometry
Multi-color flow cytometry analysis was performed on PBMCs of 20 patients from all time points by staining for 30 minutes at 4°C with CD3-V450, CD8-FITC or APC, HLA-DR-PerCPCy5.5, CD25-PECy7, CD45RA-PerCP-Cy5.5, CD62L-FITC, CD127-V450, CCR7-PE-Cy7, PD-1-PE, CD4-APC-Cy7, CTLA-4-FITC, and FOXP3-APC (BD Biosciences, San Jose, CA). For NK cells CD3-V450, CD16-APC-Cy7, CD56-PE-Cy7 and Tim-3-AF700 were used. For MDSC CD33-PE, CD11b-APC-Cy7, HLA-DR-PerCP-Cy5.5, CD14-V450 and CD15-APC (BD Biosciences) were used. 1×10⁵ cells were acquired on an LSR-II (BD Biosciences), and data was analyzed using FlowJo software (Tree Star Inc., Ashland, OR). The appropriate isotype controls were used, and dead cells were excluded from the analysis.
Immunohistochemical analysis of prostate biopsies
Formalin-fixed, paraffin-embedded tissue blocks were prepared as previously described.7 Mouse monoclonal antibody anti-human CD4, clone 1F6, was purchased from Novocastra (Buffalo Grove, IL); mouse monoclonal antibody anti-human CD8, clone C8/144B, was purchased from Dako (Carpinteria, CA); mouse monoclonal antibody anti-human FoxP3, clone 236A/E7, was purchased from Abcam (Cambridge, MA). Negative controls were included in all runs, and were incubated with mouse IgG1 or IgG2a isotype (AbD Serotec, Raleigh, NC) using the same Ig concentrations as the primary antibody. IHC analysis for CD4 was performed in 30 biopsy specimens (12 pre- and 18 post-vaccine) while for CD8 IHC analysis was performed on 32 biopsy specimens (13 pre- and 19 post-vaccine). IHC could not be performed on other samples due to inadequate tissue. Most of the inadequate samples were obtained by an outside institution prior to enrollment, which accounts for the discrepancy between the number of samples available pre- and post-vaccine. Digital IHC images were acquired with an Aperio ScanScope AT Turbo (Aperio, Vista, CA) and analyzed with the Aperio ImageScope membrane algorithm for cell membrane analysis.8 An external pathologist validated the membrane algorithm. CD4+ TILs positive for FoxP3 (putative Tregs) were counted manually by a certified pathologist of the NIH Laboratory of Pathology, Bethesda, MD.
Statistical analysis
For statistical evaluation of the immunological data, the Wilcoxon matched-pairs signed rank test or the Friedman test with Dunn’s multiple comparisons was used when appropriate (GraphPad Software, La Jolla, CA). Correlations were carried out using the non-parametric Spearman matrix (GraphPad Software). A P value < 0.05 was considered significant.
Results
Analysis of PBMC immune cell subsets
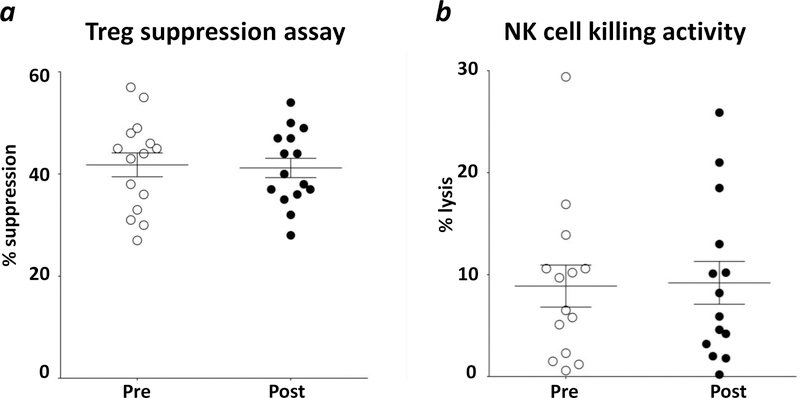
Thirty-one phenotypes (Supporting Information Table 2) of circulating immune cell subsets were analyzed by flow cytometry in 20 patients receiving i.t.-s.c. vaccination both pre-vaccination and approximately 113 days post-vaccination. There were no significant changes in the frequency of any of the immune cell subsets analyzed post- vs. pre-vaccine (data not shown). However, a trend was observed (p < 0.025) with decreases in serum PSA and a lower percentage of circulating Tregs post-vaccination (see Supporting Information Fig. 1). Treg and NK function were also analyzed from patients’ PBMCs post- vs. pre-vaccination (Fig. 1). The mean values of Treg suppressive activity at a Treg vs. CD4 ratio of 1:1 were 41.8% ±2.3% SEM. Similarly, at the Treg vs. CD4 ratios of 1:0.5 and 1:0.1 there were no differences in suppression between pre- and post-vaccine. The NK-mediated lysis pre-vaccine was similar to values post-vaccine at effector vs. target ratio of 50:1 (means were 8.9% ±2.1% SEM at baseline, and 9.2% ± 2.1% SEM, p = 0.855), with similar findings at 100:1, 25:1, and 12.5:1.
Figure 1. Treg and NK activity in the peripheral blood did not change after vaccine.
(a) analysis of suppression function of regulatory T-cell (Treg) from patients’ PBMCs collected at baseline (Pre) and around day 113 after treatment (Post). Target cells, CD4+CD25− T lymphocytes, were cultured in anti-CD3 plate-bound antibody alone, or co-cultured at a 1:1 ratio with magnetically selected Tregs, CD4+CD25+, plus irradiated T cell-depleted PBMCs. Target cell proliferation was measured by [3H]thymidine incorporation and quantified 16 hours later using a liquid scintillation counter. All experiments were done in triplicate. Proliferation of CD4+CD25− T cells without co-culturing with CD4+CD25+ Tregs was defined as 100% proliferation, and the percentage of suppression was calculated. (b) analysis of NK lytic activity based on 5-hour 111In-release assays. NK cells were magnetically isolated from PBMCs collected at baseline (Pre) and on day 113 (Post). K562 cells labeled with 60µCi 111In-oxyquinoline were used as target cells. Results shown are at the 50:1 ratio. Averages ± standard error of the mean are shown.
Digital IHC of prostate biopsy specimens
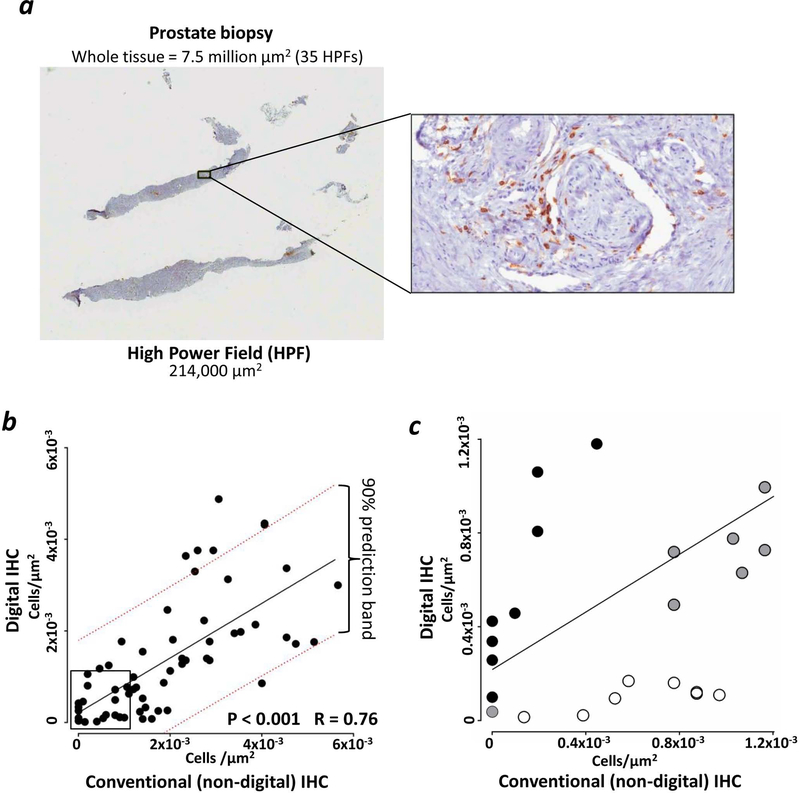
For the digital analysis of TILs, prostate sections were stained for CD4-DAB or CD8-DAB. Sixty-two prostate sections were digitally analyzed, corresponding to an average of 38 ±3 SEM high power fields (HPFs) per section (min–max = 3–100 HPFs) (one representative example of these measurements is shown in Fig. 2a). The differences in HPF measurements occurred because of the different sizes of biopsies analyzed.
Figure 2. Digital IHC allowed analysis of the entire prostate biopsy sections with similar results compared to non-digital IHC.
Immunohistochemical analysis (IHC) of CD4 i.t. infiltration was performed in 30 biopsy specimens (12 pre- and 18 post-vaccine) while for CD8 it was performed on 32 biopsy specimens (13 pre- and 19 post-vaccine). (a) representation of one small prostate biopsy stained for CD4-DAB. The comparison between one high power field (HPF) and the entire tissue section is shown. (b) Regression analysis of measurements of T-cell infiltrates performed by conventional, non-digital, IHC and computer-guided analysis from digitalized scans. Linear regression (solid black line) and 90% prediction power range (dotted red lines) are shown. (c) Magnification of the square in Fig. 2b, highlighting differences in TIL counts <1.2×10⁻³/µm2 between digital and non-digital IHC. Dark circles (n=8): TIL counts that were higher with digital IHC compared to non-digital IHC; empty circles (n=8): TIL counts that were higher with non-digital IHC compared to digital IHC; grey circles (n=7): TIL counts that were similar between digital IHC and non-digital IHC.
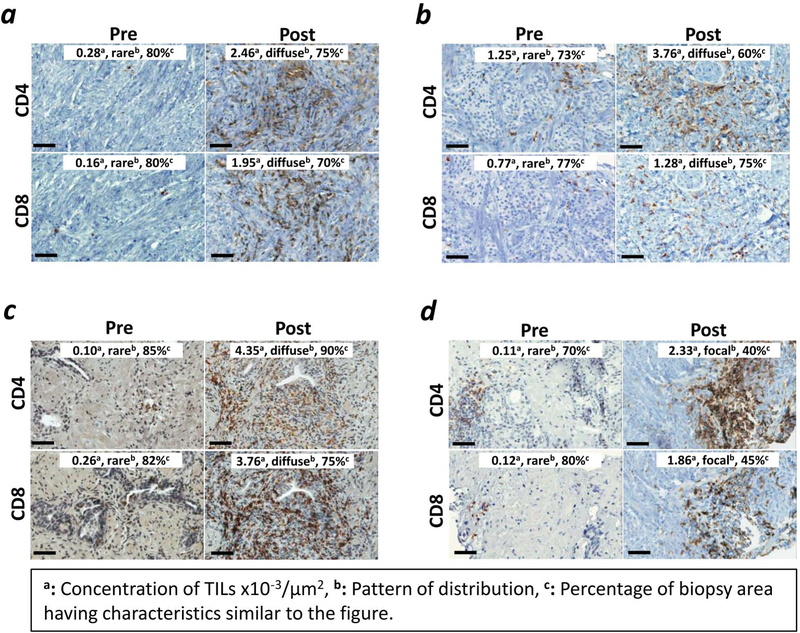
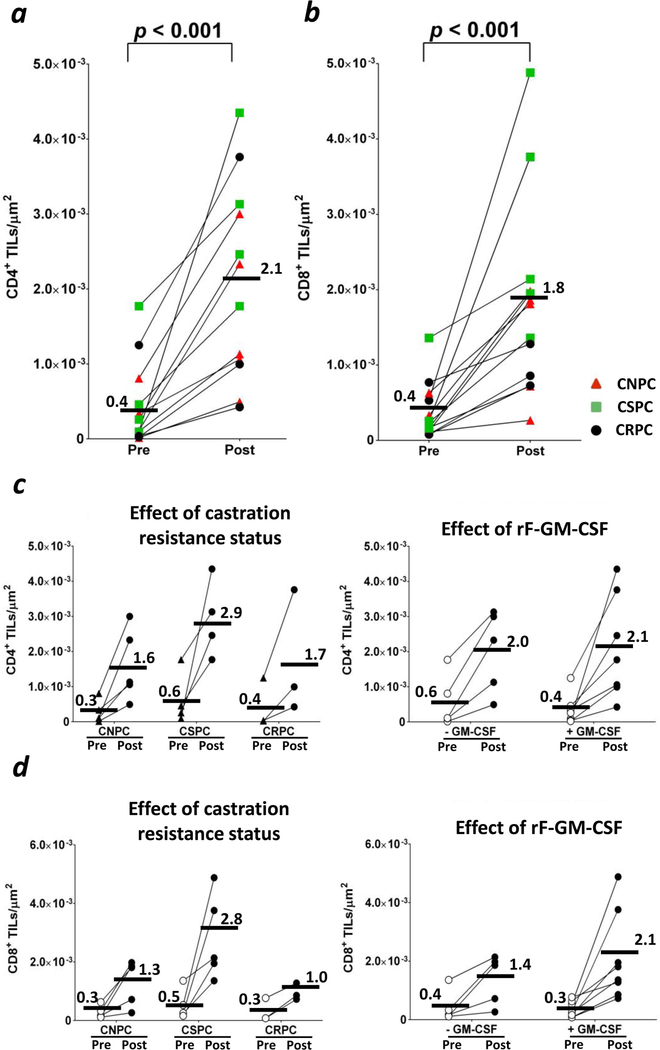
The measurements obtained with digital analysis (Supporting Information Table 3) showed a direct correlation with those from non-digital analysis, although the two methods gave more similar results when TILs were <2×10⁻³/µm2 (Fig. 2b). Images of biopsy samples from all patients showed an increase post-vaccine of staining for CD4+ in the stroma adjacent to tumor cells and within the tumor (Fig. 3). Compared to pre-vaccine, CD4+ TILs (Figs. 3 and 4a) increased post-vaccine in all patients. This was observed independent of castration resistance status and rF-GM-CSF administration (Fig. 4c, left and right panels, respectively). Patients with lower CD4+ TILs pre-vaccine showed a greater increase in CD4+ TILs post-vaccination, as compared to those patients with higher levels of CD4+ TILs pre-vaccination (Fig. 5a). In addition, there was a statistically significant (p < 0.001) inverse correlation between CD4+ TILs pre-vaccination vs. CD4+ TILs post-vaccination (Figs. 5b and 5c). Furthermore, there was a trend for an inverse correlation between CD4+ TILs post-vaccine and CD4+ PBMCs post-vaccine (Supporting Information Fig. 2a). A trend was also observed in high CD4:CTLA4 Treg ratio in PBMCs post-vaccination and low intraprostatic CD4 TILs pre-vaccination (Supporting Information Fig. 2b).
Figure 3. Following vaccine, CD4+ and CD8+ TILs increased in all patients within the tumor parenchyma.
Representation of CD4+ and CD8+ TILs from four patients. TILs are shown at 40X magnification before vaccine (Pre) and around day 113 after vaccine (Post). Bars represent 50 µm. CD4 and CD8 TILs increased post-vaccine in all patients. Digital scans analyzed entire prostate biopsies, corresponding to an average of 38 ±3 SEM HPFs per section (min–max = 3–100 HPFs). Representative HPFs for patient #21 (a), #16 (b), #13 (c), and #5 (d) are shown. Insets: in order from left to right, concentration of TILs x10−3/µm2, pattern of distribution (rare, diffuse, or focal), and percentage of area of biopsy having characteristics similar to the figure are indicated.
Figure 4. CD4+ and CD8+ TILs increased in all patients. This was independent of castration resistance status or rF-GM-CSF administration.
CD4 and CD8 TILs increased post-vaccine in all patients. TILs were calculated by digitalized analyses of entire prostate biopsies, corresponding to an average of 38 ±3 SEM HPFs per section (min–max = 3–100 HPFs). (a) CD4+ TILs counts at baseline (Pre) and around day 113 (Post). (b) CD8+ TILs counts at baseline (Pre) and around day 113 (Post). Red triangles: castration-naïve prostate cancer patients (CNPC). Green squares: castration-sensitive prostate cancer patients (CSPC). Black circles: castration-resistant prostate cancer patients (CRPC). (c) Effect of castration resistance status (left) and rF-GM-CSF administration (right) on the increase of CD4+ TILs. (d) Effect of castration resistance (left) and rF-GM-CSF administration (right) on the increase of CD8+ TILs. Bars represent averages. P < 0.05 was considered statistically significant.
Figure 5. Patients with low infiltration of CD4+ TILs pre-vaccine showed a greater increase of CD4+ TILs post-vaccine.
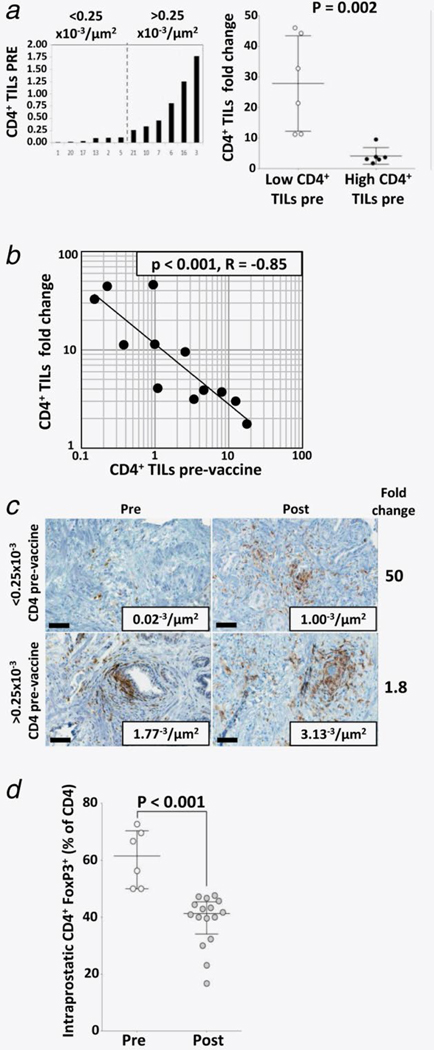
(a) distribution of CD4+ TILs pre-vaccine (left) and difference of CD4+ TILs changes post-vaccine (right). Bars on the right graph represent averages ± standard error of the mean. (b) linear regression analysis comparing CD4+ TILs pre-vaccine vs. CD4+ TILs fold change. (c) representative example in which CD4+ TILs increased more in a patient who had low CD4+ TILs pre-vaccine compared to a patient who had high CD4+ TILs pre-vaccine. Note that, despite the higher increase of CD4+ TILs in the patient with low CD4+ TILs pre-vaccine, CD4+ TILs post-vaccine were fewer compared to the patient who had high CD4+ TILs pre-vaccine. (d) The average of regulatory T lymphocytes (Treg), as percentage of CD4+ TILs, decreased post-vaccine. Bars represent averages ± standard error of the mean.
Since the FoxP3 nuclear stain could not be discriminated with the membrane algorithm by digital IHC, CD4+ FoxP3+ putative Tregs were counted by conventional (non-digital) analysis by a certified pathologist. Although the number of tumor-infiltrating Tregs increased between pre- and post-vaccine (2.1 ± 0.7 and 5.9 ± 0.8 cells/HPF, respectively, p = 0.002), the percentage of Tregs as part of CD4+ TILs decreased, indicating that effector CD4+ TILs increased more than tumor-infiltrating Tregs (Fig. 5d).
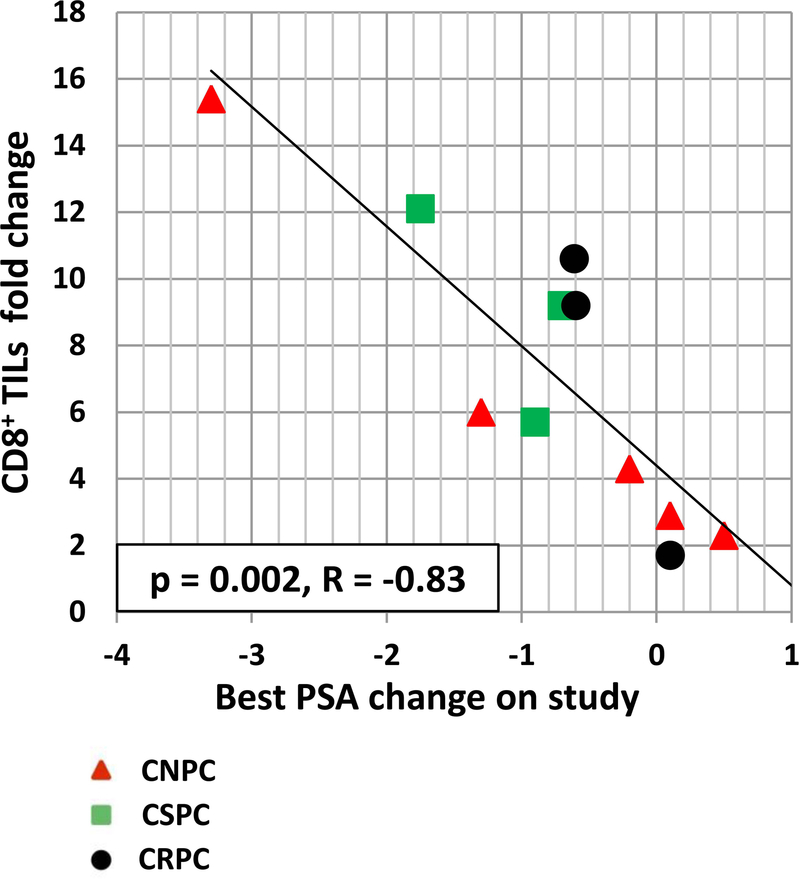
In addition to CD4+ TILs, changes in CD8+ TILs were also evaluated. CD8+ TILs post-vaccination also increased in the stroma adjacent to tumor cells and within the tumor (Fig. 3) in all patients (Fig. 4b). This was observed independently of rF-GM-CSF administration (Fig. 4d, right panel), or castration resistance status (Fig. 4d, left panel). There was, however, a statistically significant correlation (p = 0.002, R = −0.83) observed between increases in CD8 TILs post-vaccine vs. pre-vaccine, and decreases in serum PSA (Fig. 6).
Figure 6. Patients with a higher increase of CD8+ TILs post-vaccine showed a decrease in serum PSA values.
Linear regression analysis of best PSA change (ng/ml) on study vs. CD8+ TILs fold change. Red triangles: castration-naïve prostate cancer patients (CNPC). Green squares: castration-sensitive prostate cancer patients (CSPC). Black circles: castration-resistant prostate cancer patients (CRPC). Of the 13 patients having CD8+ TILs measurements at both pre- and post-vaccine, two were not included in the analysis because they had unmeasurable serum PSA values (<0.2 ng/mL) at both time points.
Discussion
In 2010, the FDA approved the first therapeutic cancer vaccine, the dendritic cell (DC)‒based vaccine Sipuleucel-T, for the treatment of asymptomatic or minimally symptomatic metastatic castration-resistant prostate cancer (mCRPC); the vaccine has shown an increase in overall survival (OS) of 4.1 months (25.8 vs 21.7 months for placebo control arm; p = 0.032).9 An international multicenter phase III clinical trial in the same patient population is ongoing with PROSTVAC.10 This was based in part on a 43-center randomized placebo-controlled phase II trial of minimally symptomatic mCRPC patients,11 in which PROSTVAC improved median OS 8.5 months relative to a placebo, the control vector (OS = 25.1 vs 16.6 months, P = 0.006).
In the trial reported here with PROSTVAC, we performed comparative analyses between PBMC immune cell subsets, by multi-color flow cytometry, and tumor immune infiltrates, by computerized digital IHC. There are several potential advantages of using digital IHC instead of the conventional, non-digital, IHC. The manual quantification of cell markers is usually limited to the analysis of three high powered fields (HPFs) per each tissue section, while the use of computerized systems for digital image analysis is faster, objective, and can analyze entire tissue sections (Fig. 2a), which in the study reported here corresponded to ≤ 100 HPFs. Several reports have shown that digital IHC image analyses of membrane markers were similar to the visual evaluation of the pathologist.8, 12 Moreover, the digitalized images of IHC slides are easily read by any pathologist on a computer monitor.13, 14 In this study, there were differences between digital and non-digital IHC analyses that could be due to sampling errors in the non-digital IHC analyses. As an example, for counts <1.2×10⁻³/µm2 (Fig. 2c), in eight cases the non-digital IHC measured more TILs when compared to digital IHC. Similarly, for another eight cases, the digital IHC measured more TILs when compared to non-digital IHC. These differences between digital and non-digital counts can be explained by the fact that digital IHC analysis represented the average of the total tissue present in the biopsy, while the average from the non-digital IHC analysis could have been skewed by focusing on a limited number of fields (n=3). Moreover, the algorithm used for the count of TILs by digital IHC was validated by a certified pathologist, supporting the accuracy of the digital IHC evaluations. The regression analysis of the digital and non-digital IHC results showed a P < 0.001 and an R = 0.76, confirming that the two methods delivered similar results; this finding is in line with other publications that compared digital and non-digital IHC analyses. 8, 12–14
In PBMCs, there were no changes in individual responses between pre- and post-vaccine in the frequency of 31 immune cell subsets (listed in Supporting Information Table 2), or in the function of Tregs and NK cells (Fig. 1). These are quite surprising observations in light of the fact that all patients received s.c. priming and booster vaccinations and that, as previously reported,2 several of these patients mounted immune responses to PSA and to the prostate antigen NGEP post-vaccination. A possible explanation is that the i.t. vaccination caused a prostate tissue inflammation that “sequestered” the vaccine-stimulated immune cells inside the tumor microenvironment, leaving unchanged the features of immune cell subsets in the peripheral blood. Supporting this is the fact that 19 of 21 patients had stable or decreased PSA values after vaccination. Also, a lower percentage of circulating Tregs post-vaccine correlated with decreased serum PSA values (Supporting Information Fig. 1). One also cannot exclude that a more extensive analysis of PBMC immune cell subsets could identify changes not observed in this study. It is possible that analyzing PBMC immune subsets 4 weeks after the last vaccination could exceed the possible peak of effector cell responses after vaccination. We have described in prior publications15 statistically significant changes in PBMC immune cell subsets 4 weeks after vaccine, suggesting that, at least at 4 weeks after vaccination, it is possible to measure relevant changes in immune subsets.
A multi-parametric approach, designed by Siebert et al.,16 can be potentially helpful for interrogations of complex higher-order flow cytometry data sets and could allow the identification of potentially clinically relevant findings that were unidentifiable with more conventional flow analyses.
A recent report15 of a phase II clinical trial, in which prostate cancer patients were treated with systemic PROSTVAC vaccine, showed an association between overall survival and changes in both the frequency of Treg and effector memory CD4 T lymphocytes in the peripheral blood after vaccination. In addition, there was a direct correlation between the post-vaccine changes of Tregs and monocytic MDSC in peripheral blood. It is possible that the absence of such changes in our study could be due to the fact that patients received both systemic and intratumoral vaccination; this could have segregated the immune response mainly within the prostate.
In striking difference with PBMCs, there was a robust increase in CD4+ TILs within the tumor parenchyma (Fig. 3) of all patients (Fig. 4a). One concern about immune infiltration within prostates was whether castration resistance status, ADT treatment, or rF-GM-CSF administration could affect the increase in TILs. We found that the increase in CD4+ TILs post-vaccine was not related to either castration resistance status (Fig 4C) or rF-GM-CSF vaccination (Fig 4D). Interestingly, the magnitude of how CD4+ TILs increased post-vaccine depended on the abundance of CD4+ TILs that were infiltrating prostates pre-vaccine. Patients with low CD4+ TILs pre-vaccine showed a greater increase in CD4+ TILs post-vaccine (Figs. 5a and 5b). Furthermore, CD4+ TILs infiltration matched with the frequency of PBMC CD4+ lymphocytes, where low CD4+ TILs post-vaccine corresponded to high CD4+ PBMCs post-vaccine (Supporting Information Fig. 2a), while low intraprostatic CD4+ TILs pre-vaccine correlated with high CD4+:CTLA4+ Tregs ratio in PBMCs post-vaccine (Supporting Information Fig. 2b). It should be noted that patients with lower levels of CD4+ TILs pre-vaccine showed a greater fold change in TILs post-vaccine than patients with higher levels of TILs pre-vaccine (Fig. 5c). In support of this, while the number of tumor-infiltrating Tregs increased post-vaccine, the percentage of Tregs as part of CD4+ TILs decreased significantly (Fig. 5d), indicating that the effector CD4+ TILs increased more than Tregs.
As seen in Figs. 3 and 4b, there was an increase in CD8+ TILs post- vs. pre-vaccination. However, there were no correlations between changes in CD8+ TILs and CD8+ T cells or any other immune subset in PBMCs.
This trial did not contain a cohort in which patients received a control vaccine vector without the transgenes; this was supported by the observations of preclinical mouse studies in which tumor-bearing mice receiving i.t. fowlpox-TRICOM vaccine had anti-tumor responses only when the TRICOM vaccine contained the tumor-associated antigen transgene. We also showed in this study that a higher increase in CD8+ TILs post-vaccine statistically corresponded to a greater decrease of serum PSA (Fig. 6), consistent with the supposition that CD8+ T lymphocytes were tumor lytic.
It should be emphasized that the findings described in this study are hypothesis-generating only, since no final conclusions can be drawn due to the relatively small number of patients, the non-randomized trial design, and the heterogeneity of the sampled patient population. However, based on the results of this phase I trial, a new phase II trial is being designed in which newly diagnosed patients will receive systemic PROSTVAC vaccination. This trial will evaluate pre- and post-vaccine immune cell subsets, including CD4, CD8, Treg, MDSC, and other myeloid cells, in PBMC and in tumor biopsies harvested at baseline and whole mount prostate post-vaccine. One major goal of this new study is to address the question of whether s.c. PROSTVAC vaccination alone can have similar local effects as seen in this study on organ confined prostate cancer.
Supplementary Material
What’s new?
The analysis of immune infiltrates by computerized digital immunohistochemistry within tumors after immunotherapy can allow the identification of immune responses in the absence of changes in circulating immune cell subsets. In this hypothesis-generating study, the comparison between tumor-infiltrating lymphocytes (TILs) and circulating immune cell subsets of prostate cancer patients identifies changes in CD4+, CD8+, and Treg of TILs after vaccine that were not observed in PBMC flow-cytometry analyses.
Acknowledgements
The authors thank Debra Weingarten for her editorial assistance in the preparation of this manuscript.
Grant support: This research was supported by the Intramural Research Program of the Center for Cancer Research, National Cancer Institute, National Institutes of Health.
References
- 1.Kudo-Saito C, Schlom J, Hodge JW. Intratumoral vaccination and diversified subcutaneous/ intratumoral vaccination with recombinant poxviruses encoding a tumor antigen and multiple costimulatory molecules. Clin Cancer Res 2004;10:1090–9. [DOI] [PubMed] [Google Scholar]
- 2.Gulley JL, Heery CR, Madan RA, et al. Phase I study of intraprostatic vaccine administration in men with locally recurrent or progressive prostate cancer. Cancer Immunol Immunother 2013;62:1521–31. [DOI] [PMC free article] [PubMed] [Google Scholar]
- 3.A Phase I Feasibility Study of an Intraprostatic PSA-Based Vaccine in Men With Prostate Cancer With Local Failure Following Radiotherapy or Cryotherapy or Clinical Progression on Androgen Deprivation Therapy in the Absence of Local Definitive Therapy, 2006; http://clinicaltrials.gov/ct2/show/NCT00096551. [DOI] [PubMed]
- 4.Scher HI, Halabi S, Tannock I, et al. Design and end points of clinical trials for patients with progressive prostate cancer and castrate levels of testosterone: recommendations of the Prostate Cancer Clinical Trials Working Group. J Clin Oncol 2008;26:1148–59. [DOI] [PMC free article] [PubMed] [Google Scholar]
- 5.Memorial Sloan-Kettering Cancer Center. Prostate Cancer Nomograms: PSA Doubling Time http://nomograms.mskcc.org/Prostate/PsaDoublingTime.aspx.
- 6.Qi CF, Nieroda C, De Filippi R, et al. Macrophage colony-stimulating factor enhancement of antibody-dependent cellular cytotoxicity against human colon carcinoma cells. Immunol Lett 1995;47:15–24. [DOI] [PubMed] [Google Scholar]
- 7.Mannon PJ, Leon F, Fuss IJ, et al. Successful granulocyte-colony stimulating factor treatment of Crohn’s disease is associated with the appearance of circulating interleukin-10-producing T cells and increased lamina propria plasmacytoid dendritic cells. Clin Exp Immunol 2009;155:447–56. [DOI] [PMC free article] [PubMed] [Google Scholar]
- 8.Laurinaviciene A, Dasevicius D, Ostapenko V, et al. Membrane connectivity estimated by digital image analysis of HER2 immunohistochemistry is concordant with visual scoring and fluorescence in situ hybridization results: algorithm evaluation on breast cancer tissue microarrays. Diagn Pathol 2011;6:87. [DOI] [PMC free article] [PubMed] [Google Scholar]
- 9.Kantoff PW, Higano CS, Shore ND, et al. Sipuleucel-T immunotherapy for castration-resistant prostate cancer. N Engl J Med 2010;363:411–22. [DOI] [PubMed] [Google Scholar]
- 10.A Randomized, Double-blind, Phase 3 Efficacy Trial of PROSTVAC-V/F +/− GM-CSF in Men With Asymptomatic or Minimally Symptomatic Metastatic Castrate-Resistant Prostate Cancer (Prospect), 2011; http://clinicaltrials.gov/ct2/show/NCT01322490.
- 11.Kantoff PW, Schuetz TJ, Blumenstein BA, et al. Overall survival analysis of a phase II randomized controlled trial of a Poxviral-based PSA-targeted immunotherapy in metastatic castration-resistant prostate cancer. J Clin Oncol 2010;28:1099–105. [DOI] [PMC free article] [PubMed] [Google Scholar]
- 12.Rizzardi AE, Johnson AT, Vogel RI, et al. Quantitative comparison of immunohistochemical staining measured by digital image analysis versus pathologist visual scoring. Diagn Pathol 2012;7:42. [DOI] [PMC free article] [PubMed] [Google Scholar]
- 13.Nassar A, Cohen C, Albitar M, et al. Reading immunohistochemical slides on a computer monitor--a multisite performance study using 180 HER2-stained breast carcinomas. Appl Immunohistochem Mol Morphol 2011;19:212–7. [DOI] [PubMed] [Google Scholar]
- 14.Nassar A, Cohen C, Agersborg SS, et al. A multisite performance study comparing the reading of immunohistochemical slides on a computer monitor with conventional manual microscopy for estrogen and progesterone receptor analysis. Am J Clin Pathol 2011;135:461–7. [DOI] [PubMed] [Google Scholar]
- 15.Gulley JL, Madan RA, Tsang KY, et al. Immune impact induced by PROSTVAC (PSA-TRICOM), a therapeutic vaccine for prostate cancer. Cancer Immunol Res In press. [DOI] [PMC free article] [PubMed]
- 16.Siebert JC, Wang L, Haley DP, et al. Exhaustive expansion: A novel technique for analyzing complex data generated by higher-order polychromatic flow cytometry experiments. J Transl Med 2010;8:106. [DOI] [PMC free article] [PubMed] [Google Scholar]
Associated Data
This section collects any data citations, data availability statements, or supplementary materials included in this article.


