

SUMMARY
Activation of inositol-requiring enzyme (IRE1α) is an indispensable step in remedying the cellular stress associated with lipid perturbation in the endoplasmic reticulum (ER) membrane. IRE1α is a single-spanning ER transmembrane protein possessing both kinase and endonuclease functions, and its activation can be fully achieved through the dimerization and/or oligomerization process. How IRE1α senses membrane lipid saturation remains largely unresolved. Using both computational and experimental tools, we systematically investigated the dimerization process of the transmembrane domain (TMD) of IRE1α and found that, with help of the serine 450 residue, the conserved tryptophan 457 residue buttresses the core dimerization interface of IRE1α-TMD. BiFC (bimolecular fluorescence complementation) experiments revealed that mutation on these residues abolished the saturated fatty acid-induced dimerization in the ER membrane and subsequently inactivated IRE1α activity in vivo. Therefore, our results suggest that the structural elements of IRE1α-TMD serve as a key sensor that detects membrane aberrancy.
Graphical Abstract
In Brief
Cho et al. demonstrate that the conserved tryptophan residue on the transmembrane domain of IRE1α is crucial for palmitate-induced IRE1α dimerization and/or oligomerization in vivo. Mutation of this residue inhibits the enzymatic activity of IRE1α, suggesting that the intrinsic feature of the TMD sequence senses membrane lipid saturation.
INTRODUCTION
The endoplasmic reticulum (ER) is a cellular compartment responsible for protein folding, lipid synthesis, and calcium storage. Physiological conditions such as elevated levels of free fatty acids and glucose, oxidative stress, and inflammatory cytokines are known to induce ER stress, leading to the accumulation of unfolded or misfolded proteins or toxic lipid species (Wang and Kaufman, 2012). Cellular adaptation to ER stress is achieved through activation of the unfolded protein response (UPR), an integrated signal transduction pathway mediated by three ER stress sensor proteins, IRE1 (inositol-requiring enzyme 1), PERK (protein kinase R [PKR]-like ER kinase), and ATF6 (activating transcription factor 6) (Kaufman, 1999). UPR signaling coordinates cellular responses by downregulating protein translation, enhancing the expression of ER chaperone proteins that promote protein refolding, and activating proteases that are involved in the degradation of misfolded proteins. When these adaptive processes are insufficient to attenuate ER stress, the UPR triggers apoptosis (Hetz and Papa, 2018; Wang and Kaufman, 2014).
Among the three UPR sensor proteins, IRE1α is the most conserved protein and is ubiquitously expressed in cells. IRE1α is a type I transmembrane protein with an N-terminal luminal domain (LD) that acts as an ER stress sensor and a C-terminal KEN (kinase-extension nuclease) domain containing both Ser/Thr kinase and endoribonuclease activities (Korennykh and Walter, 2012). Under ER stress conditions, the LD of IRE1α oligomerizes in the lumen, promoting self-association of the protein (Oikawa et al., 2009). The dimerization of the kinase domain (KD) facilitates trans-autophosphorylation, subsequently activating the RNase domain (RD) (Ali et al., 2011). The active form of IRE1α splices mRNA of the X-box binding protein-1 (XBP1), producing the spliced XBP1 transcription factor (XBP1S) and thus resulting in the upregulation of genes involved in enhancing ER protein-folding capacity and degrading unfolded or misfolded proteins (Lee et al., 2003; Yoshida et al., 2001).
Dimerization of the LD or cytosolic domain is known to be important for IRE1α activation, whereas dimerization of its transmembrane domain (TMD) in the activation process remains unclear. Hydrogen bonds and hydrophobic interactions stabilize the dimerization interface of the LD, and disruption of these interactions prevents the self-association of the protein, subsequently reducing both the autophosphorylation and the RNase activities of IRE1α (Li et al., 2010; Zhou et al., 2006). In addition, mutations at the dimerization interface on the KD diminish both the kinase and RNase activities (Ali et al., 2011). Interestingly, a previous study suggested that the IRE1α molecule lacking the LD is able to sense the lipid perturbation in the membrane and contribute to IRE1α activation through the TMD (Volmer et al., 2013). Using a reporter assay that detects its downstream factor, XBP1S, a follow-up study concluded that generic sequence features of the IRE1α-TMD are sufficient for sensing membrane aberrancy (Kono et al., 2017). However, because of the dynamic and complex nature of the UPR signaling network (Cho et al., 2013; Tsuru et al., 2016; Yoshida et al., 2001), direct observation of the IRE1α-TMD conformation is required to establish which features of the IRE1α-TMD are crucial for IRE1α activation as well as lipid saturation sensing.
In this study, we investigated how human IRE1α senses membrane lipid saturation. To directly monitor the conformation of IRE1α-TMD, we developed an in vivo BiFC (bimolecular fluorescence complementation) assay to confirm that lipid saturation induces the dimerization of IRE1α-TMD in the ER membrane. Systematic approaches using the in vivo BiFC assay and MD simulations identified an essential residue, tryptophan 457, which supports the core dimerization interface of IRE1α-TMD. Our data reveal a key regulatory mechanism in which unique structural features of the tryptophan residue modulate the saturated fatty acid-induced dimerization of IRE1α-TMD and thus promote an active conformation of IRE1α.
RESULTS
The Isolated TMD of IRE1α Dimerizes in Membranes
To assess whether the TMD of IRE1α dimerizes in the lipid bilayer, we used an established Förster resonance energy transfer (FRET) assay (Li et al., 2005) that measures the self-association of TMD peptides in 1-palmitoyl 2-oleoyl phosphatidylcholine (POPC) liposomes. When both donor (fluorescein isothiocyanate [FITC]) and acceptor (carboxytetramethylrhodamine [TAMRA]) labeled IRE1α-TMD peptides were present in the POPC liposomes, we observed a decrease in the donor fluorescence and an increased in the acceptor fluorescence, indicating that FRET has occurred (Figure 1A). The observed FRET values at various acceptor-to-lipid ratios (Figure 1B) were comparable with the previously measured TMD dimerization of fibroblast growth factor receptor 3 (FGFR3) in the POPC liposomes using the same dye pair (Li et al., 2005). This indicates that the observed FRET in the IRE1α-TMD-containing liposomes is not due entirely to random acceptor and donor colocalization and that IRE1α-TMD has a propensity for self-association in liposomes.
Figure 1. The Isolated IRE1α-TMD Dimerizes in Both Synthetic and Cellular Membranes.

(A) Fluorescence spectra of FITC- and TAMRA-labeled TMD peptides inserted in POPC liposomes:0.1 mol % of donor (FITC-TMD) or 0.1 mol % of acceptor (TAMRA-TMD) peptide was reconstituted in 400 μM of lipid. The spectra (excitation at 439 nm) were measured for the samples containing the donor and acceptor peptides (red), as well as control samples containing only the donor (black) and only the acceptor (blue) peptides.
(B) Dependence of fluorescence energy transfer as a function of the acceptor/lipid molar ratio. The ratio of donor-labeled to acceptor-labeled peptides was kept at 1, while the ratio of total peptide to lipid was varied. The final concentration of the lipid was fixed at 400 μM. The FRET efficiency was calculated as described in STAR Methods. Values are mean ± SD, with n = 3.
(C) SDS-PAGE analysis of the IRE1α-TMD peptide. The peptides dissolved in × lithium dodecyl sulfate (LDS) sample loading buffer were loaded onto 9% Bis-Tris gel. Bands were visualized using silver staining.
(D) Top: TOXCAT assays. CAT activities from cells expressing ToxR-TMD-MBP were quantified and normalized to GpA-WT. GpA-WT and its disruptive mutant (GpA-G83I) served as positive and negative controls, respectively. Values are mean ± SD, with n = 6. Bottom: western blotting analysis. The expression levels of ToxR-TMD-MBP proteins were measured using anti-MBP antibody. The expression levels were also normalized to correct the CAT activity.
(E) MalE complementation assay. The TOXCAT chimeric proteins (ToxR-TMD-MBP) were plated on M9 agar containing 0.4% maltose. MalE activity was used to show appropriate TMD topology.
Two additional experiments further support our conclusion that the IRE1α-TMD dimerizes and/or oligomerizes in the lipid bilayer. First, SDS-PAGE analysis, which is commonly used to detect the oligomerization status of TMDs, showed that the IRE1α-TMD peptide has several oligomeric states, as evident by the higher band (Figure 1C). The monomeric and dimeric states did not separate clearly, possibly reflecting the dynamic equilibrium between the two states during the electrophoresis, which is frequently observed in short TMD peptides (Ng and Deber, 2010). Second, the results of a TOXCAT assay, in which association between the TMDs in the inner membrane of E. coli drives expression of the reporter gene chloramphenicol acetyltransferase (CAT) (Russ and Engelman, 1999), suggested dimerization of the IRE1α-TMD peptides in the cellular membrane. CAT activity was normalized to a positive control (the TMD of glycophorin A [GpA]), which is known to dimerize strongly, while GpA-G83I served as a dimerization-impaired mutant (a negative control) (Lemmon et al., 1992). The CAT activity of IRE1α-TMD was significantly higher than the negative control (Figure 1D), indicating that the IRE1α-TMD dimerizes in a biological membrane. Furthermore, MalE complementation assay showed that the lack of a TMD did not allow E. coli to grow on maltose, whereas all other constructs exhibited robust growth. This indicates that the maltose-binding protein (MBP) domain of these fusion proteins was localized on the periplasm of the NT326 cells, and the IRE1α-TMD was correctly inserted in the cell membrane (Figure 1E). Therefore, we showed that the isolated TMD of the IRE1α protein dimerizes and/or oligomerizes in lipid bilayers.
Both Trp457 and Ser450 Support Palmitate-Activated Dimerization of the IRE1α-ΔLD In Vivo
Membrane lipid saturation induced by a saturated fatty acid, palmitate, is known to upregulate the IRE1α activity (Kitai et al., 2013; Volmer et al., 2013). In contrast to the conventional UPR activation initiated by accumulation of unfolded protein in the ER lumen, membrane lipid saturation did not trigger the clustering of IRE1α proteins via oligomerization of the LD, and thus palmitate is thought to use a different mechanism of activating the IRE1α protein (Kitai et al., 2013). In addition, the IRE1α protein lacking the LD (30–407 aa, denoted as IRE1α-ΔLD) can be activated by palmitate (Volmer et al., 2013), suggesting that palmitate could directly regulate the conformation of IRE1α-TMD. To directly monitor palmitate-induced dimerization in vivo, we used a BiFC assay that has been successfully used to quantify dimerization of both the seven TMD (7TM) receptor and the receptor tyrosine kinases (RTKs) family proteins in vivo (Kosel et al., 2010; Tao and Maruyama, 2008). Therefore, to dissect the role of palmitate on the dimerization of IRE1α-TMD, we used the IRE1α-ΔLD construct devoid of the upstream signal (Volmer et al., 2013). The N-terminal Venus fragment (Myc-tagged VN) and the C-terminal Venus fragment (HA-tagged VC) were inserted downstream of the signal peptide (1–18 aa) on the IRE1α-ΔLD (Figure 2A) (Shyu et al., 2006). Once both VN-IRE1α-ΔLD and VC-IRE1α-ΔLD are in close proximity in the ER membrane, the Venus fragments will be able to reconstitute a native and fluorescent protein (Figure 2B).
Figure 2. W457A and S450A Mutations Abolish Both Dimerization and Activity of the IRE1α-ΔLD In Vivo.

(A) Scheme of IRE1α-ΔLD constructs used in the BiFC assay. Myc-tagged Venus N terminus fragment and HA-tagged Venus C terminus fragment were inserted between the signal peptide (SP) and the truncated LD. The amino acid residue numbers of the human IRE1α are shown in the boxes. The TMD sequence of IRE1α is shown on top.
(B) Schematic diagram of the BiFC assay. Homodimerization of the IRE1α-ΔLD results in a functional Venus fluorescent protein.
(C) Specific homodimerization of IRE1α-ΔLD detected by BiFC. IRE1α−/− MEF cells co-expressing VN-IRE1α-ΔLD and VC-IRE1α-ΔLD or their W457A and S450A mutant constructs were treated with 2% BSA media, 0.4 mM palmitate (PA), or 0.4 mM oleate (OA) dissolved in 2% BSA media, or 5 μg/mL tunicamycin (Tm) for 2 h. The Venus fluorescence was detected by confocal microscopy. Scale bars, 42 μm.
(D) Fluorescence quantification for (C). The corrected total cell fluorescence (CTCF) was calculated for each cell and then normalized to the PA-treated samples. Sixteen to 30 cells were quantified for each replicate. Values are reported as mean ± SD (n = 2); **p < 0.001 (Student’s t test).
(E) Western blot analysis of the total IRE1α-ΔLD expression levels. As described in (C), cells were treated with BSA or 0.4 mM PA for 2 h. GAPDH was used as a loading control.
(F) RT-PCR of Xbp1 mRNA from cells transfected with VN-IRE1α-ΔLD and VC-IRE1α-ΔLD or their W457A and S450A mutant constructs. Cells were treated with 2% BSA or 0.4 mM PA for 2 h, and total mRNA isolated from the cells was subjected to RT-PCR analysis. The unspliced (U) and spliced (S) products and heteroduplex species (HD) are indicated. GAPDH was used as a loading control.
(G) Quantification of spliced XBP1 (XBP1S). The fraction of spliced Xbp1 mRNA in each sample was quantified as described in STAR Methods. Data represent the mean ± SD (n = 3); **p < 0.001 (Student’s t test).
(H) Alanine-scanning mutagenesis of the IRE1α-TMD. IRE1α−/− MEF cells co-expressing alanine mutant VN and VC plasmids were treated with BSA or 0.4 mM PA for 2 h. The fold change of Venus fluorescence between the BSA- and PA-treated cells was quantified and normalized to WT. Values are reported as mean ± SE (n = 2).
See also Figures S1 and S2.
We monitored the early response of palmitate-induced dimerization of IRE1α-ΔLD in the IRE1α−/− mouse embryonic fibroblast (MEF) cells expressing both VN-IRE1α-ΔLD and VCIRE1α-ΔLD. IRE1α−/− MEF cells have a negligible amount of endogenous IRE1α proteins (Volmer et al., 2013) and thus allow the monitoring of the dimerization efficiency of exogenously expressing IRE1 variants in vivo. We first confirmed that the expression levels of IRE1α-ΔLD in BSA- and palmitate-treated IRE1α−/− MEF cells were comparable with the endogenous IRE1α levels in its parental MEF-WT cells (Figures S1A and S1B). Consistent with this, the exogenous expression of IRE1α-ΔLD did not alter the palmitate-induced activation of endogenous eIF2α, a subsequent downstream factor of the other UPR sensor PERK (Figures S1C and S1D), demonstrating that the PERK pathway was not perturbed by exogenously expressing the IRE1α-ΔLD proteins. In contrast, upon palmitate treatment at 2 h, the Venus fluorescence intensity increased significantly compared with the BSA-treated control cells (Figures 2C and 2D), indicating the reconstitution of the Venus fluorescent protein and thus dimerization of the VN-IRE1α-ΔLD-WT and VC-IRE1α-ΔLD-WT proteins.
Several lines of evidence suggest that the observed dimerization of IRE1α-ΔLD in the in vivo BiFC assay was specifically induced by palmitate. First, the IRE1α-ΔLD proteins were expressed at similar levels in both the BSA- and palmitate-treated cells (Figures 2E, S1A, and S1B), suggesting that the enhanced dimer formation of IRE1α-ΔLD by palmitate is not due to a difference in the protein expression levels between the two conditions. Second, the palmitate-induced dimerization of IRE1α-ΔLD-WT was further corroborated by the enhanced XBP1 splicing efficiency (Figures 2F and 2G). Third, a monounsaturated fatty acid, oleate (OA), failed to induce the dimerization of IRE1α-ΔLD (Figures 2C and 2D), suggesting that the induced dimerization of IRE1α-ΔLD in the palmitate-treated cells is specifically due to lipid saturation. Furthermore, consistent with the previous study (Volmer et al., 2013), tunicamycin, an ER stress inducer that perturbs protein folding in the ER lumen, was also unable to induce the dimerization of IRE1α-ΔLD (Figures 2C and 2D). Therefore, the enhanced dimerization of IRE1α-ΔLD in vivo is specific to the increased lipid saturation due to palmitate.
To systematically identify the key residues responsible for the dimerization of IRE1α-ΔLD, we performed alanine-scanning mutagenesis on the IRE1α-TMD using the BiFC assay. All residues, except for two native alanines, were mutated to alanine in the VN-IRE1α-ΔLD and VC-IRE1α-ΔLD constructs (Figure 2A). Among the tested mutations, both S450A and W457A were not able to reconstitute the fluorescence in the palmitate-treated cells, indicating an inability to dimerize in the ER membrane (Figures 2C and 2H). The loss of palmitate-induced dimerization of IRE1α-ΔLD with the W457A and S450A mutants resulted in a catalytically inactive state associated with their failure to generate XBP1S (Figures 2F and 2G). The dimerization and RNase defects of both W457A and S450A were not due to lower levels of protein expression than the WT or mislocalization of the mutant proteins under the palmitate-treated condition (Figures 2E, S2A, and S2B, respectively). The obtained Pearson’s correlation coefficients for W457A and S450A were not significantly different from the WT, suggesting that these mutants primarily co-localize with the ER membrane marker protein calnexin in the BSA- and palmitate-treated Hep3B cells (Figures S2A and S2B). Therefore, our in vivo data demonstrate an essential role of both Trp457 and Ser450 in modulating the palmitate-induced dimerization of IRE1α-ΔLD.
IRE1α-TMD Serves as a Sensor for Lipid Membrane Saturation in Mammals
Results of a previous study with the yeast Ire1 showed that the juxtamembrane amphipathic helix, but not its TMD, plays a crucial role in sensing aberrant physical membrane properties (Halbleib et al., 2017). Because the amphipathic helix is conserved on the human IRE1α (Figure 3A) (Halbleib et al., 2017; Kono et al., 2017), we further assessed whether this is also important in regulating the dimerization of IRE1α-ΔLD through activation by membrane lipid saturation. To this end, we mutated two conserved hydrophobic residues (V437 and M440) on the amphipathic helix to arginine and performed the BiFC assay. In contrast to the yeast Ire1 (Halbleib et al., 2017), the two amphipathic helix mutations did not prevent the dimerization of the IRE1α-ΔLD in the ER membrane (Figures 3B and 3C). V437R and M440R helix mutant proteins had similar expression levels as the WT protein (Figure 3D), and they also co-localized with calnexin in both the BSA and palmitate-treated cells (Figures S2A and S2B). Furthermore, the amphipathic helix mutant proteins exhibited wild-type (WT)-like XBP1 splicing activity (Figures 3E and 3F). Therefore, together with the previous study (Kono et al., 2017), our in vivo results strongly suggest that the human IRE1α uses a different sensing mechanism for membrane lipid saturation than the yeast Ire1.
Figure 3. Mutations on the Juxtamembrane Amphipathic Helix Do Not Significantly Affect the Dimerization and Activity of IRE1α-ΔLD in the Cells.

(A) HeliQuest analysis of the amphipathic helix (IRE1α, 433–443 aa) (Gautier et al., 2008). Hydrophobic residues mutated to arginine (V437R and M440R) are shown in blue, and the tryptophan residue is shown in red.
(B) IRE1α−/− MEF cells co-expressing VN-IRE1α-ΔLD and VC-IRE1α-ΔLD or their V437R and M440R mutants were treated with 2% BSA or 0.4 mM PA for 2 h. Venus fluorescence was detected with confocal microscopy. Scale bars, 42 μm.
(C) Quantification of Venus fluorescence in the presence of BSA or PA. The CTCF values were calculated for each treatment and mutation, and the fold changes upon PA treatment were then normalized to the IRE1α-ΔLD-WT sample. Values are reported as mean ± SD (n = 2).
(D) Western blot analysis of the total IRE1α-ΔLD expression levels. GAPDH was used as a loading control.
(E) RT-PCR of Xbp1 mRNA from IRE1α−/− MEF cells co-transfected with VC-IRE1α-ΔLD-WT and VN-IRE1α-ΔLD-WT or their mutants, V437R and M440R. BSA and PA treatment conditions are the same as in (B).
(F) Quantification of splicing activity of IRE1α-ΔLD-WT, V437R, and M440R mutants in the presence of BSA or PA. Values are reported as mean ± SD (n = 3); **p < 0.001 (Student’s t test).
See also Figure S2.
To exclude the possibility that the N-terminal LD affects the dimerization conformation of the IRE1α-TMD, we used full-length IRE1α BiFC constructs, VN-IRE1α-FL and VC-IRE1α-FL (Figure 4A), and further monitored their dimerization in IRE1α−/− MEF cells. Palmitate induced the dimerization of full-length IRE1α, as evident by an increase in the reconstituted green fluorescence (Figure 4B). Consistent with the observation of the IRE1α-ΔLD (Figures 2C and 2H), both W457A and S450A mutations on the IRE1α-FL dramatically reduced the dimerization in the palmitate-treated cells (Figures 4B and 4C). Because the active IRE1α dimers further facilitate the formation of high-order oligomers that re-localize into discrete foci in vivo (Li et al., 2010), we further calculated the IRE1α foci-positive cells. In agreement with their dimerization capacity (Figures 4B and 4C), both the W457A and S450A mutants significantly reduced the IRE1α foci-positive cells (Figure 4D), while the total protein levels of the IRE1α mutants were unaltered (Figure 4E). In the BiFC experiments, the fluorescence results only upon the formation of the IRE1α dimer. Thus, the decreased number of foci-positive cells in both mutants is due mainly to their reduced dimerization ability. In addition, because the expression levels of IRE1α-FL variants in the IRE1α−/− MEF cells are similar to the endogenous IRE1α level in the MEF-WT cells (Figures S1A, S1B, and 4E), the dimerization and/or oligomerization defect in the W457A and S450A mutants is unlikely due to non-physiologically high concentrations of the IRE1α-FL variants. These full-length IRE1α proteins co-localized with the ER membrane protein calnexin, with similar Pearson’s correlation coefficients (Figures S3A and S3B). Consistent with this, both the IRE1α-FL-W457A and IRE1α-FL-S450A mutants in the palmitate-treated cells showed significantly reduced XBP1S fractions (Figures 4F and 4G). Furthermore, tryptophan and serine residues in IRE1α-TMD are highly conserved in mammals (Figure S3C). Therefore, these results suggest that both Trp457 and Ser450 play a crucial role in not only the initial dimerization process but also the IRE1α oligomer formation that could activate XBP1 splicing.
Figure 4. The Structural Elements in the IRE1α-TMD Sense Lipid Aberrancy and Activate the IRE1α-XBP1 Pathway.

(A) Scheme of IRE1α full-length (FL) constructs used in the BiFC assay. The Myc-tagged Venus N terminus fragment and HA-tagged Venus C terminus fragment were inserted between SP and LD.
(B) IRE1α−/− MEF cells co-expressing VN-IRE1α-WT-FL and VC-IRE1α-WT-FL, or their W457A and S450A mutants, were treated with 2% BSA or 0.4 mM PA for 2 h. Venus fluorescence was detected with confocal microscopy. Scale bars, 42 μm.
(C) Quantification of Venus fluorescence in (B). The CTCF values were calculated for each treatment and mutation. The fluorescence fold change upon PA treatment was normalized to WT. Values are reported as mean ± SD (n = 3); **p < 0.001 (Student’s t test).
(D) Western blot of the WT and mutant samples with indicated antibodies. Total protein extracts were obtained from BSA- and PA-treated cells in (B).
(E) Quantification of the IRE1α foci-positive cells in (B). Percentage of cells that contain at least one IRE1α foci was calculated as described in STAR Methods. Values are reported as mean ± SD (n = 3); *p < 0.05 (Student’s t test).
(F) RT-PCR of Xbp1 mRNA from IRE1α−/− MEF cells co-transfected with VC-IRE1α-FL-WT and VN-IRE1α-FL-WT or their mutants W457A and S450A. Cells were treated with 0.4 mM PA for 0, 0.5, 1, or 2 h. The unspliced (U) and spliced (S) products and heteroduplex species (HD) are indicated.
(G) Quantification of splicing activity of IRE1α-FL-WT, W457A, and S450A mutants in (E). Values are reported as mean ± SD (n = 2); **p < 0.001 (Student’s t test).
(H) RT-PCR of Xbp1 mRNA from IRE1α−/− MEF cells transfected with pcDNA-hIRE1α-FL-Y161A, pcDNA-hIRE1α-FL-Y161A-W457A, and pcDNA-hIRE1α-FLY161A-S450A. Cells were treated with BSA or 0.4 mM PA for 2 h.
(I) Quantification of splicing activity of IRE1α-FL-Y161A, IRE1α-FL-Y161A-W457A, and IRE1α-FL-Y161A-S450A. Values are mean ± SD, with n = 2; **p < 0.001 (Student’s t test). Error bars may not be visible because of low values.
See Figures S1 and S3.
To further test whether the reduction of XBP1 splicing efficiencies on the W457A and S450A mutants resulted from lipid perturbation, but not accumulation of unfolded proteins upon palmitate treatment, we used an established Y161A mutation that is defective in sensing unfolded proteins (Kono et al., 2017). Similar to the results with the IRE1α-ΔLD (Figures 2F and 2G), the XBP1 splicing activities of both IRE1α-FL-Y161AW457A and IRE1α-FL-Y161A-S450A were significantly lower than IRE1α-FL-Y161A (Figures 4H and 4I). Collectively, our in vivo results suggest that the intrinsic structural elements of the IRE1α-TMD could be a key factor in sensing membrane lipid saturation in mammals.
MD Simulations Identified a Key Role of Trp457 in a Potential Dimerization Process of the IRE1α-TMD
To further investigate the potential roles of both Trp457 and Ser450 on the dimerization process of IRE1α-TMD, we performed atomistic MD simulations, in which two IRE1α-TMD peptides were inserted in an explicit POPC lipid bilayer. Because of the lack of structural information on the IRE1α-TMD, three different initial conformations of IRE1α-TMD were arbitrarily assigned (models A, B, and C) (Figure S4A). We estimated the dimerization tendency of the TMD peptides in the POPC bilayer on the basis of both the distance between the center of mass (CM) of the peptides and the inter-peptide interactions. In model A, the CM distance initially decreased from 11.8Å (Figure S4B, X mark) to 9.9 ± 0.4 Å and then returned to the initial value (Figure S4B). In model B, the CM distance decreased from 11.8 to 10.3 ± 0.3 Å, while in model C, the CM distance increased to 14.0 Å (Figure S4B). Consistent with this, the total number of atomic contacts within 6 Å between the two peptides in model C was significantly lower than both models A and B (Figure S4C).
To analyze the nature of the inter-peptide interactions, we calculated the average conformation of the three models over the last 50 ns of the simulation. From the analysis, we found that both models A and B have common conformational features in the IRE1α-TMD peptides. First, the TMD peptides had a slightly tilted conformation in the POPC bilayer, with tilt angles of 8.9°± 1.5°and 5.0°± 2.0° in models A and B, respectively (Figure S4D). In contrast, to escape from the hydrophobic acyl chains of the POPC to the more polar head groups, the hydrophilic TMD residues in model C rearranged drastically, thereby leading to a deformed and tilted conformation in the membrane (Figure S4D) (Killian, 1998). Second, Trp457 was observed in the dimerization interface of the TMD peptides. In the simulation with model A, Trp457 in TMD1 and Trp457 and Phe460 in TMD2 were clustered at the interface of the TMD peptides (Figure S5A). In this interface, Trp457 in TMD1 and Phe460 in TMD2 formed the T-shaped aromatic interaction, which is slightly greater (~6 Å) than an ideal T-shaped stacking value (~5 Å) (Janowski and Pulay, 2007) (Figure S5B). In the initial structure of model B, the two Trp457 residues were located on the opposite sides of the TMD peptides (CM distance = 14 Å; Figure 5A, green). However, they rapidly changed orientations to relocate to the center of the TMD peptide interface, forming a stable aromatic interaction (CM distance = 4–5Å; Figure 5A, orange) (also see Video S1). Similar to model A (Figure S5A), the position of Trp457 at the interface was transiently stabilized by the aromatic interactions with the Phe460 residue during the simulation (Figure 5B). Given that F460A did not exhibit any significant defect in the dimerization of IRE1α-ΔLD in vivo (Figure 2H), the observed Phe460-Trp457 interactions in models A and B could be intermediate states that are not essential for the IRE1α-TMD dimerization. After the first 150 ns of simulation of model B, the distance between the benzene and indole centroids decreased (Figure 5C, left), creating an aromatic pocket with an ideal aromatic sandwich stacking configuration of the tryptophan residues (Figure 5C, right). Furthermore, the ring orientations of Trp457 allowed the formation of H-bonds between the NH of the indole groups and the carbonyl oxygen of Trp457, Leu454, and Leu453 (Figures S6A and S6B). In addition to Trp457, Ser450, located near the N terminus of the TMD, transiently formed H-bonds with Ser450 and Thr446 on the other peptide (Figures S6C and S6D). Interestingly, inspection of the average conformation of model C revealed that the Trp457 was not located at the interface, suggesting that the lack of the Trp457 at the peptide interface could destabilize the dimer of IRE1α-TMD, inducing a dramatically tilted conformation in the POPC bilayer (Figure S4D). Together with the in vivo experimental results (Figures 2 and 4), the MD simulation results from both models A and B suggest that Trp457 could play a key role in the IRE1α-TMD dimerization process.
Figure 5. Trp457 Residues Form an Aromatic Stacking Interaction in the Center of the TMD Dimerization Interface.

(A) Left: Distance between the center of mass (CM) of the two indole rings of Trp457 in model B. Right: representative structures at various time points. The colored indole rings correspond to the same colored arrows on the left.
(B) Left: Distance between the CM of Trp457 and Phe460 for each TMD peptide. Right: A representative structure of the aromatic pocket in the last 50 ns of the simulation is shown.
(C) Left: Distance between two hydrogen atoms of the indole rings used to evaluate the alignment of the Trp457 in the simulation. Two hydrogen atoms at positions 2 and 6 in the indole ring represent H1 (black) and H2 (red), respectively. Right: Average structure obtained from the last 50 ns of the simulation time. H1 and H2 are highlighted in black and red, respectively. Nitrogen atom is colored in blue, and other hydrogen atoms not considered for this analysis are colored in white.
(D) Residue contact numbers were calculated as the number of times each residue comes within 6 Å of the dimerization interface during the last 50 ns of the simulation. The contact numbers were further normalized to the contact number of the Trp457 residue. Dimerization deficiency was calculated as (1 − fluorescence) from the data in Figure 2H. Residues identified from both the MD simulations and alanine-scanning experiments, residues identified only from the MD simulations, and residues identified only from the alanine-scanning experiments are shown in red, blue, and green, respectively.
(E) Location of residues identified from the MD simulations or alanine-scanning experiments are highlighted on the IRE1α-TMD dimer structure obtained from model B. Colors are shown as in (D).
(F) Density profile in z dimension of the Trp457 (red) and POPC head group (black) as a function of distance from the center of the membrane. The density distributions were collected from 10,000 snapshots during the last 50 ns of the simulations. The root-mean-square distance of Trp457 from the center of the bilayer was calculated over the last 50 ns of the simulation.
(G) Closer view of the density profile of (F).
(H) Nitroxide lipid quenching of IRE1α-TMD peptide in small unilamellar vesicles (SUVs). The SUVs containing TMD peptide, POPC, and spin-labeled shallow quencher (5-doxyl PC) or deep quencher (16-doxyl PC) were prepared as described in STAR Methods. The tryptophan fluorescence was excited at 280 nm, and the emission spectra were obtained by scanning from 295 to 450 nm.
See also Figures S4–S6, Video S1, and Table S1.
To provide broad insight on the alanine mutagenesis results (Figure 2H), we further calculated the atomic contact number (cutoff = 6 Å) for each residue in model B. The analysis revealed that Trp457 was the most frequently localized residue to the dimerization interface during the last 50 ns of simulation time (normalized to 1 in Figure 5D), and residues including Thr446, Ser450, Leu453, and Leu454 had about 30%–40% of the contact numbers of Trp457 (Figure 5D). This is consistent with the in vivo data showing that W457A, S450A, and T446A have defects in the dimerization of IRE1α-ΔLD (Figure 5D, red). By contrast, the alanine mutation of both Leu453 and Leu454 did not alter the dimerization efficiency of IRE1α-ΔLD (Figure 5D, blue). In addition, both the I447A and I461A mutants exhibited less than 50% of the WT dimerization efficiency (Figure 5D, green). It is notable that all the defective residues identified from the BiFC assay (Figure 2H) are localized in the dimerization interface obtained from model B (Figure 5E). Therefore, we speculate that model B could represent the initial dimerization stages of the IRE1α-TMD.
Trp457 Locates Near the Center of the POPC Bilayer
Tryptophan is found abundantly in membrane proteins. Because of its amphipathic nature, tryptophan is known to stabilize the membrane proteins by anchoring the interactions in the membrane-water interface (Yau et al., 1998). However, tryptophan often locates toward the center of the TMD helix to support the aromatic interaction, which mediates the TMD dimerization (Haeger et al., 2010; Ridder et al., 2005; Sal-Man et al., 2007). Our bioinformatics analysis revealed that about 30% of the single-spanning transmembrane proteins (a total of 2,365 human proteins) contain tryptophan residues. One-fifth of these proteins have tryptophan near the center of the lipid bilayer (cutoff = ±30% from the center amino acid residue in the TM domain) (Table S1). Using the MD simulation results, we further analyzed both the density profile of the Trp457 and POPC head group as a function of the distance from the bilayer center along the direction normal to the bilayer plane (Figure 5F). The preferred location of Trp457 is close to the center of the lipid bilayer (i.e., the hydrophobic core region of the POPC bilayer; Figures 5F and 5G). The calculated root-mean-square distance of Trp457 from the center of the bilayer is 0.76 ± 0.12 Å, corroborating a density profile that locates the tryptophan residues in proximity of the center of the POPC lipid bilayer.
To experimentally determine the location of Trp457 in the POPC lipid bilayer, we used the parallax method that estimates the membrane penetration depth of the tryptophan residue (Chattopadhyay and London, 1987). The parallax method allows the determination of the apparent location of tryptophan by comparing the quenching of the tryptophan fluorescence by two different spin-labeled POPC lipids, 5-doxyl PC (shallower quencher), and 16-doxyl PC (deeper quencher). Compared with the fluorescence intensity in the absence of the quenchers (Figure 5H, black), Trp457 was quenched dramatically by the deeply located nitroxide lipid quencher (F/F0 = 0.099) (Figure 5H, red), but much less efficiently by the shallow quencher (F/F0 = 0.71) (Figure 5H, blue). We further calculated the distance of Trp457 from the center of the bilayer (Zcf), as described in STAR Methods. The average depth of penetration of Trp457 from the center of the bilayer was estimated at 0.88 ± 0.35 Å, consistent with the computationally calculated value of 0.76 ± 0.12 Å, Therefore, both the computational and experimental results indicate that the tryptophan residue locates near the center of the bilayer.
Intrinsic Structural Features of Trp457 Are Important for the Dimerization Process of IRE1α-TMD
Of the aromatic residues, the side chain of tryptophan is unique with its amphipathic nature, enabling it to participate in both aromatic interactions and hydrogen bonding (NH-π and CH-π) (Samanta et al., 1999). This multi-functional side chain makes the tryptophan residue a key contributor to both the process of protein folding and stabilization of the folded protein structures. To address whether the tryptophan residue is a unique feature in the 457 position for the IRE1α-TMD dimerization, Trp457 was mutated to either alanine or phenylalanine. W457F preserves the aromatic ring but removes both the H-bond donor and dipole moment properties of the tryptophan, whereas W457A removes both the aromatic interactions and hydrogen bonds. Both W457A and W457F mutants significantly reduced the dimerization ability of IRE1α-TMD in the cellular membrane (Figure 6A). Therefore, the experimental results suggest that the aromatic characteristic alone is insufficient to promote self-association, and the H-bond or the dipole moment on the tryptophan residue could be important in regulating the TMD dimerization of the IRE1α protein.
Figure 6. Intrinsic Structural Features of Trp457 Are Important for the Dimerization Process of IRE1α-TMD, and Ser450 Stabilizes the Trp457-Trp457 Interaction.

(A) TOXCAT assays of IRE1α-TMD-WT and its W457A and W457F mutants. Top: CAT activities from cells expressing ToxR-TMD-MBP were quantified and normalized to the WT. Bottom: the protein expression levels for each sample were also normalized to the ToxR-TMD-MBP protein. Values are mean ± SD (n = 6); **p < 0.001 (Student’s t test).
(B) Initial (0 ns) and final (200 ns) conformation of the W457A mutant. The mutated alanine residues are colored in red.
(C) Initial and final conformations of the W457F mutant. The mutated phenylalanine residues are colored in red.
(D) Distance between the CM of the TMD peptides. The black, orange, and blue lines correspond to the WT, W457A, and W457F mutants, respectively.
(E) Left: distance between W457F residues as measured from the CM of the two benzene rings. Right: representative structures at various time points. The colors of the phenylalanine residues match the color of the arrows on the left.
(F) Initial and final conformations of the S450A mutant. Both mutated serine residues and Trp457 residues are colored in red and magenta, respectively.
(G) Distance between the CM of WT (black) and S450A (red) peptides.
(H) Distance between the indole rings of Trp457 residues in WT (black) and S450A (red) peptides.
See also Figure S7.
To elucidate the potential role of tryptophan on the TMD dimerization process, we performed further MD simulations of the W457 mutants (W457A and W457F) (Figures 6B and 6C) starting from the initial conformation of model B. The CM distances of W457A and W457F were not significantly different from the WT (Figure 6D). In the W457F model, in contrast to the WT (Figure 5A), the benzene ring only formed a T-shaped aromatic interaction during the first half of the simulation (CM distance = 6 Å; Figure 6E, blue), and then they moved apart, breaking the aromatic interaction in the last 100 ns (CM distance = 7.3 Å; Figure 6E, red and orange). Therefore, both the computational and experimental results suggest that the predominant effect of the W/F substitution results from the removal of the electrostatic interactions between the indole dipole and the polar groups, supporting that the aromatic characteristic alone is insufficient to drive the TMD dimerization.
To further understand the potential mechanisms by which Ser450 regulates the dimerization of IRE1α-TMD, we performed MD simulations with the S450A peptides (Figure 6F). Serine substitution to alanine only changes the side chain of CH2OH to CH3, thus eliminating the capability of H-bonds. The CM distance between the S450A peptides increased significantly compared with WT (Figure 6G). As observed in the WT (Figure 5A), the CM distance between the indole rings on Trp457 also rapidly decreased (14–7.5 Å) in S450A. Because of the loss of H-bonds, this distance increased back to 9.5 Å and remained constant over the simulation time, except for a short period around 100 ns (Figure 6H). Therefore, the MD simulation results suggest that the primary effect of S450A could be a loss of the Trp457-Trp457 interactions. If this hypothesis is correct, we would not observe any synergetic effect in the S450A-W457A double-mutant cells. Consistent with this notion, the dimerization efficiency of IRE1α in the S450A-W457A cells is approximately 20% of the WT and thus is not significantly different from the single mutant (S450A or W457A) cells (Figures S7A and S7B versus 4B and 4C). Taken together, the H-bonds formed by Ser450 could contribute to the stability of the Trp457-Trp457 interaction during the IRE1α-TMD dimerization process.
DISCUSSION
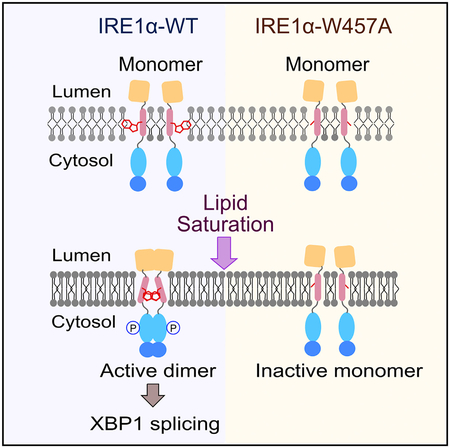
Here we propose a mechanistic model of human IRE1α activation by membrane lipid saturation. Under normal conditions, four functional domains (LD, TMD, KD, and RD) of the IRE1α present in an inactive monomer conformation (Figure 7). In particular, the Trp457 residue could remain on the opposite side of the dimerization interface (Figure 7, back to back). Given that palmitate alters the physical properties of the membrane (e.g., fluidity and lipid packing; Covino et al., 2016; Leekumjorn et al., 2008), the tryptophan residues rapidly rotate and support the core dimerization interface of the IRE1α-TMD (Figure 7, face to face). In addition, the Ser450 residue assists the dimerization stability, potentially because of its capacity for H-bonds. The dimerization of the IRE1α-TMD further brings the cytosolic domains together, which could induce the face-to-face conformation of KD by a currently unknown mechanism, leading subsequently to an active, phosphorylated conformation (Figure 7) (Ali et al., 2011; Li et al., 2010). The activated IRE1α enables the cleavage of the Xbp1 mRNA for downstream transcriptional regulation of UPR genes. Therefore, our results showed that the TMD of IRE1α serves as an active signaling modulator of membrane lipid saturation.
Figure 7. The Proposed Model of IRE1α Activation by Membrane Lipid Saturation.

Under normal conditions, IRE1α presents as an inactive monomer. Upon palmitate treatment, the center-localized tryptophan residues (red) rapidly initiate the TMD dimerization process and support the core interactions for the IRE1α-TMD. The serine residue (green) assists in the stability of the TMD dimer during this process. The dimerization of IRE1α-TMD further induces dimerization of LD, KD, and RD, subsequently resulting in an active conformation.
Several previous studies suggest that tryptophan supports self-association of the helical TMD segments (Haeger et al., 2010; Ridder et al., 2005; Sal-Man et al., 2007). Our study further demonstrates that the conserved tryptophan (Figure S3C) is an essential amino acid residue for the dimerization process. In addition, the chloride intracellular channel protein 1 (CLIC1), one of the positive hits in our tryptophan location analysis (Table S1), has been shown previously to stabilize the TM dimerization in the membrane by the cation (Lys37)-π interaction (Trp35) (Peter et al., 2014). The WxK motif is known to increase the strength of oligomerization of the TMD helices (Johnson et al., 2007), and it is conserved on the chloride intracellular channel protein family except for CLIC3 (Table S1). Remarkably, the tryptophan location analysis showed that another ER sensor protein, PERK, has two conserved tryptophan residues (Trp521 and Trp522) near the center of the TMD sequence (Table S1), suggesting that dimerization of the PERK TM domain might be mediated by the cation (Lys523)-π interaction (Trp521). Nevertheless, whether the tryptophan residues play a crucial role in activating the PERK protein remains to be tested.
An intriguing feature we observed in the MD simulations is a rotameric switch of the tryptophan residue of IRE1α-TMD (Figure 5A; Video S1). In model B, two Trp457 residues initially pointed in opposite directions, and then they rapidly flipped toward the center of the TM dimerization interface to maximize their interactions (Figure 5A; Video S1). The rotameric switch could optimize the IRE1α-TMD interface by providing the driving force for other H-bonds to form (Figures S6A and S6B). The tryptophan rotameric switch model is most commonly observed in G protein-coupled receptors (GPCRs). A highly conserved tryptophan residue (Trp6.48) in TMD6 was rotated toward another conserved phenylalanine residue (Phe5.47) in TMD5, and these two aromatic residues formed an edge-to-face aromatic interaction (Holst et al., 2010; Li et al., 2013; Lyman et al., 2009). This rotameric switch is known to be involved in the activation process of GPCRs (Holst et al., 2010; Li et al., 2013; Schwartz et al., 2006). Interestingly, a recent study showed that Trp1042 on the TM domain of the Mga2 protein senses the lipid saturation of the yeast ER membrane and subsequently triggers the TM helix rotation to induce an active Mga2 conformation for transcriptional upregulation of fatty acid desaturation (Covino et al., 2016). Consistent with this, our MD simulation and in vivo results suggest that the Trp457 rotameric switch of the IRE1α-TMD induced by palmitate triggers the active conformation of the cytosolic domain of the IRE1α protein to induce XBP1 mRNA splicing. Taken together, the rotameric switch could be important for activation of membrane proteins.
In addition to the tryptophan residue, the MD simulations predicted that the residues at the interface of the IRE1α-TM domain consisting of Ser450, Leu453, and Leu454 are involved in the H-bonds and hydrophobic interactions (Figures 5D, S6C, and S6D). Our BiFC experiments showed that S450A dramatically reduces the dimerization of the IRE1α (Figures 2 and 4). Interestingly, these residues are located as a leucine-zipper-like motif (SxxLxxx motif) (Figure S3C), which was also observed in the parallel TM dimerization of the mouse erythropoietin receptor (EpoR) protein (Ruan et al., 2004). In addition, both the tryptophan and SxxLxxx motif on IRE1α are highly conserved in mammals but not in yeast Ire1 (Figure S3C) (Kono et al., 2017). Because of the different ER membrane lipid composition between yeast and mammals (van Meer et al., 2008), the TMD sequences on the IRE1α protein of mammals could have evolved to be particularly sensitive to lipids in the ER membrane, while the yeast Ire1 relies on the juxtamembrane amphipathic helix sequences (Halbleib et al., 2017).
Why are the intrinsic structural features of the IRE1α-TMD required for sensing the membrane lipid perturbation? The results of a previous study showed that replacing the IRE1α-TMD sequence by its scrambled TMD sequence or calnexin TMD sequence did not completely abolish the XBP1 splicing activity of the IRE1α protein (Volmer et al., 2013). However, the XBP1 splicing efficiencies for those two constructs and the WT under the same treatment conditions were significantly different in the IRE1α-FL and IRE1α-ΔLD expressing cells (Volmer et al., 2013), suggesting that the IRE1α-TMD sequence cannot be fully replaced. Given that the UPR signaling pathways are dynamically modulated by palmitate (Cho et al., 2013), the intrinsic structural feature of the IRE1α-TMD could be crucial for fine-tuning the dynamic UPR signaling induced by membrane lipid saturation. The bulky tryptophan residue 457 could be accommodated in the loosely packed lipid bilayer, whereas in a more densely packed bilayer, the formation of Trp457-Trp457 aromatic stacking interaction would be energetically more favorable (Covino et al., 2016). On the basis of our MD simulation results, this rotation is expected to be very fast (~10 ns) (Figure 5A) and thus would allow rapid response to small lipid perturbations in the ER membrane. In contrast, because of lipid packing in the presence of palmitate, the TMD lacking the tryptophan residue could passively diffuse and eventually dimerize under prolonged palmitate exposure (Kono et al., 2017). Although this hypothesis remains to be tested, we propose that the tryptophan residue in the IRE1α-TMD enables a dynamic switch by rapid rotation upon membrane lipid saturation.
From the MD simulation results, we propose that the dimerization process of IRE1α-TMD uses a “dual-lock” strategy. In this scenario, the Trp457 is a core lock that buttresses the dimerization interface, and the Ser450 is a secondary lock that further secures the core interactions. The S450A mutant showed a partial rotation of Trp457 residues (Figures 6F and 6H), representing an intermediate state during the IRE1α-TMD dimerization process. This intermediate state would sense the perturbation of the lipid composition in the ER membrane, however, it is insufficient to drive a stable dimerization of the IRE1α-TMD and to transmit signals to the cytosolic domain of IRE1α in vivo (Figures 2 and 4). Further mechanistic study is needed to confirm that S450A is an isolated mutant that decouples lipid saturation sensing from the dimerization of IRE1α-TMD; nonetheless, we suggest that the full rotation of the Trp457 residues is required for an active conformation of IRE1α.
Whereas the conventional UPR initiates by BiP release from IRE1α-LD upon accumulation of unfolded proteins in the ER lumen and subsequent dimerization of IRE1α-LD, our data with IRE1α-ΔLD and IRE1α-Y161A (Figures 2 and 4) demonstrate that palmitate directly activates IRE1α through the dimerization of the TMD. This further suggests that, depending on the nature of the physiological stimuli, IRE1α could use different sensing mechanisms. Given that IRE1α dynamically assembles with numerous co-factors and regulators to activate its cytosolic domain that constitutes the UPRosome (Hetz and Glimcher, 2009), whether this non-canonical activation of IRE1α by lipid perturbation requires specific factors in the UPRosome is currently unknown. Interestingly, a recent study showed that Bax/Bak, one of the co-factors that binds to the cytosolic domain of IRE1α (Hetz et al., 2006), is required for palmitate-induced activation of ER stress (Zhang et al., 2019). Therefore, the mapping of the IRE1α UPRosome that is induced by lipid perturbation remains to be explored. This, together with our results, would provide further insight into how IRE1α could customize its sensing and regulatory domains for a specific stimulus.
STAR★METHODS
CONTACT FOR REAGENT AND RESOURCE SHARING
Further information and requests for resources and reagents should be directed to and will be fulfilled by the Lead Contact, Professor Christina Chan (krischan@egr.msu.edu).
EXPERIMENTAL MODEL AND SUBJECT DETAILS
Cell lines used
IRE1α−/− Mouse Embryonic Fibroblast (MEF) cells (embryos were of unknown sex at the time that the cells were obtained), were grown in DMEM containing 4500 mg/L glucose, L-glutamine, sodium pyruvate and sodium bicarbonate supplemented with 10% fetal bovine serum +10% FBS at 37°C in 5% CO2
Hep3B (8 year old male) grown in DMEM containing 4500 mg/L glucose, L-glutamine, sodium pyruvate and sodium bicarbonate supplemented with 10% fetal bovine serum +10% FBS at 37°C in 5% CO2
METHOD DETAILS
Cell culture and transfection
IRE1α−/− mouse embryonic fibroblast (MEF) cells were maintained at 37°C at 5% CO2 in Dulbecco’s Modified Eagle Medium (DMEM, Thermo cat# 11995065) containing 4500 mg/L glucose, L-glutamine, sodium pyruvate, and sodium bicarbonate supplemented with 10% fetal bovine serum. Cells were reverse-transfected with Lipofectamine® LTX reagent (Thermo Fisher Scientific) for 24 h. Afterward, the media was removed and replaced with complete media containing only 2% bovine serum albumin (BSA) or 0.4 mM palmi-tate (PA) in 2% BSA media.
Cloning of VC-IRE1α and VN-IRE1α plasmids
pBiFC-VC155 and pBiFC-VN155 (I152L) were a gift from Chang-Deng Hu (Addgene plasmid # 22011 and #27097) (Shyu et al., 2006). pcDNA-hIRE1a (a gift originally from Randal J. Kaufman (University of Michigan, MI, USA)) was used to amplify the IRE1α gene. An IRE1α signal peptide sequence (1–18 aa) was added at the N-terminal of the coding sequence upstream of the HA- and Myc-tagged VC and VN fragments. The coding sequences of the truncated luminal domain (19–29aa, 408–443aa) followed by the transmembrane and cytosolic domains (444–977 aa) were inserted at the C terminus of the VC and VN fragments (see Figure 2A). For the IRE1α-full length BiFC constructs, the HA- and Myc-tagged VC and VN fragments were inserted between the signal peptide sequence and the C terminus coding sequences of IRE1α (18–977aa). Primers for the alanine point mutations of IRE1α-TMD and the V437R, M440R, Y161A mutations were designed and performed according to guidelines from the QuikChange Lightning Site-Directed Mutagenesis kit (Agilent). The sequences of the mutations were confirmed by DNA sequencing services (Eurofins Genomics).
Immunofluorescence
Hep3B Cells were reverse-transfected with pBiFC-VC155-IRE1α-ΔLD and pBiFC-VN155-IRE1α-ΔLD or pBiFC-VC155-IRE1α-FL and pBiFC-VN155-IRE1α-FL plasmids using Lipofectamine LTX for 24 h and then fixed, permeabilized, and co-stained with an anti-calnexin antibody (Santa Cruz Biotech, cat# sc-23954), an anti-HA antibody (Abcam, cat# ab9110), or an anti-Myc antibody (Abcam, cat# ab9106). Appropriate secondary antibodies conjugated with Alexa 488 (Abcam, cat# 150077) or Alexa 568 (Abcam cat# 175701) were further incubated. Representative images for cells expressing Myc-VN-IRE1α-ΔLD protein are shown although the cells expressing HA-VC- IRE1α-ΔLD protein had the same colocalization pattern.
Bimolecular fluorescence complementation (BiFC) assay
μ-plates (Ibidi) were used for confocal microscopy to detect Venus fluorescence. IRE1α−/− MEF cells were seeded at a density of 3 × 10⁶ cells/mL in each well and co-transfected with VN155-IRE1α-ΔLD and VC155-IRE1α-ΔLD (WT or V437R/M440R/W457A/S450A) plasmids. Cells were transfected as described above and then treated with BSA or PA media for 2 h. The Olympus FluoView FV1000 imaging system, with an UPLFLN 20X NA 0.5 objective and a PLAPON 60X O NA 1.42 objective, was used to observe the formation of the Venus fluorophore at λex = 515nm and λem = 535nm. The BiFC assay for IRE1α-FL was performed for the same conditions as IRE1α-ΔLD constructs using the VN155-IRE1α-FL and VC155-IRE1α-FL (WT or W457A/S450A/W457A-S450A) plasmids. The corrected total cell fluorescence (CTCF) was calculated for each cell (McCloy et al., 2014) using the following equation: CTCF = [Integrated Density – (Area of selected cell × mean fluorescence of background readings)]. The number of cells that contain at least one foci was analyzed using ImageJ (Fiji) software with the following parameter settings, threshold 15–255, circularity 0–1, and size (pixel2) 100–10000.
XBP1 splicing assay
IRE1α−/− MEF cells were reverse-transfected with the plasmids as described above. Total mRNA was collected and the one-step RTPCR kit (QIAGEN) was used to amplify XBP1 cDNA. PCR primers were designed to flank the 26-bp splicing sequence of XBP1. PCR reaction was performed using the following primers: mXBP1-f 5′–GAACCAGGAGTTAAGAACACG–3′ and mXBP1-r 5′–AGGCAACAGTGTCAGAGTCC–3′. The PCR products were run on a 2.5% agarose gel made in 0.5X TBE. Gels were visualized and quantified using Molecular Imager ChemiDoc XRS System (Bio Rad). The splicing efficiency of XBP1 (% XBP1) was calculated with the following equation: XBP1 splicing (%) = [Intensity (XBP1S) + 0.5*Intensity (XBP1HD)] / [Intensity (XBP1S) + Intensity (XBP1HD) + Intensity (XBP1U)]*100
Förster resonance energy transfer (FRET) measurements
The lysine residues on the N and C-termini (K-444KDMATIILSTFLLIGWVAFIITYPLS467-KK) were added to enhance the solubility and stability in the lipid bilayer. Unlabeled TM peptide and N-terminal labeled-TMD peptides with FITC (Fluorescein isothiocyanate) or Carboxytetramethylrhodamine (TAMRA) were synthesized from Peptide 2.0 Inc. Peptides dissolved in TFE (Trifluoroethanol) and POPC (1-palmitoyl 2-oleoyl phosphatidylcholine) suspended in chloroform were mixed and then the organic solvents were removed using a nitrogen gas stream. The peptide/lipid mixture was reconstituted in 10 mM phosphate buffer (pH 7.0) containing 500 mM NaCl, freeze-thawed three times, and equilibrated at RT for 1 h before the fluorescence measurement.
FRET experiments were performed with FluoroMax-4 (Horiba), as previously described (Cho et al., 2012). For FITC and TAMRA as a donor/acceptor pair, the excitation wavelength was set at 439 nm and emission spectra were collected from 480 to 650 nm. FRET efficiency was calculated from measurements of donor fluorescence intensity at 515 nm in the absence and presence of the acceptor: FRET efficiency = (ID − IDA)/(ID), where ID and IDA are the donor fluorescence intensities of the samples containing only donor-labeled peptides and the samples with both donor- and acceptor-labeled peptides, respectively. The contribution to the emission at 515 nm from the direct excitation of the acceptor was removed by subtracting the spectra of the samples containing only acceptor-labeled peptides. In addition, the background signal from the lipid was eliminated by subtracting the spectra of lipo-some samples without peptides.
SDS-PAGE for IRE1α-TMD peptide
The IRE1α-TMD at the final concentration 2 μM was incubated in 1X lithium dodecyl sulfate (LDS) buffer (final concentration = 2% LDS) (ThermoFisher Scientific Inc., cat# NP0007) for 20 min at room temperature. 5 μL of sample was loaded onto 9% Bis-Tris gel and ran in MES buffer. Spectra Multicolor Low Range Protein Ladder (Thermo Fisher Scientific Inc., cat# 26628) was used as a molecular weight marker. The IRE1α-TMD peptides were visualized with Silver staining.
Tryptophan fluorescence measurements and tryptophan depth calculation
For nitroxide lipid quenching experiments, the small unilamellar vesicles (SUVs) were prepared by a modified method from a previous study (Maiorano and Davidson, 2000). The spin labels used, 5 doxyl PC (1-palmitoyl-2-stearoyl-(5-doxyl)-sn-glycero-3-phosphocho-line) and 16 doxyl PC (1-palmitoyl-2-stearoyl-(16-doxyl)-sn-glycero-3-phosphocholine) were obtained from Avanti Lipids. The molar ratio of POPC: doxylPC: peptide was 68:12:1 for all the assays. The lipid and peptide mixture in chloroform was dried under nitrogen, vacuum dessicated for 8 h to remove all traces of chloroform. 10 mL ethanol was further added to the lipid-peptide film. The sample was then vortexed and incubated on ice for 10 min. After diluting the sample with 1 mL of 10 μM Tris-HCl buffer (pH 7.0), bath sonication was performed for 1 h. The spectra were recorded at room temperature on a Fluoromax-4 at λex = 280nm. Emission spectra were collected from 295nm to 450nm. The fluorescence from POPC SUVs was subtracted from the samples containing spin label and peptide.
The distance of the Trp from the center of the bilayer (Zcf) is calculated with the following equation (Ren et al., 1997):
where F0 is the fluorescence intensity in the absence of quencher, Fs is the fluorescence intensity in the presence of the shallow quencher (5-doxyl PC), Fd is the fluorescence intensity in the presence of the deep quencher (16-doxyl PC), Lcd is the distance from the center of the bilayer to the deep quencher (2.25 Å), and Lds is the distance between the shallow (12.15 Å), and deep quenchers.
TOXCAT chimera constructions and assay
The TOXCAT vectors, pccKAN (TM deficient negative control), pccGpA-WT (positive control), and pccGpA-G83I (negative control), along with NT326 (malE deficient) E.coli strain, were kindly provided by Dr. Donald M. Engelman (Yale University, CT, USA) (Russ and Engelman, 1999). DNA fragment coding for the IRE1α-TMD residues (444–466 aa) was amplified from the plasmid pcDNA-hIRE1a and then inserted in-frame into the NheI and BamHI sites of pccKAN to generate the ToxR-IRE1α-TMD-MBP (maltose binding protein) fusion protein. Individual mutants of IRE1α-TMD were created through mutation of the pcc-IRE1α-WT plasmid using the QuikChange Lightning site-directed mutagenesis kit (Agilent). The TOXCAT chimeras were transformed into NT326 cells and grown at 37°C until A600 was 0.6. The harvested cells were lysed using the xTractor cell lysis buffer (Clontech) containing 0.2 mg/mL lysozyme. The CAT concentration was quantified with the CAT enzyme-linked immunosorbent assay kit (Roche Applied Science) according to the product manual. Chimera protein expression was quantified with western blotting using anti-MBP antibody (New England Biolabs, cat# E8032) and used to normalize the CAT activity of the various constructs.
MalE complementation assay
To confirm correct membrane insertion, NT326 cells expressing the TOXCAT chimeras were grown overnight in LB media. The cells were inoculated in M9 minimal media and cultured for 8 h. The cells were streaked onto M9 minimal media agar plates containing 0.4% maltose as the only carbon source and incubated for 3 days at 37°C. The images of the agar plates were collected using the Molecular Imager ChemiDoc XRS System (Bio Rad).
Molecular dynamics (MD) protocol
MD simulations of the TM peptides in lipid bilayer were performed with the GROningen MAchine for Chemical Simulations (GROMACS) v4.5.4 package (Hess et al., 2008), using the gromos53a6 force field, extended to improve the simulation of the lipid components consistent with our previous work (Leekumjorn and Sum, 2007; Leekumjorn et al., 2008; Marrink et al., 1998; Sirk et al., 2008). The lipid bilayer consisted of 288 1-palmitoyl 2-oleoyl phosphatidylcholine (POPC) lipids and 11500 water molecules (SPC model) in the liquid–crystalline state (gel-to-liquid crystalline phase transition at 270 K (Litman et al., 1991)). This model was chosen since it gives an approximate representation of the phospholipid constituents in the ER (Buchan et al., 2010).
The topology file for the POPC molecule was consistent with the previous topology described in (Leekumjorn and Sum, 2007; Leekumjorn et al., 2008; Marrink et al., 1998; Sirk et al., 2008). An initial 100 ns MD simulation of a pure POPC bilayer was performed to equilibrate the membrane. The TM helix sequence and all mutants were built with the PyMol software (De Lano, 2002), assigning an α-helical conformation as predicted by PSIPRED: Protein Structure Prediction Server (http://bioinf.cs.ucl.ac.uk/psipred_new/) (Buchan et al., 2013). We built three different dimer models of the TM peptides (models A, B, C). Starting from a dimer conformation (model A), the other two potential dimers were gained by systematically rotating each TM peptide 90° in model A around its backbone (z axis) clockwise or counter-clockwise (Zhang et al., 2012). All the TM chains in the three dimer models have the same initial conformation and the only difference for the three dimers is the helix-helix interface.
The TM segments were then inserted in the pre-equilibrated POPC bilayer at 1.2 nm from each other. The insertion required the removal of two lipid molecules per leaflet. Chloride ions were added to neutralize the charges in the simulation box. To relax the bond geometries, the potential energy of the system (lipid bilayer, peptides, water and ions) was minimized by using the steepest-descent method until convergence was reached. The solvent was then relaxed by 1 ns of MD at 300K, restraining the peptides’ atomic positions with a harmonic potential of 1000 kJ mol−1 nm−2 and then for another 1 ns decreasing the harmonic potential to 500 kJ mol−1 nm−2. The production simulations were performed at 300 K and 1 bar in an isothermal-isobaric ensemble (NPT), using the Berendsen thermostat and barostat. Lipids, water, peptide, and counterions were separately coupled to the temperature bath by weak coupling with a coupling constant of 0.1 ps. The pressure was also weakly coupled (with a coupling constant of 1.0 ps and compressibility of 4.5 × 10⁻⁵ using a semi-isotropic scheme in which only the pressure in the x and y were coupled together, but the normal pressure (in the z-direction) was not, as recommended for membrane protein simulations.
A simulation time step of 2 fs was used with all bond lengths constrained via the LINCS algorithm. Long-range electrostatic interactions were calculated with the Particle-Mesh Ewald (PME) method. Short-range interactions were cut-off at 1 nm. The production run consisted of 200 ns, and only the last 50 ns were used for the calculation of the average structure. The configurations in these production runs were stored every 2500 steps (5 ps), ensuring negligible statistical correlation between successively stored configurations. The trajectories were analyzed using GROMACS (Van Der Spoel et al., 2005) and Visual Molecular Dynamics (VMD) (Humphrey et al., 1996).
QUANTIFICATION AND STATISTICAL ANALYSIS
Statistical details of each experiment can be found in the figure legends. For both western blot and DNA gel images, Quantity One 1-D Analysis Software (Bio-Rad) was used to quantify the intensities of bands. The value of n is specified for each figure in the legend as well as the p value when statistical test was performed. For FRET assays, the “n” value represents the experimental replicates. For TOXCAT assays and in vivo experiments, the “n” value represents biological replicates (different passages of cells). To compare two groups, statistical analyzes using Student’s t test along with normality test (Shapiro-Wilk) were conducted in SigmaPlot software.
Supplementary Material
KEY RESOURCES TABLE
| REAGENT or RESOURCE | SOURCE | IDENTIFIER |
|---|---|---|
| Antibodies | ||
| Anti-calnexin | Santa Cruz Biotech | Cat# sc-23954; RRID:AB_626783 |
| Anti-HA | Abcam | Cat# ab9110; RRID:AB_307019 |
| Anti-Myc | Abcam | Cat# ab9106; RRID:AB_307014 |
| Goat Anti-Rabbit IgG- Alexa Fluor® 488 | Abcam | Cat# 150077; RRID:AB_2630356 |
| Goat Anti-Mouse IgG- Alexa Fluor® 568 | Abcam | Cat# 175701 |
| Anti-IRE1α | Cell Signaling Tech | Cat# 3294S; RRID:AB_823545 |
| Anti-GAPDH | GeneTex | Cat# GTX100118; RRID:AB_1080976 |
| Anti-MBP | New England Biolabs | Cat# E8032; RRID:AB_1559730 |
| Bacterial and Virus Strains | ||
| E. coli Top10 | ThermoFisher | Cat# C404010 |
| NT326(malE deficient) E. coli | Donald M. Engelman Lab (Russ and Engelman, 1999) | N/A |
| Chemicals, Peptides, and Recombinant Proteins | ||
| 1-palmitoyl-2-stearoyl-(5-doxyl)-sn-glycero-3-phosphocholine | Avanti Lipids | Cat# 810601 |
| 1-palmitoyl-2-stearoyl-(16-doxyl)-sn-glycero-3-phosphocholine | Avanti Lipids | Cat# 810604 |
| 1-palmitoyl-2-oleoyl-glycero-3-phosphocholine | Avanti Lipids | Cat# 850457 |
| 444KDMATIILSTFLLIGWVAFIITYPLS467-KK | Peptide 2.0 | N/A |
| FITC-444KDMATIILSTFLLIGWVAFIITYPLS467-KK | Peptide 2.0 | N/A |
| TAMRA-444KDMATIILSTFLLIGWVAFIITYPLS467-KK | Peptide 2.0 | N/A |
| Experimental Models: Cell Lines | ||
| IRE1 α−/− MEF | David Ron lab (Volmer et al., 2013) | N/A |
| Hep3B | ATCC | ATCC® HB-8064 |
| Oligonucleotides | ||
| mXBP1-f (for XBP1 splicing assay) 5′-GAACCAG GAGTTAAGAACACG-3′ | Bronner et al., 2015 | N/A |
| mXBP1-r (for XBP1 splicing assay) 5′-AGGCAAC AGTGTCAGAGTCC-3′ | Bronner et al., 2015 | N/A |
| IRE1α-TM-f (IRE1α -TM amplification for pcc- IRE1 α-WT) 5′-GGGGAATCGAGCTAGCATGG CTACCATCAT CCTGA-3′ | This study (Eurofins Genomics) | N/A |
| IRE1α-TM-r (IRE1α -TM amplification for pcc- IRE1 α-WT) 5′-GGGTTGATCAGGATCCC AGGGGATAGGTG ATGATG-3′ | This study (Eurofins Genomics) | N/A |
| pcc-f (pccKAN vector amplification for pcc- IRE1 α-WT) 5′-ATAAATCGGCTCCAAACTTG GGGAATCGAG-3′ | This study (Eurofins Genomics) | N/A |
| pcc-r (pccKAN vector amplification for pcc- IRE1 α-WT) 5′-GTTTAAAGCTGGATTGGCTTG GGTTGATCA GGATC-3′ | This study (Eurofins Genomics) | N/A |
| Recombinant DNA | ||
| pBiFC-VC155 | Addgene | Plasmid# 22011 |
| pBiFC-VN155(I152L) | Addgene | Plasmid# 27097 |
| pcDNA-hIRE1α | Addgene | Plasmid# 21892 |
| pccKAN | Donald M. Engelman Lab (Russ and Engelman, 1999) | N/A |
| pccGpA-WT | Donald M. Engelman Lab (Russ and Engelman, 1999) | N/A |
| pccGpA-G83I | Donald M. Engelman Lab (Russ and Engelman, 1999) | N/A |
| pccIRE1α-WT | This study | N/A |
| pBiFC-VC155-IRE1α-FL | This study | N/A |
| pBiFC-VN155(I152L)-IRE1α-FL | This study | N/A |
| pBiFC-VC155-IRE1α-ΔLD | This study | N/A |
| pBiFC-VN155(I152L)-IRE1α-ΔLD | This study | N/A |
| Software and Algorithms | ||
| SigmaPlot | Systat Software Inc | https://systatsoftware.com/ |
| ImageJ | NIH (Schneider et al., 2012) |
https://imagej.net/Coloc_2 https://imagej.net/Fiji |
| Cluster Omega | EMBL-EBI (Sievers and Higgins, 2014) | https://www.ebi.ac.uk/Tools/msa/clustalo/ |
| GROningen MAchine for Chemical Simulations (GROMACS) | Science for Life Laboratory, Stockholm University and KTH, Stockholm, SE (Hess et al., 2008) | http://www.gromacs.org/ |
| Visual Molecular Dynamics (VM) | NIH Center for macromolecular modeling & Bioinformatics. University of Illinois at Urbana- Champaign (Humphrey et al., 1996) | https://www.ks.uiuc.edu/ |
| GRaphing, Advanced Computation and Exploration of data (Grace) | Grace development | http://plasma-gate.weizmann.ac.il/Grace/ |
| PSIPRED: Protein Structure Prediction Server | UCL Department of Computer Science: Bioinformatics Group (Buchan et al., 2013) | (http://bioinf.cs.ucl.ac.uk/psipred_new/) |
Highlights.
Palmitate induces dimerization of the IRE1α transmembrane domain (TMD)
The conserved tryptophan supports the core dimerization interface of the IRE1α-TMD
The TMD mutants W457A and S450A abolish the palmitate-induced activity of IRE1α
ACKNOWLEDGMENTS
We thank Dr. Heedeok Hong for valuable discussions on the parallax method. This study was supported in part by the National Science Foundation (CBET 1510895, CBET 1547518, and CBET 1802992) and the NIH (R01GM079688, R01GM089866, and R21CA176854).
Footnotes
SUPPLEMENTAL INFORMATION
Supplemental Information can be found online at https://doi.org/10.1016/j.celrep.2019.03.017.
DECLARATION OF INTERESTS
The authors declare no competing interests.
REFERENCES
- Ali MM, Bagratuni T, Davenport EL, Nowak PR, Silva-Santisteban MC, Hardcastle A, McAndrews C, Rowlands MG, Morgan GJ, Aherne W, et al. (2011). Structure of the Ire1 autophosphorylation complex and implications for the unfolded protein response. EMBO J. 30, 894–905. [DOI] [PMC free article] [PubMed] [Google Scholar]
- Bronner DN, Abuaita BH, Chen X, Fitzgerald KA, Nuñez G, He Y, Yin XM, and O’Riordan MX (2015). Endoplasmic reticulum stress activates the inflammasome via NLRP3- and caspase-2-driven mitochondrial damage. Immunity 43, 451–462. [DOI] [PMC free article] [PubMed] [Google Scholar]
- Buchan DW, Ward SM, Lobley AE, Nugent TC, Bryson K, and Jones DT (2010). Protein annotation and modelling servers at University College London. Nucleic Acids Res. 38, W563–W568. [DOI] [PMC free article] [PubMed] [Google Scholar]
- Buchan DW, Minneci F, Nugent TC, Bryson K, and Jones DT (2013). Scalable web services for the PSIPRED Protein Analysis Workbench. Nucleic Acids Res. 41, W349–W357. [DOI] [PMC free article] [PubMed] [Google Scholar]
- Chattopadhyay A, and London E (1987). Parallax method for direct measurement of membrane penetration depth utilizing fluorescence quenching by spin-labeled phospholipids. Biochemistry 26, 39–45. [DOI] [PubMed] [Google Scholar]
- Cho H, Lamarca R, and Chan C (2012). Oligomerization of the transmembrane domain of IRE1α in SDS micelles. Biochem. Biophys. Res. Commun 427, 764–767. [DOI] [PMC free article] [PubMed] [Google Scholar]
- Cho H, Wu M, Zhang L, Thompson R, Nath A, and Chan C (2013). Signaling dynamics of palmitate-induced ER stress responses mediated by ATF4 in HepG2 cells. BMC Syst. Biol 7, 9. [DOI] [PMC free article] [PubMed] [Google Scholar]
- Covino R, Ballweg S, Stordeur C, Michaelis JB, Puth K, Wernig F, Bahrami A, Ernst AM, Hummer G, and Ernst R (2016). A eukaryotic sensor for membrane lipid saturation. Mol. Cell 63, 49–59. [DOI] [PubMed] [Google Scholar]
- De Lano W (2002). The PyMOL Molecular Graphics System (DeLano Scientific).
- Gautier R, Douguet D, Antonny B, and Drin G (2008). HELIQUEST: a web server to screen sequences with specific a-helical properties. Bioinformatics 24, 2101–2102. [DOI] [PubMed] [Google Scholar]
- Haeger S, Kuzmin D, Detro-Dassen S, Lang N, Kilb M, Tsetlin V, Betz H, Laube B, and Schmalzing G (2010). An intramembrane aromatic network determines pentameric assembly of Cys-loop receptors. Nat. Struct. Mol. Biol 17, 90–98. [DOI] [PubMed] [Google Scholar]
- Halbleib K, Pesek K, Covino R, Hofbauer HF, Wunnicke D, Hanelt I, Hummer G, and Ernst R (2017). Activation of the unfolded protein response by lipid bilayer stress. Mol. Cell 67, 673–684.e8. [DOI] [PubMed] [Google Scholar]
- Hess B, Kutzner C, van der Spoel D, and Lindahl E (2008). GROMACS 4: algorithms for highly efficient, load-balanced, and scalable molecular simulation. J. Chem. Theory Comput 4, 435–447. [DOI] [PubMed] [Google Scholar]
- Hetz C, and Glimcher LH (2009). Fine-tuning of the unfolded protein response: assembling the IRE1alpha interactome. Mol. Cell 35, 551–561. [DOI] [PMC free article] [PubMed] [Google Scholar]
- Hetz C, and Papa FR (2018). The unfolded protein response and cell fate control. Mol. Cell 69, 169–181. [DOI] [PubMed] [Google Scholar]
- Hetz C, Bernasconi P, Fisher J, Lee AH, Bassik MC, Antonsson B, Brandt GS, Iwakoshi NN, Schinzel A, Glimcher LH, and Korsmeyer SJ (2006). Proapoptotic BAX and BAK modulate the unfolded protein response by a direct interaction with IRE1alpha. Science 312, 572–576. [DOI] [PubMed] [Google Scholar]
- Holst B, Nygaard R, Valentin-Hansen L, Bach A, Engelstoft MS, Petersen PS, Frimurer TM, and Schwartz TW (2010). A conserved aromatic lock for the tryptophan rotameric switch in TM-VI of seven-transmembrane receptors. J. Biol. Chem 285, 3973–3985. [DOI] [PMC free article] [PubMed] [Google Scholar]
- Humphrey W, Dalke A, and Schulten K (1996). VMD: visual molecular dynamics. J. Mol. Graph 14, 33–38, 27–38. [DOI] [PubMed] [Google Scholar]
- Janowski T, and Pulay P (2007). High accuracy benchmark calculations on the benzene dimer potential energy surface. Chem. Phys. Lett 447, 27–32. [Google Scholar]
- Johnson RM, Hecht K, and Deber CM (2007). Aromatic and cation-pi interactions enhance helix-helix association in a membrane environment. Biochemistry 46, 9208–9214. [DOI] [PubMed] [Google Scholar]
- Kaufman RJ (1999). Stress signaling from the lumen of the endoplasmic reticulum: coordination of gene transcriptional and translational controls. Genes Dev. 13, 1211–1233. [DOI] [PubMed] [Google Scholar]
- Killian JA (1998). Hydrophobic mismatch between proteins and lipids in membranes. Biochim. Biophys. Acta 1376, 401–415. [DOI] [PubMed] [Google Scholar]
- Kitai Y, Ariyama H, Kono N, Oikawa D, Iwawaki T, and Arai H (2013). Membrane lipid saturation activates IRE1α without inducing clustering. Genes Cells 18, 798–809. [DOI] [PubMed] [Google Scholar]
- Kono N, Amin-Wetzel N, and Ron D (2017). Generic membrane-spanning features endow IRE1α with responsiveness to membrane aberrancy. Mol. Biol. Cell 28, 2318–2332. [DOI] [PMC free article] [PubMed] [Google Scholar]
- Korennykh A, and Walter P (2012). Structural basis of the unfolded protein response. Annu. Rev. Cell Dev. Biol 28, 251–277. [DOI] [PubMed] [Google Scholar]
- Kosel D, Heiker JT, Juhl C, Wottawah CM, Blüher M, Mörl K, and Beck-Sickinger AG (2010). Dimerization of adiponectin receptor 1 is inhibited by adiponectin. J. Cell Sci 123, 1320–1328. [DOI] [PubMed] [Google Scholar]
- Lee AH, Iwakoshi NN, and Glimcher LH (2003). XBP-1 regulates a subset of endoplasmic reticulum resident chaperone genes in the unfolded protein response. Mol. Cell. Biol 23, 7448–7459. [DOI] [PMC free article] [PubMed] [Google Scholar]
- Leekumjorn S, and Sum AK (2007). Molecular characterization of gel and liquid-crystalline structures of fully hydrated POPC and POPE bilayers.J. Phys. Chem. B 111, 6026–6033. [DOI] [PubMed] [Google Scholar]
- Leekumjorn S, Wu Y, Sum AK, and Chan C (2008). Experimental and computational studies investigating trehalose protection of HepG2 cells from palmitate-induced toxicity. Biophys. J 94, 2869–2883. [DOI] [PMC free article] [PubMed] [Google Scholar]
- Lemmon MA, Flanagan JM, Hunt JF, Adair BD, Bormann BJ, Dempsey CE, and Engelman DM (1992). Glycophorin A dimerization is driven by specific interactions between transmembrane alpha-helices. J. Biol. Chem 267, 7683–7689. [PubMed] [Google Scholar]
- Li E, You M, and Hristova K (2005). Sodium dodecyl sulfate-polyacryl-amide gel electrophoresis and forster resonance energy transfer suggest weak interactions between fibroblast growth factor receptor 3 (FGFR3) trans-membrane domains in the absence of extracellular domains and ligands. Biochemistry 44, 352–360. [DOI] [PubMed] [Google Scholar]
- Li H, Korennykh AV, Behrman SL, and Walter P (2010). Mammalian endoplasmic reticulum stress sensor IRE1 signals by dynamic clustering. Proc. Natl. Acad. Sci. U S A 107, 16113–16118. [DOI] [PMC free article] [PubMed] [Google Scholar]
- Li J, Jonsson AL, Beuming T, Shelley JC, and Voth GA (2013). Ligand-dependent activation and deactivation of the human adenosine A(2A) receptor. J. Am. Chem. Soc 135, 8749–8759. [DOI] [PMC free article] [PubMed] [Google Scholar]
- Litman BJ, Lewis EN, and Levin IW (1991). Packing characteristics of highly unsaturated bilayer lipids: Raman spectroscopic studies of multilamellar phosphatidylcholine dispersions. Biochemistry 30, 313–319. [DOI] [PubMed] [Google Scholar]
- Lyman E, Higgs C, Kim B, Lupyan D, Shelley JC, Farid R, and Voth GA (2009). A role for a specific cholesterol interaction in stabilizing the Apo configuration of the human A(2A) adenosine receptor. Structure 17, 1660–1668. [DOI] [PMC free article] [PubMed] [Google Scholar]
- Maiorano JN, and Davidson WS (2000). The orientation of helix 4 in apolipoprotein A-I-containing reconstituted high density lipoproteins. J. Biol. Chem 275, 17374–17380. [DOI] [PubMed] [Google Scholar]
- Marrink SJ, Berger O, Tieleman P, and Jähnig F (1998). Adhesion forces of lipids in a phospholipid membrane studied by molecular dynamics simulations. Biophys. J 74, 931–943. [DOI] [PMC free article] [PubMed] [Google Scholar]
- McCloy RA, Rogers S, Caldon CE, Lorca T, Castro A, and Burgess A (2014). Partial inhibition of Cdk1 in G 2 phase overrides the SAC and decouples mitotic events. Cell Cycle 13, 1400–1412. [DOI] [PMC free article] [PubMed] [Google Scholar]
- Ng DP, and Deber CM (2010). Modulation of the oligomerization of myelin proteolipid protein by transmembrane helix interaction motifs. Biochemistry 49, 6896–6902. [DOI] [PubMed] [Google Scholar]
- Oikawa D, Kimata Y, Kohno K, and Iwawaki T (2009). Activation of mammalian IRE1alpha upon ER stress depends on dissociation of BiP rather than on direct interaction with unfolded proteins. Exp. Cell Res 315, 2496–2504. [DOI] [PubMed] [Google Scholar]
- Peter B, Polyansky AA, Fanucchi S, and Dirr HW (2014). A Lys-Trp cation-p interaction mediates the dimerization and function of the chloride intracellular channel protein 1 transmembrane domain. Biochemistry 53, 57–67. [DOI] [PubMed] [Google Scholar]
- Ren J, Lew S, Wang Z, and London E (1997). Transmembrane orientation of hydrophobic alpha-helices is regulated both by the relationship of helix length to bilayer thickness and by the cholesterol concentration. Biochemistry 36, 10213–10220. [DOI] [PubMed] [Google Scholar]
- Ridder A, Skupjen P, Unterreitmeier S, and Langosch D (2005). Tryptophan supports interaction of transmembrane helices. J. Mol. Biol 354, 894–902. [DOI] [PubMed] [Google Scholar]
- Ruan W, Becker V, Klingmüller U, and Langosch D (2004). The interface between self-assembling erythropoietin receptor transmembrane segments corresponds to a membrane-spanning leucine zipper. J. Biol. Chem 279, 3273–3279. [DOI] [PubMed] [Google Scholar]
- Russ WP, and Engelman DM (1999). TOXCAT: a measure of transmembrane helix association in a biological membrane. Proc. Natl. Acad. Sci. U S A 96, 863–868. [DOI] [PMC free article] [PubMed] [Google Scholar]
- Sal-Man N, Gerber D, Bloch I, and Shai Y (2007). Specificity in transmembrane helix-helix interactions mediated by aromatic residues. J. Biol. Chem 282, 19753–19761. [DOI] [PubMed] [Google Scholar]
- Samanta U, Pal D, and Chakrabarti P (1999). Packing of aromatic rings against tryptophan residues in proteins. Acta Crystallogr. D Biol. Crystallogr 55, 1421–1427. [DOI] [PubMed] [Google Scholar]
- Schneider CA, Rasband WS, and Eliceiri KW (2012). NIH Image to ImageJ: 25 years of image analysis. Nat. Methods 9, 671–675. [DOI] [PMC free article] [PubMed] [Google Scholar]
- Schwartz TW, Frimurer TM, Holst B, Rosenkilde MM, and Elling CE (2006). Molecular mechanism of 7TM receptor activation–a global toggle switch model. Annu. Rev. Pharmacol. Toxicol 46, 481–519. [DOI] [PubMed] [Google Scholar]
- Shyu YJ, Liu H, Deng X, and Hu CD (2006). Identification of new fluorescent protein fragments for bimolecular fluorescence complementation analysis under physiological conditions. Biotechniques 40, 61–66. [DOI] [PubMed] [Google Scholar]
- Sievers F, and Higgins DG (2014). Clustal Omega, accurate alignment of very large numbers of sequences. Methods Mol. Biol 1079, 105–116. [DOI] [PubMed] [Google Scholar]
- Sirk TW, Brown EF, Sum AK, and Friedman M (2008). Molecular dynamics study on the biophysical interactions of seven green tea catechins with lipid bilayers of cell membranes. J. Agric. Food Chem 56, 7750–7758. [DOI] [PubMed] [Google Scholar]
- Tao RH, and Maruyama IN (2008). All EGF(ErbB) receptors have preformed homo- and heterodimeric structures in living cells. J. Cell Sci 121, 3207–3217. [DOI] [PubMed] [Google Scholar]
- Tsuru A, Imai Y, Saito M, and Kohno K (2016). Novel mechanism of enhancing IRE1α-XBP1 signalling via the PERK-ATF4 pathway. Sci. Rep 6, 24217. [DOI] [PMC free article] [PubMed] [Google Scholar]
- Van Der Spoel D, Lindahl E, Hess B, Groenhof G, Mark AE, and Berendsen HJ (2005). GROMACS: fast, flexible, and free. J. Comput. Chem 26, 1701–1718. [DOI] [PubMed] [Google Scholar]
- van Meer G, Voelker DR, and Feigenson GW (2008). Membrane lipids: where they are and how they behave. Nat. Rev. Mol. Cell Biol 9, 112–124. [DOI] [PMC free article] [PubMed] [Google Scholar]
- Volmer R, van der Ploeg K, and Ron D (2013). Membrane lipid saturation activates endoplasmic reticulum unfolded protein response transducers through their transmembrane domains. Proc. Natl. Acad. Sci. U S A 110, 4628–4633. [DOI] [PMC free article] [PubMed] [Google Scholar]
- Wang S, and Kaufman RJ (2012). The impact of the unfolded protein response on human disease. J. Cell Biol. 197, 857–867. [DOI] [PMC free article] [PubMed] [Google Scholar]
- Wang M, and Kaufman RJ (2014). The impact of the endoplasmic reticulum protein-folding environment on cancer development. Nat. Rev. Cancer 14, 581–597. [DOI] [PubMed] [Google Scholar]
- Yau WM, Wimley WC, Gawrisch K, and White SH (1998). The preference of tryptophan for membrane interfaces. Biochemistry 37, 14713–14718. [DOI] [PubMed] [Google Scholar]
- Yoshida H, Matsui T, Yamamoto A, Okada T, and Mori K (2001). XBP1 mRNA is induced by ATF6 and spliced by IRE1 in response to ER stress to produce a highly active transcription factor. Cell 107, 881–891. [DOI] [PubMed] [Google Scholar]
- Zhang Y, Luo Y, Deng Y, Mu Y, and Wei G (2012). Lipid interaction and membrane perturbation of human islet amyloid polypeptide monomer and dimer by molecular dynamics simulations. PLoS ONE 7, e38191. [DOI] [PMC free article] [PubMed] [Google Scholar]
- Zhang E, Lu X, Yin S, Yan M, Lu S, Fan L, and Hu H (2019). The functional role of Bax/Bak in palmitate-induced lipoapoptosis. Food Chem. Toxicol 123, 268–274. [DOI] [PubMed] [Google Scholar]
- Zhou J, Liu CY, Back SH, Clark RL, Peisach D, Xu Z, and Kaufman RJ (2006). The crystal structure of human IRE1 luminal domain reveals a conserved dimerization interface required for activation of the unfolded protein response. Proc. Natl. Acad. Sci. USA 103, 14343–14348. [DOI] [PMC free article] [PubMed] [Google Scholar]
Associated Data
This section collects any data citations, data availability statements, or supplementary materials included in this article.