

Abstract
The enzymatic conversion of isothiazolo[4,3-d]pyrimidine based adenosine (tzA) and 2-aminoadenosine (tz2-AA) analogues to the corresponding isothiazolo[4,3-d]pyrimidine based inosine (tzI) and guanosine (tzG) derivatives is evaluated and compared to the conversion of native adenosine to inosine. Henri-Michaelis-Menten analyses provides the foundation for a high throughput screening assay and the efficacy of the assay is showcased via fluorescence-based analysis of tzA conversion to tzI in the presence of known and newly synthesized inhibitors.
Keywords: Adenosine Deaminase, Inhibitor, tzA, Adenosine, Inosine
Graphical Abstract

The enzymatic conversion of isothiazolo[4,3-d]pyrimidine based adenosine (tzA) and 2-aminoadenosine (tz2-AA) analogues to the corresponding isothiazolo[4,3-d]pyrimidine based inosine (tzI) and guanosine (tzG) derivatives.
Introduction
Recently developed isomorphic and isofunctional nucleosides with favourable fluorescent properties have proven useful in biophysical analyses and discovery assays.1–5 The emissive features of some of these analogous nucleosides provide an effective approach to ascertain the kinetic behaviour of enzymes acting on them.2 In particular, the search for enzyme inhibitors is facilitated as the optical interference by candidate derivatives that share a similar chromophoric skeleton as the native substrate nucleosides is minimized. The optical window that is opened up by visibly emitting substrates thus allows investigators to rely on fast, high throughput and frequently real-time assays to assess enzymatic reactions and their inhibition.6,7
Adenosine deaminase (ADA), a critically important enzyme involved in purine catabolism, which deaminates adenosine to generate inosine, illustrates this concept.8 It is a validated target for treating leukemia.9 Pentostatin, one of its inhibitors, is currently in the clinic.10 ADA’s deamination of adenosine can be monitored by chromatographic tools (which are time consuming) or absorption spectroscopy, which suffers from optical interference by inhibitors that display absorption in the middle ultraviolet region, where adenosine itself absorbs.11 To overcome this obstacle, a fluorescence-based inhibitor discovery assay has been demonstrated using thA, a thieno[3,4-d]pyrimidine based adenosine analogue (Fig. 1), where deamination and its inhibition could be continuously monitored in real time.6
Figure 1.

Structure, absorption (dashed), and emission (solid) spectra of a) A (red) and I (blue) b) thA (red) and thI (blue) c) tzA (red) and tzI (blue) d) tz2-AA (red) and tzG (blue) at 10 μM in water.
While thA and thI, its deamination product, display distinct emission spectra, thus facilitating the fluorescence-based monitoring of the enzymatic process, thA is deaminated significantly slower than its native counterpart.6 This shortcoming has inspired the development of a second generation of fluorescing nucleoside analogues with elevated isofunctionality, based on an isothiazolopyrimidine framework, including tzA and tz2-AA (an emissive analogue of a non-canonical nucleoside known to be an ADA substrate) (Fig. 1).12,13
Possessing emissive substrates with distinct enzyme affinities and deamination rates can thus allow researchers to fine tune such discovery assays to address practical aspects (i.e., adjusting the rate to match instrumental response time) or match fundamental constraints (i.e., search for inhibitors within a range of specific affinity/potency).11,14 We thus present here the Henri-Michaelis-Menten (HMM) kinetic analyses of ADA-mediated deamination of A, tzA and tz2-AA and exploit the emissive features of the two synthetic analogues to assess the inhibitory potential on newly synthesized inhibitors based on 1-deazaadenosine.
Results and Discussion
Due to the rapidity of the ADA-mediated deamination of tzA, as shown in the pseudo-first order kinetic studies,12 a stopped flow apparatus was used to ensure even mixing and to ultimately determine the Km and kcat values. Initial velocities of the deamination reaction were then accurately measured by fluorescence spectroscopy, relying on the different photophysical features of the substrate and product.12 As the emission quantum yield of tzA is significantly higher than that of tzI (Fig. 1), the decrease in emission was measured over time, following excitation at 322 nm, the absorption isosbestic point of tzA and tzI. The Vmax and Km values were extrapolated using nonlinear regression (Fig. 2) and are listed in Table 1. The Vmax values were plotted and fitted with a linear function followed by interpolation of the kcat rate constant.
Figure 2.
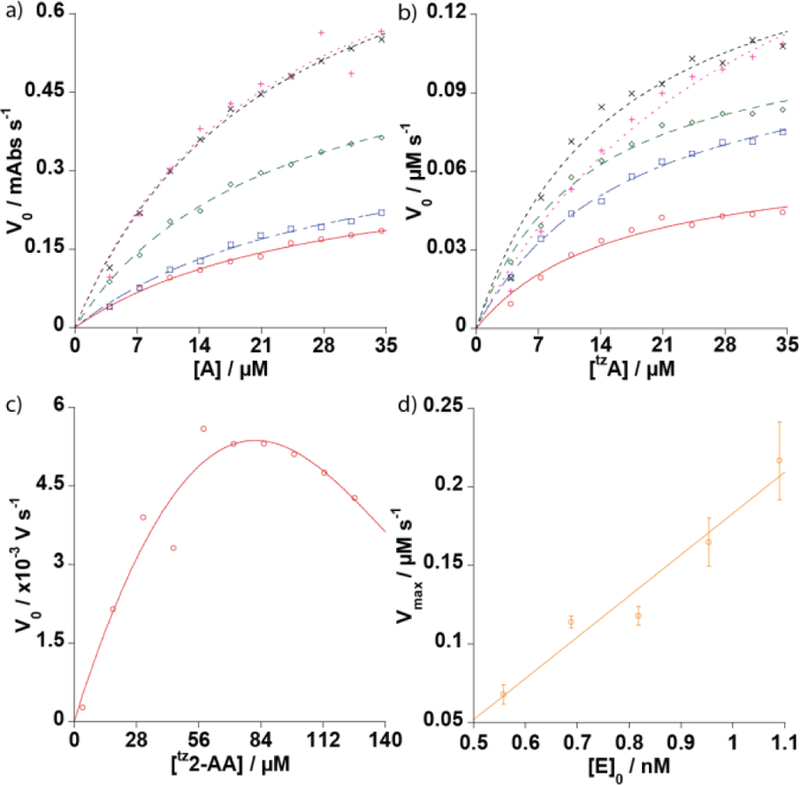
a, b) Henri-Michaelis-Menten plots of tzA to tzI ([tzA] = 3.9–34.5 μM, red, blue, green, black, and pink represent [ADA] = 4.1, 5.1, 6.1, 7.1, and 8.1 mU mL−1) and A to I ([A] = 3.9–34.5 μM, red, blue, green, black, and pink represent [ADA] = 4.1, 5.1, 6.1, 7.1, and 8.1 mU mL−1), c) Competitive inhibition Michaelis-Menten plot with [I] = [tzG] = A*exp(B*[ tz2-AA]) of tz2-AA to tzG d) Vmax vs [E]0 plot of tzA.
Table 1.
Experimentally Determined Henri-Michaelis-Menten Parameters.
| Compound | [E]0 (mU mL−1) | KM (μM) | Vmax[a] | R2 |
|---|---|---|---|---|
| tzA | 4.1 | 15.9±3.4 | 0.0677±0.0062 | 0.960 |
| tzA | 5.1 | 17.4±1.3 | 0.114±0.004 | 0.995 |
| tzA | 6.1 | 12.4 ± 1.6 | 0.118±0.006 | 0.980 |
| tzA | 7.1 | 15.8 ± 3.4 | 0.165±0.015 | 0.959 |
| tzA | 8.1 | 32.3 ± 6.4 | 0.217±0.025 | 0.982 |
| Adenosine | 4.1 | 27.8 ± 2.9 | 0.334±0.019 | 0.993 |
| Adenosine | 5.1 | 29.5 ± 3.8 | 0.407±0.029 | 0.991 |
| Adenosine | 6.1 | 22.8 ± 1.8 | 0.610±0.025 | 0.995 |
| Adenosine | 7.1 | 22.8 ± 1.8 | 0.930±0.036 | 0.996 |
| Adenosine | 8.1 | 22.4 ± 5.5 | 0.936±0.12 | 0.960 |
KM and Vmax were calculated using nonlinear regression of ten separate points each performed in triplicate. [a] Adenosine units: mAbs s−1;tzA units: Voltage s−1.
Results of the HMM analysis of tzA deamination yielded a Km average of 18.8 ± 3.2 μM (Table 1) and Vmax values that followed a linearly increasing trend when plotted against enzyme concentration. This fell just below the previously reported value, 29 μM, of adenosine.6 The interpolated kcat value was 263 ± 34 s−1. The reported kcat of adenosine is 188 s−1.15 The calculated average Km of tzA indicated tighter enzyme binding compared to values reported for adenosine and the interpolated kcat value indicated faster conversion.15 These results indicated the potential application of tzA for a faster high-throughput assay than previously reported for thA.6,12
To compare tzA to adenosine under the same conditions, the deamination of the latter to inosine was also monitored in the same stopped flow apparatus (Fig. 2). As adenosine does not fluoresce, the decrease in absorbance at 265 nm over time was measured to determine the reaction rate.6 The Vmax and Km values were extrapolated using nonlinear regression (Fig. 2) and are listed in Table 1. Calculated Km values of native adenosine were 27.8 ± 2.9, 29.5 ± 3.8, 22.8 ± 1.8, 22.8 ± 1.8, and 22.4 ± 5.5 μM for 4.1, 5.1, 6.1, 7.1, and 8.1 mU/mL enzyme concentrations resulting in an average of 25.1 ± 3.2 μM. The discrepancy in Km values determined with the stopped flow apparatus and previously reported 29 μM may have been due to a single value being taken as opposed to the average calculated herein.6 This was further supported by the fact that the Km of the 4.1 mU mL−1 curve, the same enzyme concentration previously used, was 27.8 ± 2.9 μM, well within the experimental error of the reported 29 μM.6
A similar HMM kinetic analysis of the enzymatic deamination of tz2-AA to the isothiazolo[4,3-d]pyrimidine based guanosine derivative (tzG) was performed using the same stopped flow apparatus. The decrease in emission was measured over time following excitation at 338 nm, the isosbestic point of tz2-AA and tzG, allowing us to determine initial velocities.13 Unlike the other substrates, the tz2-AA HMM curve showed parabolic behaviour with increasing substrate concentration indicative of negative feedback possibly due to product inhibition (Fig. 2). As a result, a standard HMM curve did not fit the data beyond a substrate concentration of 80 μM. Potential causes could be product inhibition, photobleaching, reactive side products, etc.
In an attempt to model these observations and identify the cause, we have used the competitive inhibitor Michaelis-Menten equation. It assumes a constant inhibitor concentration with increasing substrate concentration.17 Under product inhibition conditions, inhibitor concentration increases proportionally to substrate concentration according to a set of nonlinear differential equations.17 To model the observed behaviour, a simplified exponential relationship between substrate and product of the form [I] = A*exp(B*[S]) was substituted for inhibitor concentration in the Michaelis-Menten competitive inhibition equation.16 Due to the high quantum yield of tzG, an IC50 plot analysis of tzA to tzI conversion in the presence of increasing concentrations of tzG was performed with HPLC analysis.12 Results showed minimal inhibition at tzG concentrations of 100 μM indicating tzG was unlikely the cause (Fig. S4).16 The maximum possible concentration of tzG that could have formed was the starting concentration of tz2-AA. As this concentration never exceeded 126 uM, inhibition of the reaction by tzG seemed unlikely.
To showcase the potential of the fluorescence monitored ADA deamination reactions for inhibitor screening, a small number of potential inhibitors was synthesized. 1-deaza adenosine was selected as the structural core since this nucleoside and many of its derivatives are known ADA inhibitors.18 We thus sought to make and test a number of derivatives with substitutions at the 5- and 7- carbon position, inspired by the inhibitor 5-chloro-7-(methylamino)-9-ribosyl-imidazolopyridine (8).18a Longer alkyl chains, benzyl groups, and different substituents of the amino group had not been previously reported.
Synthesis started with 2,3-diaminopyridine (Scheme 1). Treatment with triethylorthoformate and then formic acid yielded the fused imidazolopyridine 2,19 which was oxidized with meta-chloroperbenzoic acid to give the N-oxide 3.19 Nitration of 3 with nitric acid at elevated temperatures produced 4, which was treated with phosphoryl chloride to yield the dichloro derivative 5.19,20 Glycosylation of 5 was performed with 1,2,3,5-tetra-O-acetyl-β-d-ribofuranose and tin tetrachloride to produce 6.20 Deprotection of 6 was accomplished with methanolic ammonia to yield 7, a common key intermediate.20
Scheme 1.
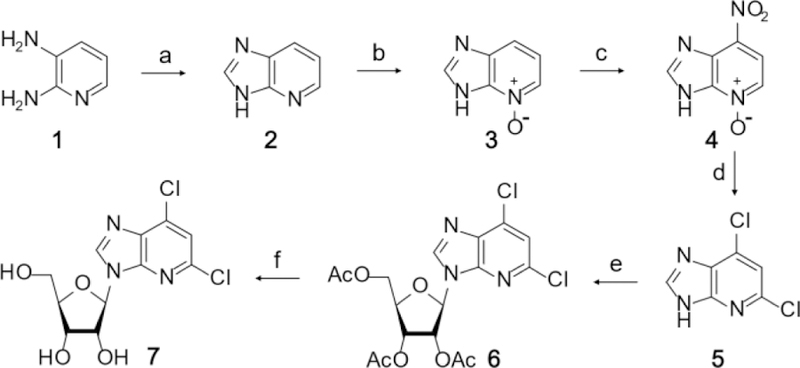
Synthetic pathway to key intermediate used to synthesize potential inhibitors. Reagents and Conditions: (a) i. 1, triethylorthoformate, 145⁰C, 3 h; ii. Formic acid, 110⁰C, 2 h; iii. MeOH, activated charcoal, rt, overnight, 99%. (b) 2, meta-chloroperbenzoic acid, rt, 72 h, 60%. (c) 3, TFA, 70% nitric acid, 90⁰C, 4 h, 63%. (d) 4, DMF, phosphoryl chloride, 115⁰C, 10 m, 50%. (e) 5, TAR, ACN, Tin (IV) chloride, rt, overnight, 82%. (f) 6, MeOH, NH3, rt, 2 h, 50%.
Various nucleophiles, including methylamine, sodium methoxide, sodium methanethiolate, propylamine, n-butylamine, benzylamine, and phenethylamine were added to 7 to displace the 7-chloro substituent. The chloro substituent at position 5 is far less reactive and was only successfully replaced with methoxide. The resulting derivatives were fully characterized using 1H and 13C NMR spectroscopy, as well as HRMS.16 The absorption spectra of the analytically pure 8, 9, 10, 11, and 12 were measured between 220 to 600 nm.16 To illustrate the potential spectral interference these putative inhibitors might cause, their spectra were overlaid with that of adenosine and tzA (Fig. 3), and were further expanded in Figure S3.16 While the absorption spectrum of adenosine shows extensive overlap with that of the potential inhibitors, only minimal overlap is seen with the spectrum of tzA. This, therefore, facilitates selective excitation of the emissive adenosine analogue, ensuring a reliable fluorescence-based activity/inhibition assay.
Figure 3.

a) Structure of potential inhibitors 8–12; b) Absorption spectra of adenosine (solid, blue), tzA (solid, red), 8 (dashed, orange), 9 (dashed, black), 10 (dashed, green), 11 (dashed, teal), 12 (dashed, pink).
To demonstrate the efficiency and accuracy of a screening assay utilizing tzA, inhibition studies were performed with Pentostatin and EHNA, both established inhibitors, in addition to the newly synthesized derivatives (Fig. 4, 5).8 A preliminary screening of compounds 8–12 at 100 μM was performed and compounds 8 and 11, demonstrating some potency, were further analyzed (Fig. S4, Table S1). tzA to tzI emission decline was monitored over 10 minutes. Inhibitors were added at a range of concentrations depending on the potency of the inhibitor, each in triplicate, at a substrate and ADA concentration of 3.9 μM and 4.1 mU mL−1, respectively.16 The averages of each inhibitor concentration were converted to a percentage in decimal form of uninhibited tzA to tzI conversion and then plotted on a semi-log axes (Fig. 4, 5).
Figure 4.

a) Structures of Pentostatin and EHNA; b, c) conversion of tzA to tzI with varying concentrations of Pentostatin (b; red, blue, green, black, and pink lines represent [I] = 0, 0.1, 1, 2.5, 10 nM) and EHNA (c; red, blue, green, black, and pink lines represent [I] = 0, 1, 10, 25, 100 nM); d) Semi-log plot of % inhibition in decimal form after 10 minutes vs. [I] and sigmoidal Hill plot fits for Pentostatin (□, blue line, R2: 0.990) and EHNA (o, red line, R2: 0.997).
Figure 5.

a) Structures of 8 and 11; b, c) conversion of tzA to tzI with varying concentrations of 8 (b; red, blue, green, black, and pink lines represent [I] = 0, 1, 10, 100, 1000 μM) and 11 (c; red, blue, green, black, and pink lines represent [I] = 0, 1, 10, 100, 1000 μM); d) Semi-log plot of % inhibition in decimal form after 10 minutes vs. [I] and sigmoidal Hill plot fits for 8 (□, green line, R2: 0.976) and 11 (o, purple line, R2: 0.997).
Generated inhibitor IC50 plots were fitted with a sigmoidal Hill curve yielding IC50 values of 1.44 ± 0.14 nM, 23.2 ± 4.2 nM, 21 ± 8 μM, and 220 ± 70 μM for Pentostatin, EHNA, 8, and 11 respectively (Fig. 4,5). Transformation of the IC50 values to KI values with the Cheng-Prusoff equation gave 1.19 ± 0.15 nM, 19.2 ± 4.0 nM, 18 ± 7 μM, and 190 ± 70 μM for Pentostatin, EHNA, 8, and 11, respectively.21 The determined IC50 and KI values of Pentostatin, EHNA, and 8 were in good agreement with previously reported values demonstrating the accuracy of the assay.6,8,18a The IC50 of 8, a previously synthesized and analyzed inhibitor, was higher than the reported value.18a The absorption spectra of 8 was shown to overlap with the spectra of adenosine (Fig. 3).18a Since previous analyses of 8 were performed using absorption measurements, spectral interference could potentially account for such discrepancies.18a As tzA primarily absorbs and fluoresces at longer wavelengths than the inhibitors, a higher degree of accuracy was possible.18a,c While a rather impotent inhibitor, 11 was newly synthesized and tested with this assay. As with 8, the absorption spectrum of 11 significantly overlaps with that of adenosine. In contrast, the absorption spectrum of tzA did not overlap with the spectrum of the inhibitor in the range used by the screening assay providing a more robust screening.
Conclusions
Michaelis-Menten analyses of the ADA-mediated deamination reactions of adenosine, tzA, and tz2-AA were conducted. Vmax and Km values were determined for adenosine and tzA and a product inhibition curve was fit to tz2-AA V0 data. A kcat value was interpolated for tzA. Several potential inhibitors of ADA based on 1-deazaadenosine were synthesized. An IC50 analyses of Pentostatin, EHNA, 8, and 11 were performed and IC50 values of Pentostain, EHNA, and 8 were in good standing with previously reported values. One of the newly synthesized derivatives, 11, was determined to be a weak inhibitor of ADA.
Overall, two new ADA inhibitor discovery assays were established. Similar to the previously established assay, the two adenosine analogues absorb primarily above 300 nm, outside of the optical absorption range of most ADA inhibitors. Additionally, each adenosine analogue has its own conversion rate as well as unique absorption and emission spectra thus allowing one to adjust signal intensity, wavelength range, and reaction time. This was showcased by the use of one assay to analyse two well established inhibitors, EHNA and Pentostatin, and compare with an already established assay.6 Likewise, another known inhibitor, 8, was re-evaluated using the new assay and compared with a previously reported value determined with adenosine.18a Finally, a new inhibitor, 11, was discovered using the newly established assay.
Experimental Section
Materials and Methods:
Reagents were purchased from Sigma-Aldrich, TCI, and Acros and were used without further purification unless otherwise specified. Solvents were purchased from Sigma-Aldrich and Fisher Scientific, and dried by standard techniques. NMR solvents were purchased from Cambridge Isotope Laboratories (Andover, MA). All reactions were monitored with analytical TLC (Merck Kieselgel 60 F254). Column chromatography was carried out with Teledyne ISCO Combiflash Rf with silica gel particle size 40–63 um. NMR spectra were obtained on Varian Mercury 300 MHz and Varian VX 500 MHz. Mass spectra were obtained on an Agilent 6230 HR-ESI-TOF MS at the Mass Spectrometry Facility at the UCSD Chemistry and Biochemistry Department.
Key Intermediate 7:
Compounds 2–7 were synthesized based on previously published procedures19,20 and 1 was purchased from Sigma-Aldrich.
5-chloro-7-methylamino-1-deaza-purine riboside (8):
Solid 7 (10 mg, 0.031 mmol) was placed in a pressure vial (8 mL) and then dissolved in methylamine in ethanol (33wt%, 2 mL, 16 mmol, 520 eq.) while stirring. The vial was capped and the mixture brought to 80⁰C and stirred for 48 hours. The mixture was allowed to cool and the solvent evaporated off. The resulting residue was purified using column chromatography with a gradient of 0 to 10% MeOH in DCM (Rf: 0.3 in 10% MeOH in DCM) yielding 8 as a glassy, clear solid (8.2 mg, 84%). 1H NMR (300 MHz, CD3OD): δ 8.22 (s, 1H), 6.43 (s, 1H), 5.94 (d, J = 6.4 Hz, 1H), 4.78 (t, J = 6.0 Hz, 1H), 4.34 (dd, J = 5.0, 2.6 Hz, 1H), 4.18 (q, J = 2.4 Hz, 1H), 3.91, 3.77 (ABq, J = 12.6 Hz, 2H), 3.01 (s, 3H). 13C NMR (125 MHz, CD3OD): δ 149.10, 147.15, 144.10, 139.96, 139.88, 122.75, 97.50, 89.92, 86.57, 73.52, 71.23, 62.19. ESI-HRMS calculated for C12H15ClN4O4 [M+H]+ 315.0855, found 315.0854.16,18a
5-chloro-7-methylthio-1-deaza-purine riboside (9):
Solid 7 (7.6 mg, 0.024 mmol) was placed in a pressure vial and flushed with argon. Sodium methanethiolate in MeOH (0.5 M, 2 mL, 1.0 mmol, 42 eq.) was added to the mixture and then stirred at 105⁰C for 24 hours. The mixture was cooled and the solvent evaporated off. The resulting residue was purified with column chromatography with a gradient of 0 to 10% MeOH in DCM (Rf: 0.5 in 10% MeOH in DCM) yielding 9 as a pale yellow solid (6.7 mg, 84%). 1H NMR (300MHz, CD3OD): δ 8.57 (s, 1H), 7.19 (s, 1H), 6.07 (d, J = 5.7 Hz, 1H), 4.73 (t, J = 5.4 Hz, 1H), 4.37 (t, J = 4.5 Hz, 1H), 4.18 (q, J = 3.1 Hz, 1H), 3.92, 3.80 (ABq, J = 12.3 Hz, 2H), 2.67 (s, 3H). 13C NMR (125MHz, CD3OD): δ 146.20, 146.02, 143.17, 142.75, 131.52, 112.37, 89.43, 86.07, 73.99, 70.75, 61.69, 11.98. ESI-HRMS calculated for C12H14ClN3O4S [M–H]− 330.0321, found 330.0320.16
5,7-dimethoxy-1-deaza-purine riboside (10):
Solid 7 (7.8 mg, 0.025 mmol) was placed in a pressure vial and flushed with argon. Sodium methoxide in MeOH (2 mL, 0.5M, 40 eq.) was added to the mixture and then stirred at 105⁰C for 24 hours. The mixture was cooled and then placed under vacuum to remove excess solvent. The resulting residue was purified with column chromatography with a gradient of 0 to 10% MeOH in DCM (Rf: 0.4 in 10% MeOH in DCM) yielding 10 as a pale yellow solid (2.0 mg, 26%). 1H NMR (300MHz, CD3OD): δ 8.26 (s, 1H), 6.30 (s, 1H), 6.06 (d, J = 5.3 Hz, 1H), 4.81 (t, J = 5.3 Hz, 1H), 4.42 (t, J = 4.5 Hz, 1H), 4.11 (dd, J = 7.9, 3.9 Hz, 1H), 4.03 (s, 3H), 3.98 (s, 3H), 3.88, 3.78 (ABq, J = 12.0 Hz, 2H). 13C NMR (125MHz, CD3OD): δ 163.71, 159.66, 144.59, 139.05, 120.86, 88.67, 88.02, 85.14, 73.75, 70.57, 61.62, 55.15, 53.15. ESI-HRMS calculated for C13H17N3O6 [M+Na]+ 334.1010, found 334.1007.16
5-chloro-7-benzylamino-1-deaza-purine riboside (11):
Solid 7 (7.9 mg, 0.025 mmol) was placed in a pressure vial and flushed with argon. n-Butanol (2 mL) and benzylamine (0.11 mL, 1.0 mmol, 40 eq.) were added to the mixture and then stirred at 90⁰C for 24 hours. The mixture was cooled and the excess solvent removed under vacuum. The resulting residue was purified with column chromatography with a gradient of 0 to 5% MeOH in DCM (Rf: 0.3 in 5% MeOH in DCM) yielding 11 as a glassy yellow solid (8.5 mg, 87%). 1H NMR (300MHz, CD3OD): δ 8.25 (s, 1H), 7.45–7.25 (m, 5H), 6.42 (s, 1H), 5.94 (d, J = 6.4 Hz, 1H), 4.77 (t, J = 6.0 Hz, 1H), 4.62 (s, 2H), 4.33 (dd, J = 5.1, 2.6 Hz, 1H), 4.18 (q, J = 2.6 Hz, 1H), 3.92, 3.76 (ABq, J = 12.5 Hz, 2H). 13C NMR (125MHz, CD3OD): δ 149.10, 147.15, 144.10, 139.96, 122.75, 97.50, 89.92, 86.57, 73.52, 71.23, 62.19, 20.65. ESI-HRMS calculated for C18H19ClN4O4 [M–H]− 389.1022, found 389.1019.16
5-chloro-7-butylamino-1-deaza-purine riboside (12):
Solid 7 (8.2 mg, 0.026 mmol) was placed in a pressure vial and flushed with argon. n-Butanol (2 mL) and n-butylamine (0.1 mL, 1.0 mmol, 38 eq.) were added to the mixture and then stirred at 90⁰C overnight. The mixture was cooled and the solvent evaporated off with a rotary evaporator. The resulting residue was purified with column chromatography with a gradient of 0 to 10% MeOH in DCM (Rf: 0.4 in 10% MeOH in DCM) yielding 12 as a glassy solid (4.1 mg, 44%). 1H NMR (300MHz, CD3OD): δ 8.23 (s, 1H), 6.45 (s, 1H), 5.93 (d, J = 6.4 Hz, 1H), 4.77 (t, J = 6.0 Hz, 1H), 4.34 (dd, J = 5.0, 2.6 Hz, 1H), 4.18 (q, J = 2.5 Hz, 1H), 3.92, 3.76 (ABq, J = 12.5 Hz, 2H), 3.38 (t, J = 6.9 Hz, 2H), 1.79 – 1.63 (m, 2H), 1.51 (dq, J = 14.3, 7.2 Hz 2H), 1.02 (t, J = 7.3 Hz, 3H). 13C NMR (125MHz, CD3OD): δ 149.10, 147.15, 144.10, 139.96, 122.75, 97.50, 89.92, 86.57, 73.52, 71.23, 62.19, 20.65. ESI-HRMS calculated for C15H21ClN4O4 [M+H]+ 357.1324, found 357.1320.16
Henri-Michaelis-Menten Kinetics General Methods:
Bovine spleen ADA was obtained from Sigma Aldrich (EC Number 232–817-5). The commercial solution [1150 U mL−1 in 3.2 M (NH4)2SO4, 0.01 M potassium phosphate, pH 6.0] was diluted to 1.15 U mL−1 by dissolving an aliquot (1 μL) in phosphate buffer (999 μL, 50 mM, pH 7.4). The enzyme stock solution was freshly prepared and kept on ice prior to use. The enzyme stock solution was diluted to concentrations of 4.5, 5.6, 6.7, 7.8, and 8.9 mU mL−1 with phosphate buffer. A total of 20 μL enzyme solution was mixed with 200 μL of substrate solution in the stopped flow apparatus chamber yielding final enzyme concentrations of 4.1, 5.1, 6.1, 7.1, and 8.1 mU mL−1.
Concentrated stock solutions (3.7 mM, 4.1 mM) in DMSO were prepared for tzA and tz2-AA. A 1.0 mM solution was prepared for tzA and tz2-AA from the concentrated stock solutions and autoclaved water. A 1.0 mM solution of adenosine was prepared in autoclaved water from solid adenosine.
The ADA-mediated enzymatic conversion of adenosine (and its analogs) was followed by absorbance and emission (for the emissive analogs tzA and tz2-AA) spectroscopy by monitoring the intensity variation for absorbance and voltage output for emission as a function of time. The real-time conversion of adenosine (and its analogs) to inosine (and its analogs) were performed on an Applied Photophysics Pistar Stop Flow Apparatus.
Stopped Flow Fluorescence Measurements and HMM Kinetic Analysis of Enzymatic Conversion of tzA to tzI:
Substrate concentrations ranging from 3.9 to 34.5 μM were used keeping the enzyme concentration constant at 4.1 – 8.1 mU mL−1. Upon excitation at 322 nm with a bandwidth of 2 nm substrate concentration voltage output (V) decrease was measured over 50 seconds. The photo multiplication unit (PMU) was set to 550.
Data points were fit with a linear approximation in MatLab to determine the rate of conversion V0 (V s−1) and the initial voltage output. An average of the initial voltage output for each substrate concentration was plotted against the substrate concentration producing a linear slope. The linear slope was used to convert all voltage output vs. time plots to concentration vs. time plots. Linear approximation of the concentration vs. time plots yielded the rate of conversion V0 ([S] s−1). The average value for the rate of conversion V0 ([S] s−1) for each substrate concentration measured in triplicate was plotted as a function of substrate concentration. Vmax was extrapolated from the rate of conversion vs. substrate concentration plots using KaleidaGraph and Michaelis-Menten fitted non-linear regression. The KM of each plot was determined by taking the substrate concentration at half Vmax. The Vmax of each enzyme concentration was plotted to yield a Vmax vs. enzyme concentration plot. The plot was fit with a linear approximation providing the slope (kcat).
Stopped Flow Absorbance Measurements and HMM Kinetic Analysis of Enzymatic Conversion of A to I:
Substrate concentrations ranging from 3.9 to 34.5 μM were used keeping the enzyme concentration constant at 4.1 – 8.1 mU mL−1. Absorbance was measured over 50 seconds at a wavelength of 265 nm. Data points were fit with a linear approximation in MatLab to determine the rate of conversion V0 (mAbs s−1). The average values for the rate of conversion V0 (Abs s−1) for each substrate concentration measured in triplicate were plotted as a function of substrate concentration. Vmax was extrapolated from the rate of conversion (mAbs s−1) vs. concentration plots using KaleidaGraph and Michaelis-Menten fitted non-linear regression. The KM of each plot was determined by taking the substrate concentration at half Vmax.
Stopped Flow Fluorescence Measurements and HMM Kinetic Analysis of Enzymatic Conversion of tz2-AA to tzG:
Substrate concentrations ranging from 3.9 to 126 μM were used keeping the enzyme concentration constant at 4.1 mU mL−1. Upon excitation at 338 nm with a bandwidth of 2 nm substrate concentration voltage output (V) decrease was measured over 50 seconds. The photo multiplication unit (PMU) was set to 450. Data points were fit with a linear approximation in MatLab to determine the rate of conversion V0 (V s−1). The average values for the rate of conversion V0 (V s−1) for each substrate concentration measured in triplicate were plotted as a function of substrate concentration. In order to model product inhibition, a makeshift function16 (see SI) was fit to the data using nonlinear regression to approximate the KM, KI, and Vmax of the resulting curve. The function was developed from the Michaelis-Menten competitive inhibition equation substituting an exponential relationship16 (see SI) between product and substrate for [I].
Screening of Potential Inhibitors:
The ADA-mediated enzymatic conversion of tzA in the presence of inhibitor was followed by emission spectroscopy by monitoring the emission intensity signal at 410 nm upon excitation at 322 nm (the isosbestic point determined by absorption spectroscopy). The real-time conversion of tzA to tzI was measured on a Horiba Fluoromax-4 equipped with a cuvette holder with a built-in stirring system, setting the excitation and emission slits at 3 nm respectively and taking a point every two seconds for 600 seconds upon addition of ADA.
Each potential inhibitor was screened with tzA conversion to tzI in the presence of ADA. Concentrated stock solutions of each potential inhibitor were prepared in water and DMSO. An aliquot of the tzA 1.0 mM stock solution and an aliquot of a potential inhibitor stock solution was added to phosphate buffer (50mM, 7.4 pH) in a 3 mL cuvette for a final tzA concentration of 3.9 μM and a final potential inhibitor concentration of 100 μM. Upon excitation at 322 nm and observation of emission at 410 nm an aliquot of ADA stock solution was added and emission observed for 600 seconds. Each resulting emission vs. time plot was normalized relative to the blank (no inhibitor present) setting the initial intensity to 0 and the maximum intensity change as 1.16
Potential Inhibitor Absorption Spectra:
Spectroscopic grade DMSO was obtained from Sigma Aldrich and aqueous solutions were prepared with de-ionized water. All the measurements were carried out in a 1 cm four-sided quartz cuvette from Helma.
Absorption spectra were measured on a Shimadzu UV-2450 spectrophotometer setting the slit at 1 nm and using a resolution of 0.5 nm. All the spectra were corrected for the blank. The instrument was equipped with a thermostat controlled ethylene glycol-water bath fitted to specially designed cuvette holder and the temperature was kept at 25.0 ± 0.1⁰C.
Inhibitors were dissolved in water and a small portion of DMSO if necessary to prepare highly concentrated stock solutions: 8 (1.6 mM), 9 (6.0 mM), 10 (4.2 mM), 11 (2.3 mM), 12 (1.0 mM). In a typical experiment, aliquots of the respective concentration stock solutions were diluted with air-saturated water to yield a final concentration of 0.1 M and a total volume of 125 μL. The solutions were mixed with a pipette for 10 seconds and placed in the cuvette holder at 25.0 ± 0.1⁰C for 3 minutes before spectra were recorded. The percent by volume of DMSO for each sample were: 9 (0.05 v/v%), 11 (0.1 v/v%), 12 (0.03 v/v%).16
HPLC Analysis of ADA Activity In the Presence of tzG:
In order to confirm tzG inhibition of ADA, inhibition studies were performed on tzG. As tzG is fluorescent and has a higher quantum yield than tzA and tzI, inhibition had to be tested using HPLC. tzA was converted to tzI in the presence of ADA in the presence of increasing concentrations of tzG. For each experiment, the commercial solution (1150 U/mL in 3.2 M (NH4)2SO4, 0.01 M potassium phosphate, pH 6.0) was diluted to 1.15 U/mL by dissolving an aliquot (1 μL) in phosphate buffer (999 μL, 50 mM, pH 7.4). The enzyme stock solution was freshly prepared and kept on ice prior to use. Stock solutions of 1 mM tzA and 1 mM tzG were prepared. An aliquot of tzG and the appropriate amount of phosphate buffer were mixed to arrive at concentrations of 0, 0.1, 1, 10, and 100 μM and then an aliquot of tzA (5.9 μL) was added for a final concentration of 3.9 μM. An aliquot of ADA (5.4 μL) was added for a total of 1500 μL and concentration of 4.1 mU mL−1. After allowing the reaction to proceed for 10 minutes the mixture was frozen in a –78⁰C bath. The reaction was then reheated to liquid and immediately placed in the HPLC for separation and analysis.
HPLC analysis was performed with an Agilent 1200 series system with a Sepax Bio-C18 5μm, 4.6 × 250 mm column. Stock solutions of 0.1% TFA were prepared by dissolving 1 mL of TFA (99%) in 999 mL MilliQ water or HPLC grade acetonitrile and filtered using Millipore type GNWP 0.2 μm filters before use. Injections of 15 μL were subjected to a gradient of 0.5% to 5% acetonitrile 0.1% TFA in water 0.1% TFA over 25 minutes. The column was then flushed for 10 minutes. Each experiment was run at 1 mL/min at 25⁰C. Each run was monitored at 260, 315, and 333 nm with calibrated references at 650 nm and a slit width of 1 nm.
The area under each tzA peak was integrated and plotted as percent inhibition normalized to the blank. Each curve was compared to a standard run performed with tzA alone. Results showed little change in area of the tzA peak. This suggested tzG was not a potent enough inhibitor to cause the drop in initial rate of the tz2-AA ADA reaction at higher concentrations.16
Supplementary Material
Acknowledgements
We thank the National Institutes of Health for generous support (via grant number GM 069773), the Chemistry & Biochemistry MS Facility, and the UCSD NMR Facility.
Abbreviations:
- DCM
dichloromethane
- DMF N
N-dimethylformamide
- MeOH
methanol
- TFA
Trifluoroacetic acid
- DMSO
Dimethyl sulfoxide
- ACN
Acetonitrile
- TAR
Tetra-O-acetyl-β-d-ribofuranose
References
- [1].(a) Wilson JN and Kool ET, Org. Biomol. Chem, 2006, 4, 4265–4274 [DOI] [PubMed] [Google Scholar]; (b) Hawkins ME, Cell Biochem. Biophys, 2001, 34, 257–281 [DOI] [PubMed] [Google Scholar]; (c) Wilhelmsson LM, Q. Rev. Biophys, 2010, 43, 159–183 [DOI] [PubMed] [Google Scholar]; (d) Wierzchowski J, Antosiewicz JM and Shugar D, Mol. BioSyst, 2014, 10, 2756–2774 [DOI] [PubMed] [Google Scholar]; (e) Kimoto M, Cox RS and Hirao I, Expert Rev. Mol. Diagn, 2011, 11, 321–31 [DOI] [PubMed] [Google Scholar]; (f) Okamoto A, Saito Y and Saito I, J. Photochem. Photobiol. C Photochem. Rev, 2005, 6, 108–122 [Google Scholar]; (g) Xu W, Chan K and Kool E, Nat. Chem, 2017, 9, 1043–1055 [DOI] [PMC free article] [PubMed] [Google Scholar]; (h) Saito Y and Hudson R, J. Photochem. Photobiol. C Photochem. Rev, 2018, 36, 48–73. [Google Scholar]
- [2].Jones AC and Neely RK, Q. Rev. Biophys, 2015, 48, 244–279. [DOI] [PubMed] [Google Scholar]
- [3].Sinkeldam RW, Greco N and Tor Y, Chem. Rev, 2010, 110, 2579–2619. [DOI] [PMC free article] [PubMed] [Google Scholar]
- [4].(a) Seio K, Kanamori T and Masaki Y, Tetrahedron Lett, 2018, 59, 1977–1985 [Google Scholar]; (b) Maiti M, Michielssens S, Dyubankova N, Maiti M, Lescrinier E, Ceulemans A, and Herdewijn P, Chem. A Eur. J, 2012, 18, 857–868. [DOI] [PubMed] [Google Scholar]
- [5].Rovira AR, Fin A and Tor Y, J. Am. Chem. Soc, 2017, 139, 15556–15559 [DOI] [PMC free article] [PubMed] [Google Scholar]; (j) Hallé F, Fin A, Rovira AR and Tor Y, Angew. Chem. Int. Ed, 2018, 57, 1087–1090. [DOI] [PMC free article] [PubMed] [Google Scholar]
- [6].Sinkeldam RW, McCoy LS, Shin D and Tor Y, Angew. Chem. Int. Ed, 2013, 52, 14026–14030. [DOI] [PMC free article] [PubMed] [Google Scholar]
- [7].a) Lin S, Gao W, Tian Z, Yang C, Lu L, Mergny J, Leung C, and Ma D, Chem. Sci, 2015, 6, 4284–4290 [DOI] [PMC free article] [PubMed] [Google Scholar]; b) Hori Y, Otomura N, Nishida A, Nishiura M, Umeno M, Suetake I, and Kikuchi K, J. Am. Chem. Soc, 2018, 140, 1686–1690 [DOI] [PubMed] [Google Scholar]; c) Collot M, Fam TK, Ashokkumar P, Faklaris O, Galli T, Danglot L, and Klymchenko AS, J. Am. Chem. Soc, 2018, 140, 5401–5411 [DOI] [PubMed] [Google Scholar]; d) Vellaisamy K, Li G, Ko C, Zhong H, Fatima S, Kwan H, Wong C, Kwong W, Tan W, Leung C, Ma D, Chem. Sci, 2018, 9, 1119–1125 [DOI] [PMC free article] [PubMed] [Google Scholar]; e) Wang W, Wu C, Yang C, Li G, Han Q, Li S, Lee SM, Leung C, Ma D, Sens. Actuator B-Chem, 2018, 255, 1953–1959 [Google Scholar]; f) Wang M, Mao Z, Kang T, Wong C, Mergny J, Leung C, Ma D, Chem. Sci, 2016, 7, 2516–2523. [DOI] [PMC free article] [PubMed] [Google Scholar]
- [8].Cristalli G, Costanzi S, Lambertucci C, Lupidi G, Vittori S, Volpini R and Camaioni E, Med. Res. Rev, 2001, 21, 105–128. [DOI] [PubMed] [Google Scholar]
- [9].Glazer RI, Cancer Chemother. Pharmacol, 1980, 4, 227–235. [DOI] [PubMed] [Google Scholar]
- [10].O’Dwyer PJ, Wagner B, Leyland-Jones B, Wittes RE, Cheson BD and Hoth DF, Ann. Intern. Med, 1988, 108, 733–743. [DOI] [PubMed] [Google Scholar]
- [11].(a) Sprecher CA and Johnson WC, Biopolymers, 1977, 16, 2243–2264 [DOI] [PubMed] [Google Scholar]; (b) Callis PR, Ann. Rev. Phys. Chem, 1983, 34, 329–357 [Google Scholar]; (c) Peon J and Zewail AH, Chem. Phys. Lett, 2001, 348, 255–262 [Google Scholar]; (d) Onidas D, Markovitsi D, Marguet S, Sharonov A and Gustavsson T, J. Phys. Chem. B, 2002, 106, 11367–11374 [Google Scholar]; (e) Cohen B, Crespo-Hernández CE, Kohler B, Crespo-Hernandez CE and Kohler B, Faraday Discuss, 2004, 127, 137–147. [DOI] [PubMed] [Google Scholar]
- [12].Rovira AR, Fin A and Tor Y, J. Am. Chem. Soc, 2015, 137, 14602–14605. [DOI] [PMC free article] [PubMed] [Google Scholar]
- [13].Rovira AR, Fin A and Tor Y, Chem. Sci, 2017, 8, 2983–2993. [DOI] [PMC free article] [PubMed] [Google Scholar]
- [14].(a) Lakowicz JR, Principles of fluorescence spectroscopy, 3rd Edition, Springer, New York, 2006, 63–97 [Google Scholar]; (b) Valeur B, Molecular Fluorescence, Principles and Applications, Wiley-VCH, Weinheim, 2002, 273–378. [Google Scholar]
- [15].Ford H, Dai F, Mu L, Siddiqui MA, Nicklaus MC, Anderson L, Marquez VE and Barchi JJ, Biochemistry, 2000, 39, 2581–2592. [DOI] [PubMed] [Google Scholar]
- [16]. See supporting information.
- [17].Johnson KA and Goody RS, Biochemistry, 2011, 50, 8264–8269. [DOI] [PMC free article] [PubMed] [Google Scholar]
- [18].(a) Cristalli G, Eleuteri A, Vittori S, Volpini R, Camaioni E and Lupidi G, Drug Dev. Res, 1993, 28, 253–258 [Google Scholar]; (b) Cristalli G, Vittori S, Eleuteri A, Volpini R, Camaioni E, Lupidi G, Mahmood N, Bevilacqua F and Palù G, J. Med. Chem, 1995, 38, 4019–4025 [DOI] [PubMed] [Google Scholar]; (c) Antonini I, Cristalli G, Franchetti P, Grifantini M, Martelli S, Lupidi G and Riva F, J. Med. Chem, 1984, 27, 274–278 [DOI] [PubMed] [Google Scholar]
- [19].Maiti M, Michielssens S, Dyubankova N, Maiti M, Lescrinier E, A. C. and P. H., Chem. A Eur. J, 2012, 18, 857–868. [DOI] [PubMed] [Google Scholar]
- [20].Cristalli G, Grifantini M, Vittori S, Balduini W and Cattabeni F, Nucleotides and Nucleosides, 1985, 4, 625–639. [Google Scholar]
- [21].Yung-Chi C and Prusoff WH, Biochem. Pharmacol, 1973, 22, 3099–3108. [DOI] [PubMed] [Google Scholar]
Associated Data
This section collects any data citations, data availability statements, or supplementary materials included in this article.