Abstract
The rostromedial tegmental nucleus (RMTg), also known as the tail of the ventral tegmental area (tVTA), is a GABAergic structure identified in 2009 that receives strong inputs from the lateral habenula and other sources, sends dense inhibitory projections to midbrain dopamine (DA) neurons, and plays increasingly recognized roles in aversive learning, addiction, and other motivated behaviors. In general, little is known about the genetic identity of these neurons. However, recent work identified the transcription factor FoxP1 as enhanced in the mouse RMTg (Lahti et al. 2016). Hence, in the current study, we used RNA sequencing to identify genes significantly enhanced in the rat RMTg as compared to adjacent VTA, and then examined the detailed distribution of two genes in particular, prepronociceptin (Pnoc) and FoxP1. In rats and mice, both Pnoc and FoxP1 were expressed at high levels in the RMTg and colocalized strongly with previously established RMTg markers. FoxP1 was particularly selective for RMTg neurons, as it was absent in most adjacent brain regions. We used these gene expression patterns to refine the anatomic characterization of RMTg in rats, extend this characterization to mice, and show that optogenetic manipulation of RMTg in mice bidirectionally modulates real-time place preference. Hence, RMTg neurons in both rats and mice exhibit distinct genetic profiles that correlate with their distinct connectivity and function.
Keywords: tVTA, VTA, dopamine, prepronociceptin, FoxP1
INTRODUCTION
Multiple research groups from 2005 to 2009 described a distinct cluster of GABAergic neurons in the ventral midbrain that receives a major input from the lateral habenula (LHb) and strongly innervates midbrain dopamine (DA) neurons (Jhou 2005; Jhou et al. 2009a; Kaufling et al. 2009; Perrotti et al. 2005). This structure has been designated the rostromedial tegmental nucleus (RMTg), or tail of the ventral tegmental area (tVTA), and was also distinguished by its high expression of mu opioid receptor immunoreactivity and marked psychostimulant-induced activation of the immediate early gene c-Fos (Balcita-Pedicino et al. 2011; Jhou et al. 2009a; Jhou et al. 2009b; Lavezzi et al. 2010; Lavezzi and Zahm 2011; Jhou 2005; Barrot et al. 2012; Kaufling et al. 2009; Perrotti et al. 2005). Functional studies show that activation of the RMTg exerts a profound inhibitory influence on midbrain DA neurons (Hong et al. 2011; Kaufling and Aston-Jones 2015; Jalabert et al. 2011; Bourdy et al. 2014; Lecca et al. 2012), and that lesion or inactivation of the RMTg disinhibits DA neuron firing (Bourdy et al. 2014; Jalabert et al. 2011). Further, mu opioid agonists, which inhibit the RMTg and disinhibit DA neurons, are avidly self-administered into the RMTg (Jhou et al. 2012; Matsui et al. 2014; Matsui and Williams 2011; Lecca et al. 2011; Lecca et al. 2012; Jalabert et al. 2011).
Consistent with the strong inhibitory influence of the RMTg on DA neurons, many RMTg neurons in rats and non-human primates display firing patterns inverse to those of DA neurons: they are inhibited by rewards and reward-predictive stimuli, and activated by aversive stimuli and their predictors, as well as unexpected omission of reward (Hong et al. 2011; Jhou et al. 2009a). These response patterns are consistent with the RMTg playing roles in locomotor inhibition and aversion learning, which appear to oppose DA roles in locomotor activation and reward learning. For example, temporary inactivation or lesion of the RMTg increases locomotor activity (Bourdy et al. 2014; Lavezzi et al. 2015; Vento et al. 2017), and greatly impairs learning and/or expression of behaviors associated with fear, anxiety, and pain, as well as cocaine’s aversive effects (Jhou et al. 2009a; Jhou et al. 2012; Jhou et al. 2013). Recent studies found that RMTg lesion or inactivation of RMTg terminals in the VTA led to profound resistance to punishment, inducing rats to continue responding for rewards despite also receiving strong aversive outcomes (Vento et al. 2017). Finally, RMTg has been implicated in suppression of drug seeking, as RMTg inhibition increased reinstatement of extinguished cocaine seeking (Huff and LaLumiere 2015) and ethanol seeking (Sheth et al. 2016), and increased ethanol consumption (Fu et al. 2016).
Despite these increasingly recognized roles for the RMTg in motivated behavior, little is known about the genetic and neurochemical identities of RMTg neurons, leaving major gaps in our understanding of the functional role of these neurons. Research into RMTg function is further complicated by its lack of clear cytoarchitectural boundaries in Nissl-stained tissue, making its identification heavily reliant on other histochemical indicators such as GABAergic markers, retrograde labeling from the VTA, and psychostimulant-induced c-Fos. However, each of these current RMTg markers has notable limitations. For example, although RMTg neurons express GABAergic markers, so do many neurons immediately adjacent to the RMTg, including in the VTA, and regions just lateral, caudal, and rostral to the RMTg. Furthermore, retrograde labeling from the VTA requires precise stereotaxic injections, which are technically challenging and often hard to reproduce precisely. Even when successful, VTA retrograde tracing does not distinguish the RMTg from adjacent neurons within the VTA itself, nor from neurons in the pedunculopontine nucleus (PPTg), which also innervate the VTA (Oakman et al. 1995). Finally, psychostimulant-induced c-Fos robustly identifies the RMTg in rats, but is also present outside the RMTg and labels only about half of neurons within the RMTg (Geisler et al. 2008). Because all 3 markers label some non-RMTg neurons (albeit to varying degrees), the most definitive delineations of the RMTg so far have come from analyzing conjunctions of 2 or more markers, which are more selective than any single marker (Jhou et al. 2009b). However, these combinations are technically challenging, often incompatible with other experimental manipulations, and have not been characterized extensively in species other than rats.
To address the paucity of genetic markers of the RMTg, we evaluated a transcription factor previously identified in the mouse RMTg: FoxP1 (Lahti et al. 2016). We also used RNA sequencing (RNA-seq) to screen for mRNA enriched in the RMTg vs adjacent VTA in rats, identifying Pnoc as a particularly enriched gene. Pnoc encodes prepronociceptin, the precursor for the peptide nociceptin (also called orphanin FQ), which has been implicated in aversive processing and inhibition of DA neurons (Toll et al. 2016). Using a range of histochemical methods, we confirmed that both FoxP1 and Pnoc colocalize strongly with previously established RMTg markers in both rats and mice, and both were present at much lower levels in the VTA. FoxP1 provided a particularly sharp delineation of the RMTg relative to adjacent brain regions, thus helping to refine the anatomic definitions of rat RMTg and extend this definition to mice. Finally, we used these neuroanatomical landmarks to guide behavioral studies in mice and demonstrate a functional role for this neuronal population in affective encoding.
MATERIALS AND METHODS
Animals
Male Sprague Dawley rats (initial weight 250–300 g) were obtained from Charles River (Raleigh, NC, USA) and pair housed. Transgenic Pnoc-ires-Cre mice were bred at the Medical University of South Carolina (MUSC) after obtaining male and female founders from Washington University in St. Louis (generous gift of Michael Bruchas). Transgenic Vgat-ires-Cre mice (Slc32a1tm2(cre)Lowl) and Ai6 reporter mice (Gt(ROSA)26Sortm6(CAG-ZsGreen1)Hze) were obtained from Jackson Laboratory (cat# 016962 and 007906). For anatomical studies, Pnoc-ires-Cre and Vgat-ires-Cre mice were crossed to Ai6 reporter mice, resulting in offspring that expressed a fluorescent reporter gene (ZsGreen) in cells expressing Pnoc (referred to as Pnoc::ZsGreen mice) or Vgat (referred to as Vgat::ZsGreen mice). Mice were group housed, and only male mice were used for experiments.
All animals were housed in a temperature- and humidity-controlled facility at MUSC accredited by the Association for Assessment and Accreditation of Laboratory Animal Care. Animals had ad libitum food and water access. All experiments were in accordance with the Guide for the Care and Use of Laboratory Animals, and were approved by the Institutional Animal Care and Use Committee at MUSC.
Stereotaxic surgery
Rats and mice that received intracranial injections and/or implants were anesthetized via inhaled isoflurane (5% induction, 1–3% maintenance), placed into a stereotaxic apparatus, and administered the analgesic ketoprofen (5 mg/kg). Intracranial injections were made using a pulled glass micropipette and Nanoject II injector (Drummond Scientific Co., Broomall, PA); injections were allowed to diffuse for 5 min prior to retracting glass pipet injector. The retrograde tracer cholera toxin B (CTB, 0.2% dissolved in 0.9% saline, List Biologicals) was injected unilaterally in the VTA of rats (50–100 nl, AP −5.6, ML +1.9, DV −7.6 from dura, 10° angle) or mice (25–50 nl, AP −3.1, ML +1.3, DV −4.8 from dura, 10° angle). In some rats, the retrograde tracer Fluoro-Gold (FG, 1% in saline, Fluorochrome) was also injected unilaterally into substantia nigra pars compacta (SNc, 72 nl, AP −5.4, ML +2.0, DV −7.5 from dura, 10° angle). For anterograde tracing purposes, some mice also received injections of rAAV2-hSyn-hChR2(H134R)-mCherry unilaterally into the lateral habenula (LHb, 250–500 nl, AP −1.7, ML +1.0, DV −3.2 from dura, 10° angle).
For optogenetic behavioral studies, Vgat-ires-Cre transgenic mice received bilateral injections of virus driving expression of stop-floxed channel rhodopsin (ChR2; AAV2-EF1a-DIO-hChR2(H134R)-mCherry) or stop-floxed archaerhodopsin (ArchT; AAV5-flex-ArchT-GFP) into the RMTg (250–500 nl, AP −4.1, ML +1.1, DV −4.75 from dura, 10° angle). All viruses were obtained from the Vector Core at the University of North Carolina. In the same surgery, the mice were implanted bilaterally with chronic indwelling optic fibers (50-μm core) aimed at the VTA (AP −3.1, ML +1.3, DV −4.8 from dura, 10° angle). Ceramic or metal ferrules (1.25-mm outer diameter, 62.5-μm bore, Fiberoptics4Sale) containing the optic fibers (Thor Labs, Newton, NJ) were affixed to the skull using bone screws and dental acrylic. For behavioral studies, animals began testing at least 3 weeks after AAV injections to allow for functional expression levels. For anatomy studies, animals were sacrificed at least 3 days after CTB and at least 2 weeks after AAV injections.
Psychostimulant-induced c-Fos
Rats and mice were given cocaine (10–20 mg/kg, i.p.) or amphetamine (1 mg/kg, i.p.) 60–120 min prior to sacrifice. Cocaine was provided courtesy of the NIDA Drug Supply Program.
Sacrifice and tissue collection
For immunohistochemistry (IHC) and in situ hybridization (ISH), animals were deeply anesthetized via inhaled isoflurane and perfused transcardially with 0.9% NaCl and 10% neutral buffered formalin. Rats were perfused via a peristaltic pump (NaCl at 55 ml/min for 90 sec, fixative at 55 ml/min for 60 sec, 30 ml/min for 120 sec). Mice were perfused via a syringe (4 ml NaCl, 20 ml fixative, ~10 ml/min). Brains were removed, post-fixed overnight at 4 °C, and transferred to 20% sucrose in PBS for at least 2 days prior to freezing and sectioning on a cryostat at 40 μm (20 μm was used for some ISH experiments). Free-floating sections were stored at 4 °C in PBS with sodium azide (0.01%). Sections to be used for ISH were stored in cryoprotectant at −20 °C.
For RNAscope and RNA-seq, rats were rapidly decapitated, brains were frozen and cut into 40-μm sections (for RNAscope) or 60-μm sections (for RNA-seq), and tissue was mounted on glass slides. For RNA-seq, tissue was stained in 0.25% cresyl violet in 13mM acetic acid to visualize anatomical landmarks to aid in dissection, which was performed directly on the slides using a scalpel to scrape the desired tissue regions into microcentrifuge tubes for RNA extraction. VTA samples were obtained from sections rostral to the entirety of the interpeduncular nucleus (IPN), while RMTg samples were dissected bilaterally from regions just dorsolateral to the caudal half of the IPN, as outlined previously (Jhou 2005; Jhou et al. 2009a; Kaufling et al. 2009; Perrotti et al. 2005).
Immunohistochemistry (IHC)
Free-floating coronal brain sections were incubated overnight at room temperature (RT) in one of the following primary antibodies: goat anti-cholera toxin B (CTB, 1:50K, cat# 703, List Biological), mouse anti-tyrosine hydroxylase (TH, 1:10K, cat# MAB5280, Millipore Inc.), rabbit anti-c-Fos (1:20K, cat# PC38, Millipore Inc.), rabbit anti-FoxP1 (1:20K, cat# ab16645, Abcam), rabbit anti-GFP (1:50K, cat# AB290, Abcam), rabbit anti-neuronal nitric oxide synthase (nNOS, 1:1000, AB5380, Millipore), or mouse anti-NeuN (1:5K, cat# MAB-377, Millipore). Antibodies were diluted in phosphate-buffered saline (PBS) with 0.25% Triton X-100 (Sigma-Aldrich). Following each incubation step, tissue was rinsed 3 times in PBS for 1 min each.
For DAB visualization, tissue was incubated 30 min in biotinylated secondary antibody (donkey anti-goat, anti-mouse, or anti-rabbit, 1:1000, Jackson Immunoresearch), followed by 1 h in Vectastain Elite ABC (1:500, Vector Labs). The reaction was visualized with 0.025% 3,3’-diaminobenzidine tetrahydrochloride (DAB, cat# D5637, Sigma-Aldrich) and 0.015% hydrogen peroxide in PBS for 10 min, resulting in a brown reaction product. In some cases, 0.05% nickel ammonium sulfate was added to the final step to darken the reaction product.
For fluorescent visualization of antigens in red or green, sections were incubated 1 h in biotinylated secondary antibody and then incubated 30 min in streptavidin conjugated to Alexa Fluor 594 or Alexa Fluor 488 (1:500 or 1:1000, Jackson Immunoresearch). In some cases, CTB was visualized in blue using tyramide signal amplification (TSA). In these instances, following incubation in primary antibody, sections were then incubated for 1 h in biotinylated secondary antibody, followed by 1 h in ABC, 10 min in TSA Plus Biotin reagent (1:250, Perkin Elmer), and then 30 min in streptavidin conjugated to DyLight 405 (1:500, Jackson Immunoresearch).
Following staining, sections were mounted onto glass slides. DAB slides were coverslipped with Permount (Fisher). Fluorescent slides were coverslipped with ProLong Gold Antifade (ThermoFisher Scientific), sealed with clear nail polish, and stored at 4 °C.
In situ hybridization (ISH)
Nonradioactive ISH for Pnoc or Gad1 (also known as Gad67) was carried out using previously published methods (Simmons et al. 1989; Margolis et al. 2012). Probes were transcribed from rat Pnoc cDNA (kindly provided by laboratory of Dr. Stanley Watson, University of Michigan) or Gad1 cDNA (nucleotides 1–1782, Accession #NM017007, kindly provided by Dr. Allan Tobin, University of California Los Angeles) (Erlander et al. 1991; Neal et al. 1999). cDNA was linearized with EcoRI-HF restriction enzyme (New England Biolabs), followed by purification via phenol-chloroform extraction. In vitro transcription of digoxigenin (DIG)-labeled antisense RNA probes was carried out using a DIG RNA labeling kit and T3 RNA polymerase (Roche). Free-floating sections were acetylated in 0.25% acetic anhydride in 0.1M triethanolamine (pH 8.0) for 10 min, followed by rinses in PBS. Sections were transferred to 2× saline sodium citrate (SSC) at 55 °C for 20 min, and then placed in hybridization buffer for 1 h at 55 °C. Hybridization buffer consisted of 50% formamide, 20 mM Tris, 1 mM EDTA, 300 mM NaCl, 5% dextran sulfate, 1× Denhardt’s solution, and 0.1% each of sodium thiosulfate and sodium dodecyl sulfate (SDS). Sections were then placed into hybridization buffer containing denatured Pnoc RNA probe (~100 ng/ml), as well as 100 μg/ml salmon sperm DNA and 250 μg/ml each of yeast total RNA and yeast tRNA, for 24-h incubation at 55 °C. After 3 rinses in 2× SSC, sections were placed in post-hybridization stringency washes for 30 min each, consisting of 4× SSC/50% formamide/1% SDS (2 washes at 70 °C), 2× SSC/50% formamide/0.1% SDS (2 washes at 65 °C), 2× SSC/0.1% SDS (one wash at 60 °C), and 0.2× SSC/0.1% SDS (one wash at RT). Mouse sections were exposed to higher stringency washes (as compared to parameters described above for rat sections) by increasing the temperature by 5 °C for each step. Sections were then rinsed in Tris-buffered saline (TBS) 3 times and placed in TBS with 0.3% Triton-X (TBST) and 2% normal donkey serum (NDS) for 1 h. Alkaline phosphatase (AP)-conjugated sheep anti-DIG (1:10K, cat# 11093274910, Roche) was diluted in TBST with 2% NDS for overnight incubation at RT. After rinses in TBS, the DIG signal was visualized with either: a) nitro blue tetrazolium and 5-bromo-4-chloro-3-indolyl-phosphate (NBT/BCIP, Roche) diluted 1:50 in AP buffer (100 mM Tris, 100 mM NaCl, 50 mM MgCl2, pH 9.5 with 0.3% Triton-X, 5% polyvinyl alcohol, and 1 mM levamisole) to yield a purple reaction product, or b) Fast Red (Sigma tablets dissolved in water) to yield a red fluorescent product. Once the color had developed (1–24 h) at 37 °C, sections were rinsed several times in PBS, mounted onto glass slides, and coverslipped with Prolong Gold Antifade.
To combine nonradioactive ISH with IHC, sections were first incubated in primary antibody overnight, biotinylated secondary antibody for 1 h, and fixed in 10% formalin for 20 min, followed by PBS rinses. The ISH procedure was carried out as described above, after which the IHC signal was detected. For fluorescent visualization, sections were incubated in ABC (1:1000) for 45 min, TSA Plus Biotin (1:250) for 10 min, and fluorescent streptavidin (1:500) for 45 min. For DAB, sections were incubated in ABC (1:1000) for 1 hour, followed by the DAB visualization step for 10 min.
Radioactive ISH for Pnoc was carried out as described previously (Wang and Morales 2008, 2009). Briefly, 35S- and 33P-labeled single-stranded antisense probes were transcribed from rat Pnoc cDNA. Sections were incubated in PB containing 0.5% Triton X-100 for 10 min, rinsed twice with PB, treated with 0.2 N HCl for 10 min, rinsed in PB, and then acetylated in 0.25% acetic anhydride in 0.1 M triethanolamine (pH 8.0) for 10 min. Sections were rinsed in PB, post-fixed with 4% formaldehyde for 10 min, rinsed in PB, and then hybridized for 16 h at 55 °C in hybridization buffer (50% formamide, 10% dextran sulfate, 5× Denhardt’s solution, 0.62 M NaCl, 50 mM DTT, 10 mM EDTA, 20 mM PIPES pH 6.8, 0.2% SDS, 250 μg/ml salmon sperm DNA, 250 μg/ml yeast tRNA) containing the antisense probe. Sections were then treated with 4 μg/ml RNase A at 37 °C for 1h, washed with 1× SSC/50% formamide at 55 °C for 1h and 0.1× SSC at 68 °C for 1 h, and then rinsed in TBS. Finally, slides were dipped in Ilford K.5 nuclear tract emulsion (Polysciences, Inc., Warrington; 1:1 dilution in double distilled water) and exposed in the dark at 4 °C for 4 weeks prior to development.
To combine radioactive Pnoc ISH with nonradioactive Gad1 ISH, sections were processed as indicated for single radioactive Pnoc hybridization but the hybridization buffer contained both Pnoc and Gad1 antisense riboprobes. After processing for the DIG signal (via NBT/BCIP), sections were mounted on slides, air dried, dipped in nuclear track emulsion, and exposed for 4 weeks prior to development.
To combine radioactive Pnoc ISH with c-Fos IHC, hybridization occurred first, followed by IHC and visualization via DAB. Then, sections were mounted on slides, air-dried, dipped in nuclear track emulsion, and exposed for 4 weeks prior to development.
RNAscope
mRNA for FoxP1 was visualized using methods previously described (Wang et al. 2012). In brief, frozen unfixed tissue was cut on a cryostat into 20-μm sections and mounted onto SuperFrost Plus slides. Slides were then stored at −80 °C or air-dried at 55 °C for 20 min prior to processing. To digest nucleic acid-associated proteins and quench endogenous peroxidases, slides were treated with the ACD Target Retrieval Reagent (cat# 322000), hydrogen peroxide, and ACD Protease Plus reagent (cat# 322330) according to manufacturer’s instructions (ACD technical note TN320534). To detect rat FoxP1 mRNA, sections were hybridized with RNAscope probe specific for mouse FoxP1 (cat# 485221) via the HybEZ Hybridization System (cat# 310010) for 2 h at 40 °C. The hybridization was amplified and detected using RNAscope 2.5 HD detection reagent-RED (cat# 322360) according to manufacturer’s instructions (ACD user manual document number 322360-USM).
RNA sequencing (RNA-seq)
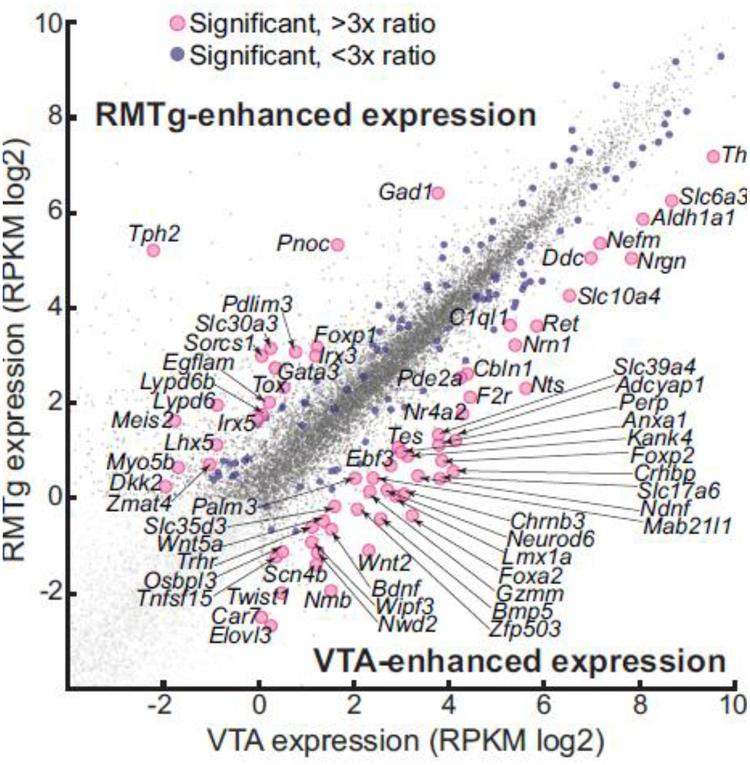
We used RNA-seq to follow up on preliminary mRNA data obtained using microarray (Morales et al. 2011). Tissue from the RMTg and VTA was dissected from 18 rats, and mRNA was extracted using RNAeasy micro kits (Qiagen, Inc). Tissue was pooled from multiple rats if needed to achieve at least 25 ng of mRNA per sample, with 5 resultant samples of extracted mRNA from RMTg and 3 samples from VTA. RNA sequencing (50bp single end reads, 8× multiplexing) and preliminary data analysis (to calculate RPKM and expression levels) was performed by the Genomics and Microarray Core at the University of Texas Southwestern (Dallas, TX). Genes were excluded from consideration if RMTg and VTA expression levels were both below 1.0 RPKM (log = 0.0) (Fig. 5). Expression levels in RMTg versus VTA were compared using t-tests. We adjusted for the possibility of type 1 errors in the multiple comparisons by controlling the false discovery rate at 5% using the Benjamini-Hochberg procedure (Benjamini and Hochberg 1995). A comparison was only considered significant when the p value was less than or equal to (i/m)q, where i is the rank of the p value (when all comparisons are sorted according to ascending p value), m is the total number of comparisons, and q is the false discovery rate. This resulted in significant comparisons when p < 0.000876.
Fig. 5.
RNA-seq comparison of mRNA expression in the RMTg and VTA. More than 22,000 genes were analyzed from RMTg and VTA tissue from rats (n=3–5 pooled samples from 18 rats). Each dot shows the expression levels of a single gene. Most genes showed comparable levels of expression in the RMTg and VTA (gray dots), falling near the y=x line. 169 genes were significantly enhanced in one region relative to the other (medium-sized blue dots), with some of these genes enhanced by more than 3-fold in one region over the other (larger pink dots with gene name labels). Genes were excluded from consideration (very light gray dots) if RMTg and VTA expression levels were both below 1.0 RPKM (log = 0.0). Abbreviations: Adcyap1, adenylate cyclase activating polypeptide 1, a.k.a. pituitary adenylate cyclase activating polypeptide; Aldh1a1, aldehyde dehydrogenase 1 family, member A1; Anxa1, annexin A1; Bdnf, brain derived neurotrophic factor; Bmp5, bone morphogenetic protein 5; C1ql1, complement C1q like 1; Car7, carbonic anhydrase 7; Cbln1, cerebellin 1 precursor; Chrnb3, cholinergic receptor nicotinic beta 3 subunit; Crhbp, corticotropin releasing hormone binding protein; Ddc, DOPA decarboxylase; Dkk2, dickkopf WNT signaling pathway inhibitor 2; Ebf3, early B-cell factor 3; Egflam, EGF like, fibronectin type III and laminin G domain-containing protein; Elovl3, ELOVL fatty acid elongase 3; F2r, coagulation factor II thrombin receptor; Foxa2, forkhead box A2; Foxp1, forkhead box P1; Foxp2, forkhead box P2; Gad1, glutamic acid decarboxylase 1; Gata3, GATA binding protein 3; Gzmm, granzyme M; Irx3, iroquois homeobox 3; Irx5, iroquois homeobox 5; Kank4, KN motif and Ankyrin repeat domains 4; Lhx5, LIM homeobox 5; Lmx1a, LIM homeobox transcription factor 1 alpha; Lypd6, LY6/PLAUR domain containing 6; Lypd6b, Ly6/PLAUR domain containing 6B; Mab21l1, Mab-21 like 1; Meis2, Meis homeobox 2; Myo5b, myosin Vb; Ndnf, neuron derived neurotrophic factor; Nefm, neurofilament medium; Neurod6, neuronal differentiation 6; Nmb, neuromedin B; Nr4a2, nuclear receptor subfamily 4, group A, member 2; Nrgn, neurogranin; Nrn1, neuritin 1; Nts, neurotensin; Nwd2, NACHT and WD repeat domain containing 2; Osbpl3, oxysterol binding protein like 3; Palm3, paralemmin 3; Pde2a, phosphodiesterase 2a; Pdlim3, PDZ and LIM domain 3; Perp, p53 apoptosis effector related to PMP-22; Pnoc, prepronociceptin; Ret, ret proto-oncogene; Scn4b, sodium voltage-gated channel beta subunit 4; Slc10a4, Sodium bile acid cotransporter; Slc17a6, vesicular glutamate transporter 2; Slc30a3, zinc transporter 3; Slc35d3, Solute carrier family 35 member d3; Slc39a4, zinc transporter ZIP4; Slc6a3, dopamine transporter; Sorcs1, sortilin related VPS10 domain containing receptor 1; Tes, tetin LIM domain protein; Th, tyrosine hydroxylase; Tnfsf15, tumor necrosis factor superfamily member 15; Tox, thymocyte selection associated high mobility group box; Tph2, tryptophan hydroxylase 2; Trhr, thyrotropin releasing hormone receptor; Twist1, twist family bHLH transcription factor 1; Wipf3, WAS/WASL interacting protein family, member 3; Wnt2, wingless-type MMTV integration site, family member 2; Wnt5a, wingless-type MMTV integration site family, member 5A; Zfp503, zinc finger protein 503; Zmat4, zinc finger matrin-type 4.
Image acquisition and analysis
Bright-field and fluorescent images were acquired using a digital camera (Canon EOS Rebel T3) mounted on an Olympus BX40 microscope. For counting on full sections, several pictures were taken at 10× or 20× magnification and stitched together in Adobe Photoshop or Microsoft Image Composite Editor. CTB visualized with blue fluorescence was pseudocolored to magenta in Photoshop. Images were then transferred to Adobe Illustrator for marking and counting neurons. Anterior-posterior (AP) coordinates provided in figures are based on the 6th edition of the rat brain atlas from Paxinos and Watson (2007), and the 2nd edition of the mouse brain atlas from Paxinos and Franklin (2001). For radioactive ISH (silver grains), the threshold for “heavy” PNOC expression was set at ⅓ of the average of the 5 most densely labeled cells within RMTg.
Real-time place preference behavior in mice
Real-time place preference testing was conducted in a standard 2-chamber conditioning apparatus (62 cm L × 21 cm W × 21 cm H) that was partially divided by a 5-mm-thick partition in the middle to create 2 visually (black vs. white walls) and texturally (rod vs. grate flooring) distinct environments. Optogenetic stimulation was carried out in Vgat-ires-Cre mice with ChR2 or ArchT expression in RMTg and optical fibers targeting RMTg axon terminals in the VTA, as described above. Real-time place preference was assessed during 6 consecutive test sessions (1 session per day, 15 min per session) in which mice were permitted to freely explore the 2-chamber apparatus. During the first session (baseline), an optical splitter (Precision Fiber Products, Milpitas, CA) was attached to the implanted ferrules for acclimation, but no light was delivered. Over the next 4 sessions, either blue light (447 nm, 5 mW/side, 50 Hz, 5 ms pulse duration, for ChR2 experiments) or green light (532 nm, 5 mW/side, constant, for ArchT experiments) was delivered via computer-controlled lasers (Dragon Lasers, Changchun, China) that were programmed to turn on when the mouse fully entered the light-paired chamber, and turn off when the mouse exited the light-paired chamber (Med-Associates, St. Albans, VT). The light-paired chamber was determined for each individual animal using a biased design, such that RMTg excitation was paired with the chamber initially preferred under baseline conditions, while RMTg inhibition was paired with the chamber that was least preferred at baseline. On the final test session, no light was delivered. Place preference data were normalized to baseline values for each mouse, and analyzed via 2-way ANOVA with Sidak’s multiple comparisons post hoc analysis.
RESULTS
Characterization of FoxP1 in rat RMTg
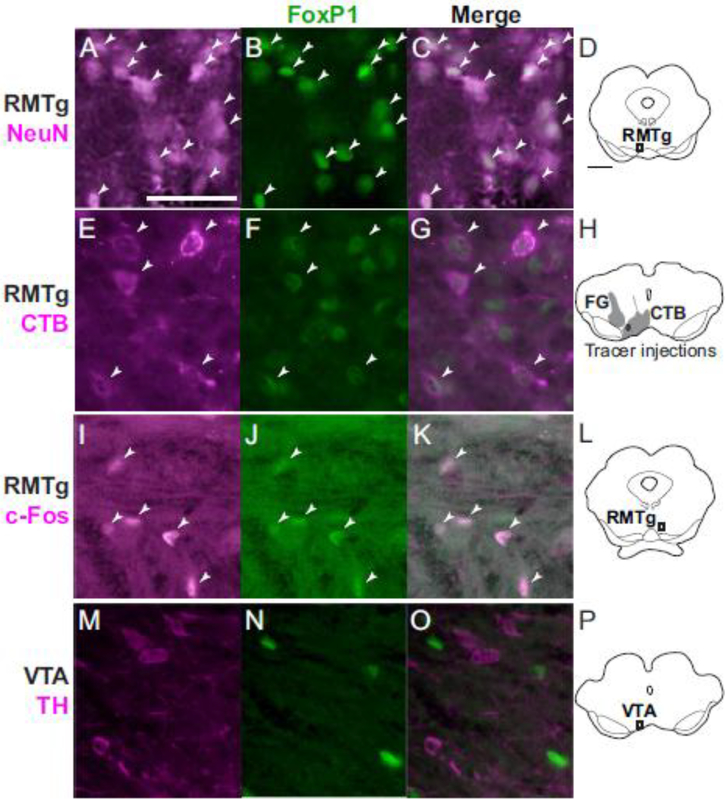
FoxP1 mRNA was previously reported in the embryonic mouse RMTg, and FoxP1 protein was observed in the RMTg of adult mice (Lahti et al. 2016), but it was unknown whether its distribution in rat RMTg corresponds with previous anatomical characterizations. Hence, we examined FoxP1 distribution in rat tissue, using IHC to detect protein and RNAscope to detect mRNA. IHC and RNAscope in rats showed nearly identical anatomical distributions of FoxP1 protein and mRNA in widespread brain regions, similar to the distribution in mice observed in the Allen Mouse Brain Atlas (Lein et al. 2007). Furthermore, protein and mRNA were both detected in a distinct cluster of neurons strikingly resembling previous descriptions of the RMTg. Within this putative RMTg-like cluster, FoxP1 immunoreactivity (FoxP1-IR) was present in almost all neurons, as evidenced by the nearly complete colocalization of FoxP1 label with immunoreactivity for the neuronal marker NeuN (Fig. 1a–d). Additional double-label experiments also showed extensive colocalization of FoxP1-IR with 2 previously described RMTg markers: CTB retrograde labeling from VTA (Fig. 1e–h), and cocaine-induced c-Fos expression (Fig. 1i–l). Colocalization was extensive not only at the single-cell level, but also more broadly in that the boundaries outlining regions where CTB and c-Fos were most dense closely matched the boundaries where FoxP1 was most dense.
Fig. 1.
Representative photos of FoxP1-immunoreactive neurons, other neuronal markers, and merged images from rats. a-d. In the RMTg, FoxP1 is present in almost all neurons identified via NeuN staining (images are from region shown in d). e-h. In the RMTg, most neurons labeled with retrograde CTB from VTA also express FoxP1 (injection sites for CTB and FG in h). i-l. In the RMTg, cocaine-induced c-Fos colocalizes strongly with FoxP1 (images are from region shown in l). m-p. In the VTA, FoxP1 is absent in almost all TH neurons (images are from region shown in p). Scalebar for images = 100 μm for a-c and i-k, and 50 μm for e-g and m-o. Scalebar for drawings (d,h,l,p) = 1mm.
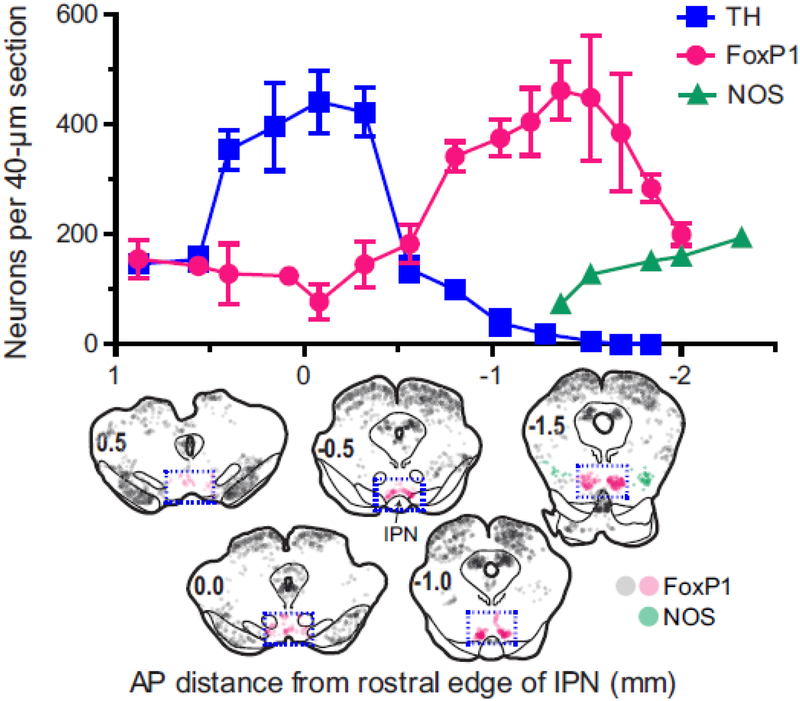
In contrast, FoxP1-IR neurons were less numerous in most regions adjacent to the RMTg. Rostral to the RMTg, in the adjacent VTA, FoxP1-IR neurons were much sparser than in the RMTg, and FoxP1 colocalized only rarely with TH expression (Fig. 1m–p). Overall, FoxP1-IR neurons in the midbrain were most dense in a region 1.0–1.5 mm caudal to the rostral edge of the IPN (Fig. 2), caudal to most dopaminergic neurons of the VTA, medial to cholinergic neurons of PPTg (expressing NOS), and overlapping the decussating fibers of the superior cerebellar peduncle (xscp) and the ventral tegmental decussation (vtgx) (Fig. 2, 3a–g). Because of the close overlap of FoxP1-IR, at both cellular and structural levels, with multiple markers of the RMTg, we will henceforth refer to the FoxP1 cluster as RMTg, dropping the “putative” qualification. Outside of the FoxP1 cluster in RMTg, other midbrain groups of FoxP1-IR neurons were also visible, particularly in the periaqueductal gray (PAG), superior colliculi, and nuclei of the lateral lemniscus (NLL) (Fig. 3a–g). However, these regions were spatially separated from each other, allowing the RMTg cluster of FoxP1 labeling to stand out prominently from its surroundings. Occasional FoxP1-IR neurons were scattered sparsely between these major cell groups, but without coalescing into distinct nuclei. Notably, the RMTg FoxP1 cluster showed surprisingly sharp lateral and caudal boundaries, as well as a dorsomedial elongation (Fig. 3, 4) not described in previous RMTg anatomical studies. For example, when we drew a boundary around the FoxP1-dense cluster (n=1), 91% of NeuN neurons within this boundary expressed FoxP1, versus only 3% of NeuN neurons immediately lateral to it.
Fig. 2.
Distribution of FoxP1 neurons across the rostrocaudal axis of the ventral midbrain, as compared to the distribution of dopamine (TH-expressing) and PPTg acetylcholine (NOS-expressing) neurons in rats. Graph shows number of neurons immunoreactive for FoxP1, TH, and NOS in 40-μm coronal sections at specific anterior-posterior (AP) distances based on the rostral edge of the interpeduncular nucleus (IPN). Corresponding AP distances based on bregma would be: −5.0, −5.5, −6.0, −6.5, and −7.0. Brain sections show distribution of FoxP1 and NOS neurons at representative AP levels. FoxP1 and TH neurons were counted within the blue rectangular dashed outline; NOS neurons were counted outside the rectangular outline.
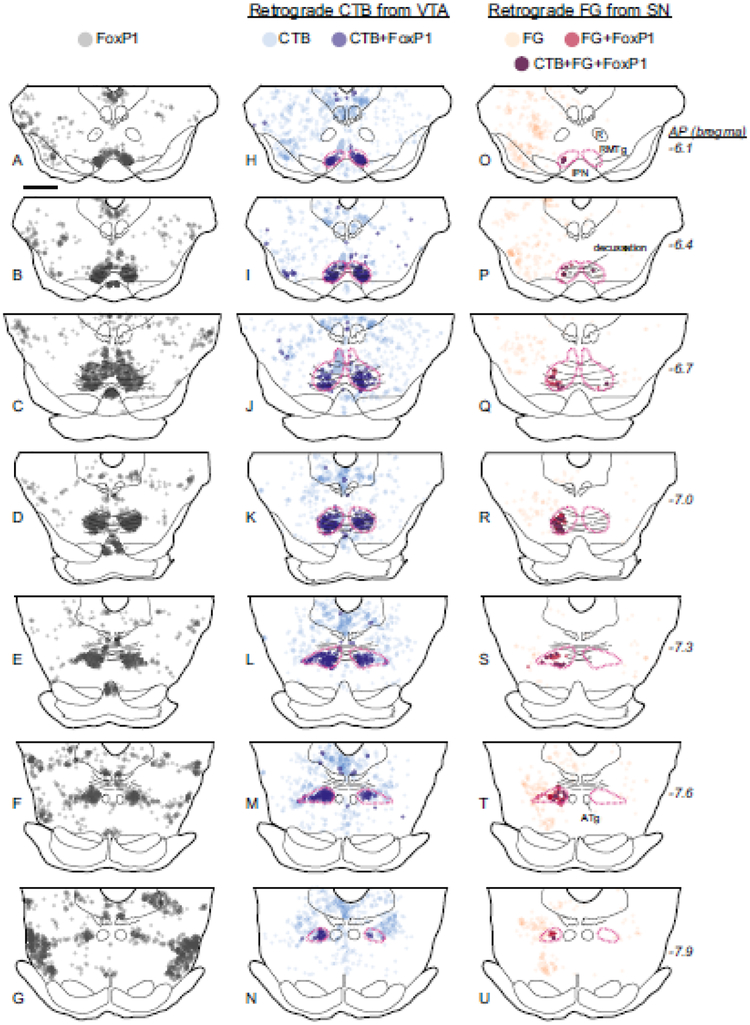
Fig. 3.
FoxP1 neurons in the RMTg, but not other midbrain regions, project to the VTA and SNc in rats. a-g. FoxP1 is found throughout the midbrain, but is particularly dense in a region closely matching previous descriptions of the RMTg (each circle = 1 cell). h-n. Neurons labeled with retrograde tracer (CTB) from the VTA (injection site in Fig. 1h) are found throughout the midbrain, but particularly in the FoxP1-dense region, where neurons double-labeled for FoxP1 and CTB are abundant. Magenta dashed lines indicate the RMTg. Translucent blue shows location where heavy CTB fiber expression precluded accurate neuronal labeling. o-u. Neurons labeled with a retrograde tracer (FG) from the SNc (injection site in Fig. 1h) are also found throughout midbrain, although neurons double-labeled for FoxP1 and FG are prominent in the lateral extent of the RMTg. Neurons triple-labeled for FoxP1, CTB, and FG are also shown. Anatomical landmarks are noted, including the red nucleus (R), interpeduncular nucleus (IPN), superior cerebellar and ventral tegmental decussation, and anterior tegmental nucleus (ATg). Scalebar = 1 mm.
Fig. 4.
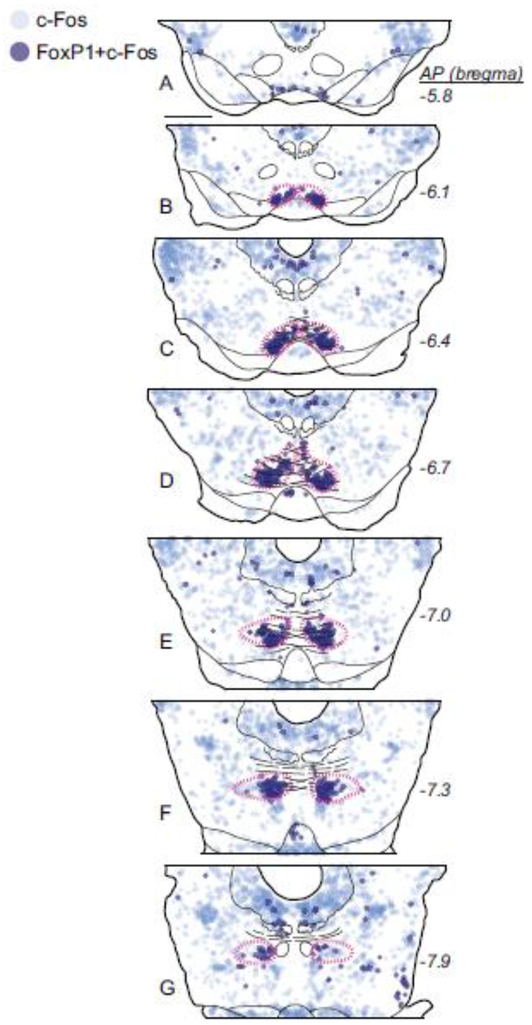
FoxP1 colocalizes with cocaine-induced c-Fos in rats. Cocaine-induced c-Fos expression is present throughout the midbrain, but is particularly dense in the RMTg (magenta dashed outline). Neurons double-labeled for c-Fos and FoxP1 are densest within the RMTg. Scalebar = 1 mm.
Detailed colocalization of FoxP1 with previously established RMTg markers in rat
After assessing FoxP1 qualitatively, we next performed more quantitative experiments assessing the detailed colocalization of FoxP1 with previous markers of the RMTg. We injected CTB into the VTA of 8 rats, and obtained 3 cases in which tracer was almost entirely confined to the VTA, with minimal spread outside the VTA. In all 3 cases, CTB-labeled neurons were prominent in a bilateral cluster in the RMTg with an ipsilateral predominance, consistent with prior reports (Jhou et al. 2009b; Kaufling et al. 2009). As noted above, the clusters of dense CTB labeling corresponded closely with the bilateral cluster of FoxP1 expression (Fig. 3h–n). Within the FoxP1-dense RMTg region (magenta dashed outlines in Fig. 3), 83 ± 4% (n=3, mean ± S.E.M.) of CTB-labeled cells expressed FoxP1, with this percentage being consistently high (ranging from 80–88%) across all rostro-caudal levels of the RMTg (Fig. 3h–n). Outside of the RMTg, scattered CTB and FoxP1 cells were both present, but the degree of colocalization was strikingly lower, with only 4.5 ± 1.7% (n=3) of CTB-labeled cells expressing FoxP1.
The converse proportion, of FoxP1-IR cells expressing CTB, was also strikingly higher in the RMTg than adjacent regions (39 ± 7% vs 3.7 ± 0.2%). In contrast to the uniformly high proportion of CTB cells expressing FoxP1, this proportion of FoxP1 neurons expressing CTB varied more widely across the 3 individual cases (range 31–55%) in parallel with the variable sizes of the tracer injections themselves. For example, the smallest of the 3 injections (case B177) occupied only a small portion of the dorsal VTA (dark grey injection site in Fig. 1h) and produced an average of 32 labeled cells per section in the RMTg, comprising 31% of ipsilateral RMTg FoxP1-IR neurons, while the largest injection (case C110) filled the VTA (light grey CTB injection site in Fig. 1h) and produced an average of 84 cells per section in the RMTg, comprising 55% (268/491) of FoxP1 neurons. In the latter injection, CTB was also observed in 27% (286/1050) of contralateral FoxP1 neurons. Case C110 also received a second retrograde tracer injection of Fluoro-Gold (FG) centered on the medial SNc (Fig. 1h) in order to compare the distribution of VTA-projecting with medial SNc-projecting neurons (Fig. 3o–u). Medial SNc projecting neurons constituted 21% (101/491) of RMTg FoxP1 neurons, of which only a minority (8.6% of the total, or 42/491) were triple-labeled for FG, CTB, and FoxP1, i.e., projected to both the VTA and SNc. Hence, most (59/101 = 58%) medial SNc-projecting neurons and most VTA-projecting neurons (226/268 = 84%) projected to only 1 of these 2 targets. Overall, 67% (327/491) of ipsilateral RMTg FoxP1-IR neurons projected to one or both of the VTA or medial SNc, indicating that a majority of the RMTg exerts influence on the dopaminergic system, albeit not necessarily the exact same DA neurons. Notably, SNc-projecting neurons were preferentially found in lateral and caudal portions of the RMTg (Fig. 3q–t), in contrast to VTA-projecting neurons which showed no subregional preference.
A second marker of RMTg neurons, cocaine-induced c-Fos, colocalized strongly with FoxP1 in the midbrain (Fig. 4). We found that 30 ± 4% of FoxP1-IR neurons within the RMTg (magenta dashed outlines) expressed cocaine-induced c-Fos, versus only 9 ± 6% of FoxP1 midbrain neurons outside of the RMTg (n=3). Conversely, the vast majority of c-Fos positive cells in the RMTg also expressed FoxP1 (84 ± 5%), versus only 4 ± 2% outside. Notably, in all 3 cases, the percentage of FoxP1 neurons expressing c-Fos was higher at rostral levels (37–40% in panels Fig. 4b–c) than at more caudal levels (17–25% in Fig. 4e–g), further indicating that when taken alone, c-Fos is neither a comprehensive nor uniform marker for identifying the full extent of the RMTg.
Analysis of rat RMTg mRNA
To identify other candidate genes enriched in the RMTg, we performed RNA-seq on mRNA extracted from the RMTg and VTA. Using a false discovery rate (FDR) of 5%, we identified 169 candidate genes that were significantly different in their expression in RMTg samples compared to VTA samples (Fig. 5; see all significant genes in Online Resource 1). Among these, 69 were enhanced in the RMTg, while 100 were enhanced in the VTA. Among the 69 RMTg-enhanced genes, 19 of them showed at least a 3-fold enhancement versus the VTA (Fig. 5), including Gad1 (also known as Gad67), as well as Foxp1, the subject of the first portion of this study. One additional gene, Tph2 (encoding tryptophan hydroxylase 2), also showed enhanced expression in RMTg tissue samples, but this most likely arose from dissections extending slightly into the immediately adjacent median raphe nucleus, a region highly enriched in serotonin neurons, as serotonin neurons are not numerous within the RMTg itself (Lein et al. 2007). One additional gene, Pnoc, encodes the propeptide for nociceptin (a.k.a. orphanin FQ), and we selected it for further investigation due to its known involvement in reward, pain, anxiety, and inhibition of dopamine release (Toll et al. 2016; Morales et al. 2011).
Characterization of Pnoc in rat RMTg
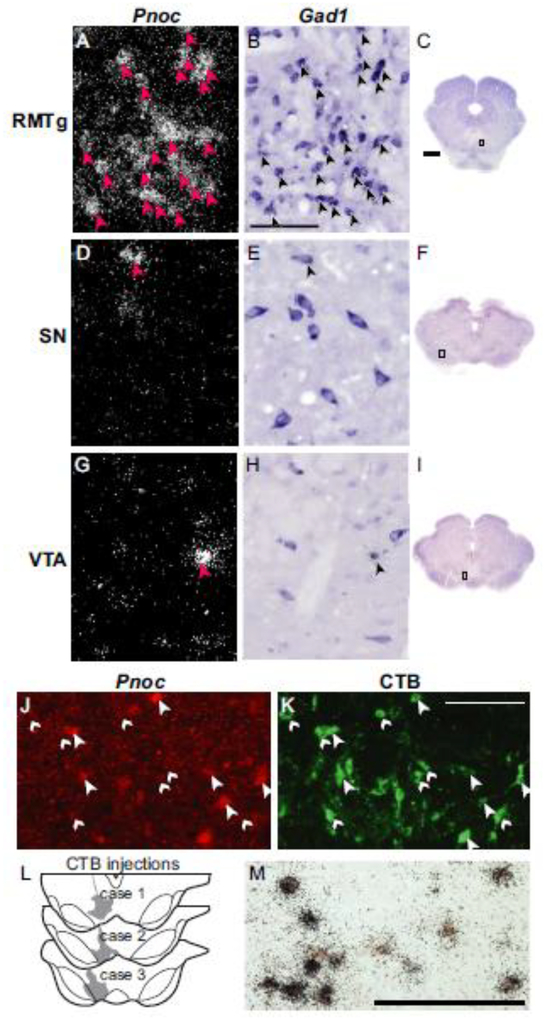
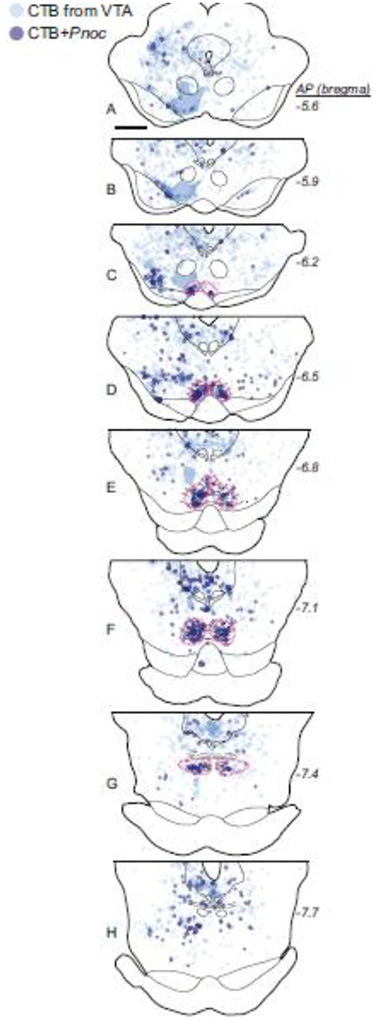
Using double-label ISH, or ISH combined with IHC, we found that Pnoc expression colocalized strongly with previously identified RMTg markers. Double-label ISH showed that Pnoc colocalized with Gad1 mRNA in the RMTg, but not the adjacent SN or VTA (Fig. 6a–i). Further, Pnoc expression in the RMTg colocalized with retrograde CTB labeling from VTA (Fig. 6j–l) and with psychostimulant-induced c-Fos expression (Fig. 6m). In rats given injections of CTB into the VTA (injection sites shown in Fig. 6l), 55 ± 6% (n=3) of CTB-labeled neurons in the RMTg expressed Pnoc mRNA (Fig. 7). In other midbrain regions, this percentage was lower. For example, only 4 ± 2% of CTB-labeled cells in the periaqueductal gray expressed Pnoc.
Fig. 6.
Representative photos of Pnoc expression in rats, as compared to Gad1, CTB, and c-Fos labeling. a-i. In the RMTg (a-c), most Gad1 neurons express Pnoc, whereas in the SN (d-f) or VTA (g-i), most Gad1 neurons lack Pnoc. In these images, Pnoc is radiolabeled ISH and Gad1 is DIG-labeled ISH. Images are from the regions shown in c, f, and i. j-l. Pnoc expression (via DIG-labeled ISH and Fast Red fluorescence) colocalizes with retrograde CTB labeling from the VTA (CTB injection sites in l). Large arrowheads indicate CTB cells that also express Pnoc mRNA, while small arrowheads indicate CTB cells lacking Pnoc mRNA signal. m. Pnoc expression (via radiolabeled ISH) also colocalizes with amphetamine-induced c-Fos protein expression (via brown DAB label). Scalebars = 1 mm for c,f,i and 100 μm for all other images.
Fig. 7.
Pnoc neurons in the RMTg project to the VTA in rats. Neurons with CTB retrograde labeling from the VTA are located throughout the midbrain. CTB neurons co-labeled with Pnoc mRNA are especially concentrated in the RMTg (magenta dashed outlines). Translucent blue shows location where heavy CTB fiber expression precluded accurate neuronal labeling. Scalebar = 1 mm.
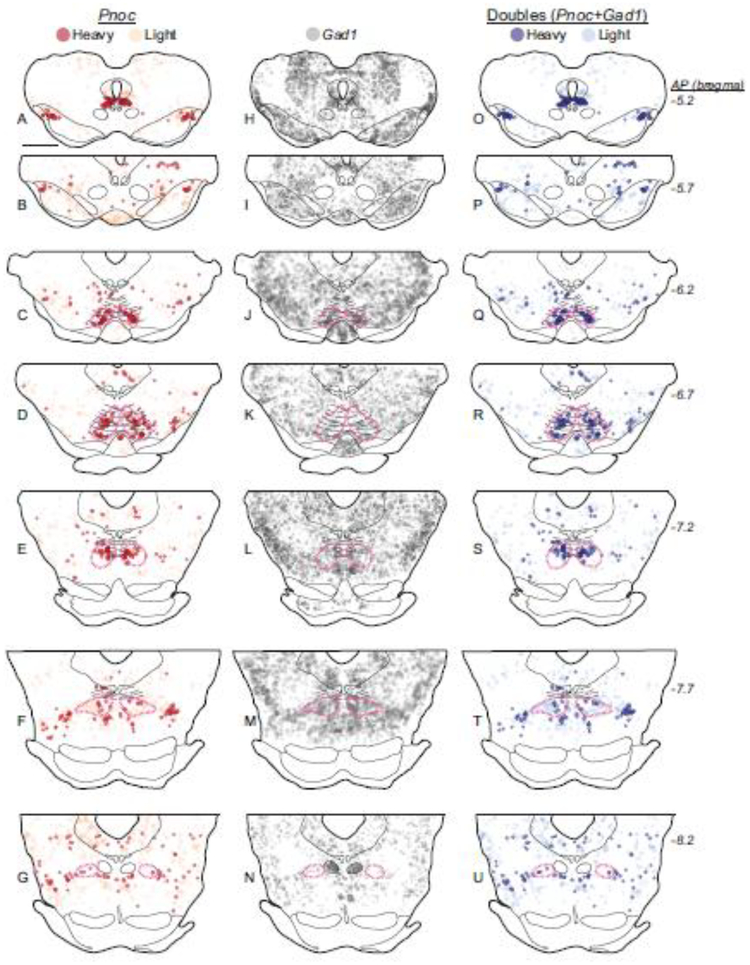
Almost all Pnoc neurons (95–99%, n=2) either inside or outside the RMTg contained Gad1 (Fig. 8), indicating that Pnoc neurons are a subset of inhibitory neurons in the brain. ISH also confirmed that Pnoc was enriched in the RMTg, albeit to a lesser degree than FoxP1. Most (68%) RMTg Gad1 neurons expressed Pnoc, compared to 18% of Gad1 neurons just lateral to the RMTg (Fig. 8). Notably, the use of radioactive ISH for Pnoc allowed us to quantify Pnoc density per cell by counting the number of silver grains over each cell, and this analysis suggested that individual Pnoc neurons in the RMTg expressed stronger radiolabeled signal than individual Pnoc neurons outside the RMTg (see “heavy” and “light” expression in Fig. 8). In the RMTg (n=2), 35% of neurons showed “heavy” Pnoc expression (defined by silver grain counts exceeding one-third of highest levels in that section; see methods), a higher percentage than in any other midbrain region.
Fig. 8.
Pnoc neurons express Gad1 in rats. a-g. Pnoc mRNA labeling is heavy (greater density of ISH signal, i.e., silver grains) in neurons within the RMTg region (magenta dashed outlines). h-n. Gad1 mRNA (via DIG-labeled ISH) is observed in the RMTg but also to a similar degree in surrounding areas. o-u. Neurons double-labeled for heavy Pnoc and Gad1 are more common within the RMTg as compared to outside the RMTg. Notably, both within and outside the RMTg, almost all Pnoc neurons express Gad1. However, Gad1 neurons expressing Pnoc are only common within the RMTg. Scalebar = 1 mm.
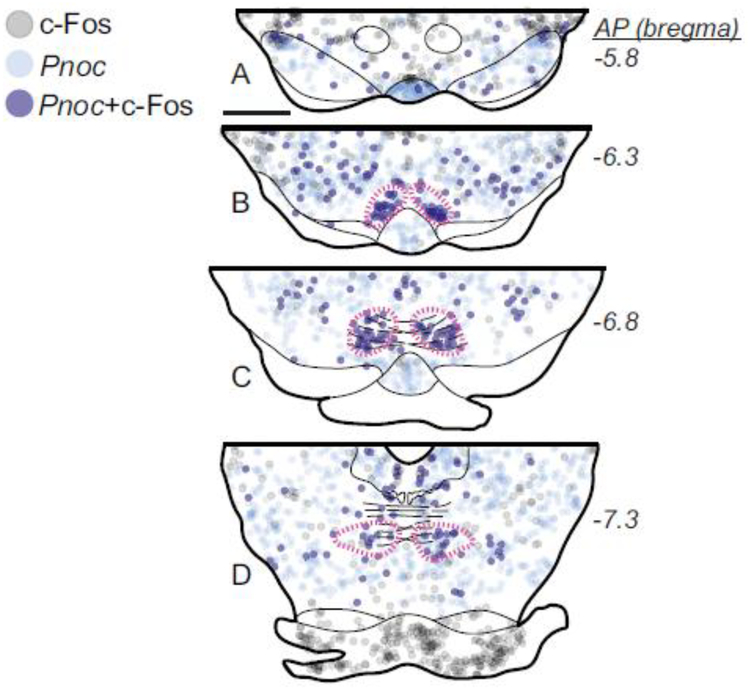
Finally, Pnoc ISH (radioactive) colocalized more strongly with psychostimulant-induced c-Fos in the RMTg than elsewhere (Fig. 9). In the RMTg (n=2), 50% of Pnoc neurons expressed amphetamine-induced c-Fos, and almost all (95%) c-Fos neurons expressed Pnoc, versus 20% and 13% for these proportions in the VTA, and 14% and 62% in the reticular formation lateral to the RMTg.
Fig. 9.
Pnoc neurons within the RMTg (magenta dashed outlines) express amphetamine-induced c-Fos in rats. In these images, Pnoc was detected via radiolabeled ISH and c-Fos was detected via IHC.
Characterization and colocalization of FoxP1 in mouse RMTg
As the RMTg had not been definitively identified in mice, we next used IHC and RNAscope to detect FoxP1 protein and FoxP1 mRNA in mouse brain. We found a distribution pattern in mice very similar to that observed in rats, i.e., largely caudal to the DA neurons of the VTA, medial to the cholinergic neurons of the PPTg, embedded within and slightly ventral to the xscp/vtgx decussation, and with a dorsomedial elongation at some rostrocaudal levels. As in the rat, we observed close similarity of IHC and RNAscope signals in mouse, and for technical ease used FoxP1 IHC in all subsequent double-label experiments.
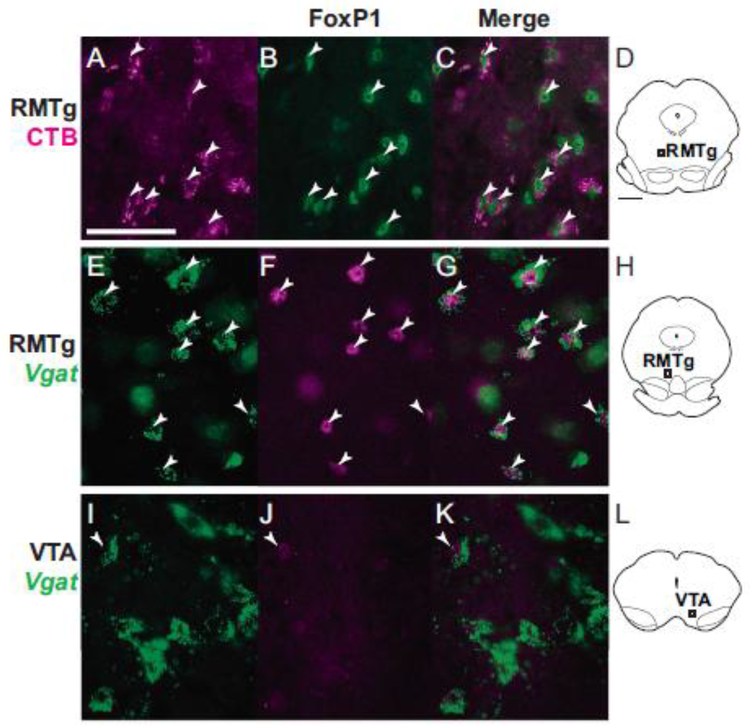
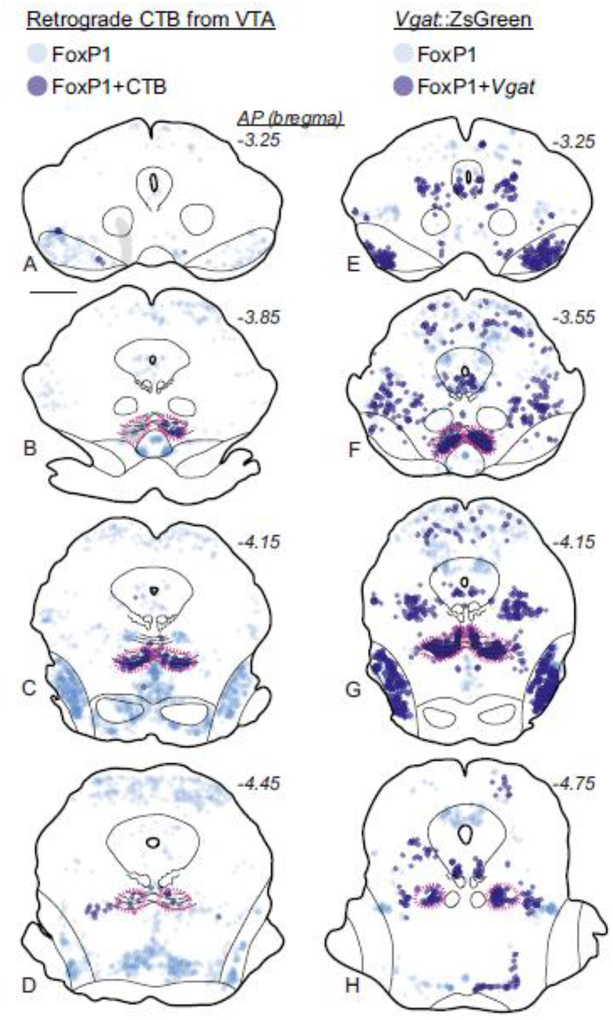
In mice, as in rats, we found that the RMTg cluster of FoxP1 neurons strongly colocalized with retrograde CTB labeling from VTA (Fig. 10a–d, Fig. 11a–d). Tracer injections were placed into 3 mice, with largely similar results. Only 1 case was quantified, but in this case, 78% of CTB neurons expressed FoxP1 in the RMTg versus 2% outside the RMTg (Fig. 11a–d), similar to the percentages seen in rats.
Fig. 10.
Representative photos of FoxP1-immunoreactive neurons, other neuronal markers, and merged images from mice. a-d. In the RMTg, neurons labeled with retrograde CTB from VTA also express FoxP1 (images are from region shown in d). e-h. In the RMTg, FoxP1 is present in Vgat neurons (from transgenic Vgat::ZsGreen mouse; images are from region shown in h). i-l. In the VTA, FoxP1 is present in only a small proportion of Vgat neurons (from transgenic Vgat::ZsGreen mouse; images are from region shown in l). Arrowheads signify double labeling. Scalebars = 50 μm.
Fig. 11.
FoxP1 neurons in the RMTg project to VTA and express Vgat in mice. a-d. FoxP1 is found throughout the midbrain, but is particularly dense in the RMTg (magenta dashed lines). Within the midbrain, neurons double-labeled with FoxP1 and retrograde tracer (CTB) from VTA are almost exclusively found in the RMTg. Translucent gray shows location where heavy CTB fiber expression precluded accurate neuronal labeling. e-h. FoxP1 neurons express Vgat in several regions in transgenic Vgat::ZsGreen mice, including the RMTg (f), SNr (e), and NLL (g). Notably, despite the large numbers of Vgat neurons in the VTA, very few double labels with FoxP1 are visible (e). Scalebar = 1 mm.
Using Vgat::ZsGreen transgenic mice, we found evidence that FoxP1 neurons in the RMTg are GABAergic, as FoxP1 labeling colocalized strongly with ZsGreen expression within the RMTg (Fig. 10e–h, Fig. 11e–h), corresponding with previous findings that FoxP1 is expressed in GABAergic neurons in the RMTg (Lahti et al. 2016). Colocalization was much weaker in the VTA (Fig. 10i–l), suggesting that GABA neurons in the VTA either lack or have very low levels of FoxP1. Interestingly, double-label IHC in mice confirmed that, as in rats, most FoxP1 neurons in the VTA were not dopaminergic (data not shown). We also observed colocalization of FoxP1 and Vgat::ZsGreen in several other regions that were spatially separated from the RMTg, including the SN reticulata (SNr) and NLL (Fig. 11e–h), although other FoxP1 populations also existed that were not GABAergic.
Characterization and colocalization of Pnoc in mouse RMTg
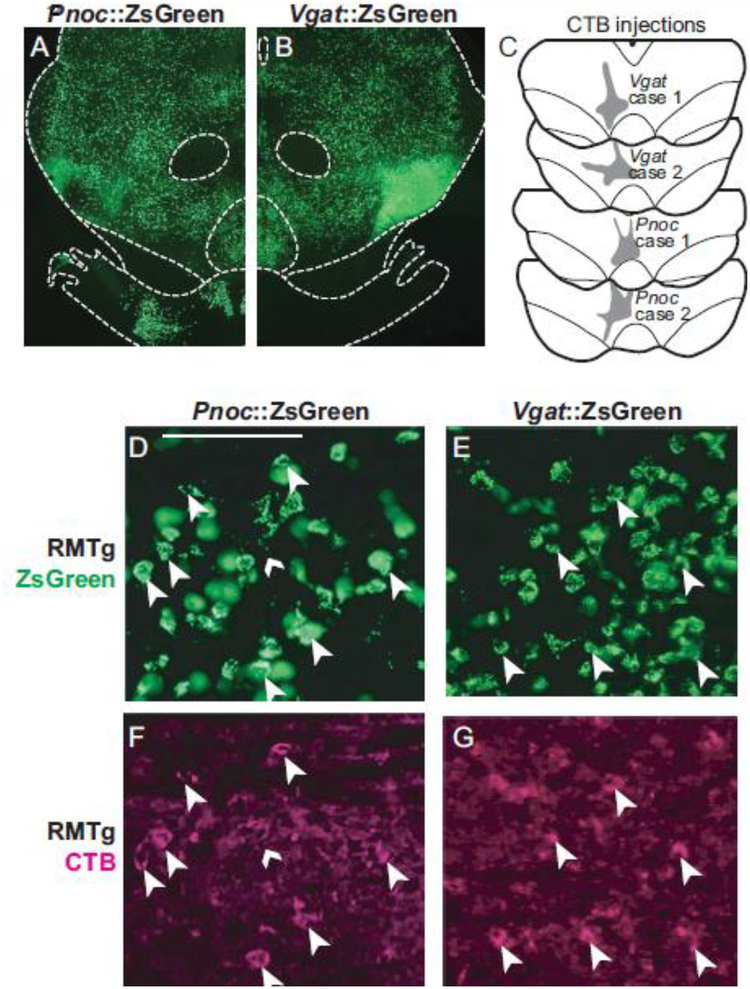
We found that ZsGreen expression in the RMTg of both Pnoc::ZsGreen and Vgat::ZsGreen mice colocalized with CTB retrograde tracing from VTA (Fig. 12c–g, Fig. 13). Both Vgat and Pnoc-induced ZsGreen expression, however, were not selective to the RMTg and could be seen throughout the midbrain with no particular enhancement in RMTg (Fig. 12a–b). The widespread expression of signal in Pnoc::ZsGreen mice contrasted markedly with Pnoc ISH in rats (Fig. 8) and mice (Online Resource 2), which showed “heavy” expression in RMTg neurons, and this difference is possibly related to the ZsGreen signal being driven not by the Pnoc promoter, but rather by the CAG promoter in the Ai6 reporter mouse line, allowing strong expression of ZsGreen even if Pnoc itself is only weakly expressed. In fact, Pnoc ISH shows weak or “light” expression of Pnoc in many neurons surrounding the RMTg in rats (Fig. 8) and mice (Online Resource 2).
Fig. 12.
ZsGreen expression in transgenic Pnoc::ZsGreen or Vgat::ZsGreen mice is present in the RMTg and overlaps with retrograde (CTB) labeling from VTA, but is also expressed widely throughout the midbrain. a-b. ZsGreen expression in Pnoc::ZsGreen or Vgat::ZsGreen mice in the midbrain. c. CTB injection sites in the VTA for Pnoc::ZsGreen or Vgat::ZsGreen mice. d-g. ZsGreen and retrograde (CTB) labeling from VTA colocalize in the RMTg. Large arrowheads indicate CTB cells that also express ZsGreen, while small arrowheads indicate CTB cells lacking ZsGreen. Scalebar = 100μm.
Fig. 13.
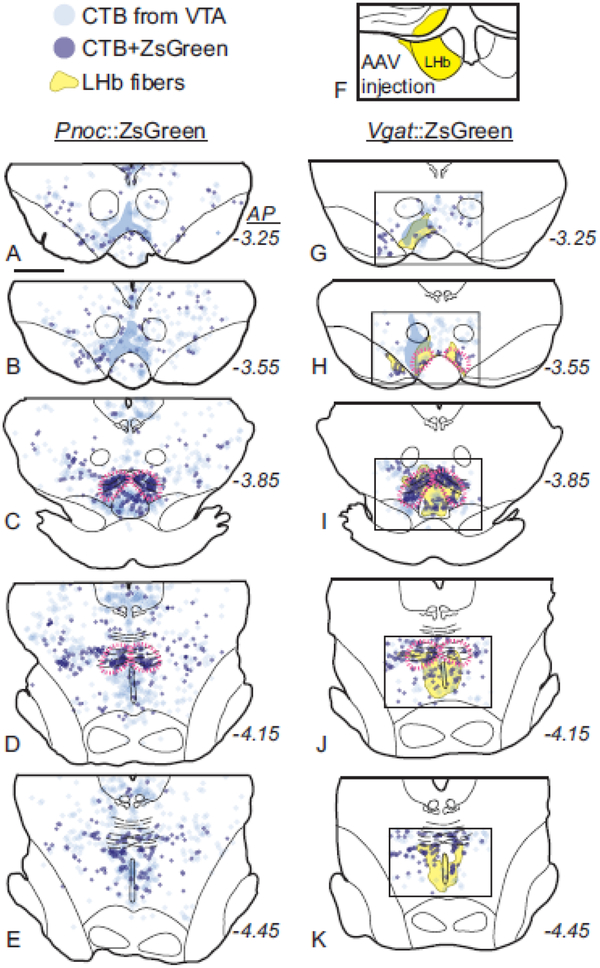
Localization of midbrain Pnoc and Vgat neurons projecting to the VTA in transgenic Pnoc::ZsGreen and Vgat::ZsGreen mice. a-e. Neurons retrogradely labeled (CTB) from the VTA are observed throughout the midbrain. Neurons double-labeled for CTB and Pnoc::ZsGreen are concentrated in the RMTg (magenta dashed outlines). f-k. Neurons double-labeled for CTB and Vgat::ZsGreen are also concentrated in the RMTg and overlap with LHb efferents. The yellow shaded region indicates efferents anterogradely labeled from LHb via AAV injection into LHb (injection area indicated in f). Translucent blue shows location where heavy CTB fiber expression precluded accurate neuronal labeling.
The location of CTB retrograde tracing and ZsGreen colocalization also overlapped with anterograde fibers from LHb, visualized via mCherry expression from an AAV virus injection into LHb (Fig. 13f–k), consistent with previous identification of a strong LHb projection to RMTg in mouse and rat (Goncalves et al. 2012; Brinschwitz et al. 2010; Jhou et al. 2009a; Kaufling et al. 2009; Balcita-Pedicino et al. 2011; Quina et al. 2015; Yetnikoff et al. 2015).
Optogenetic manipulation of mouse RMTg
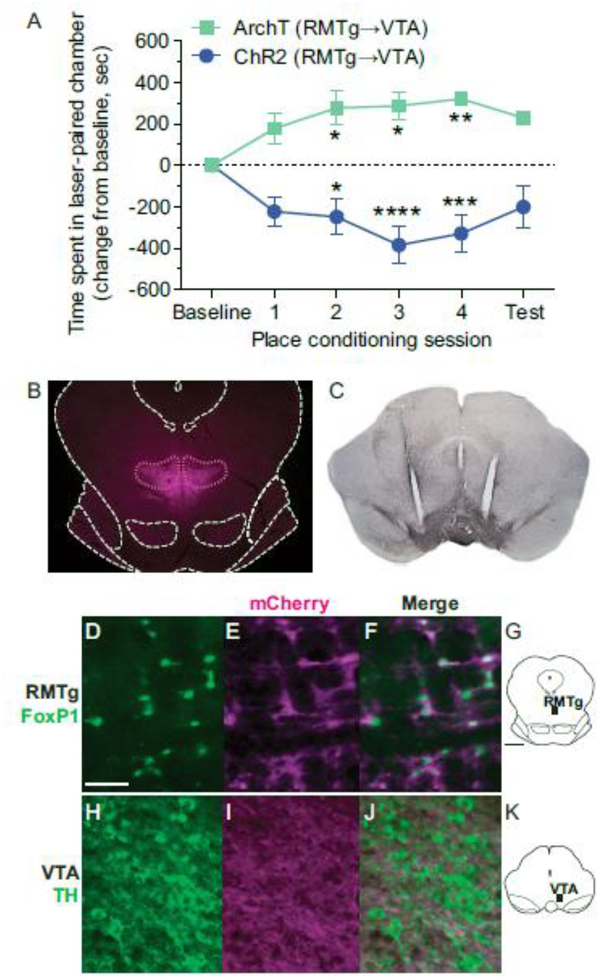
The experiments described above are the first to fully delineate the boundaries of the RMTg in mouse, but it remained unclear whether this structure served comparable functional roles in rats vs. mice. To evaluate the behavioral function of RMTg in mice, we tested for real-time place preference/avoidance using optogenetic stimulation or inhibition of RMTg GABAergic projections to VTA. We used transgenic Vgat-ires-Cre mice for these studies because FoxP1-Cre mice have yet to be developed, and because Pnoc-ires-Cre mice did not appear to show ZsGreen expression specific to the RMTg (Fig. 12a). Therefore, transgenic Vgat-ires-Cre mice received RMTg injection of virus encoding either ChR2 (n=7) or ArchT (n=5), and VTA implantation of optical fibers, so that RMTg axon terminals within the VTA would be targeted by laser light. At least 3 weeks later (to allow adequate virus expression), real-time place preference/avoidance was assessed following optogenetic manipulation of RMTg projections. As compared to baseline preference, ChR2-induced stimulation of RMTg projections to the VTA caused avoidance of the light-paired chamber, with a tendency for this avoidance to increase across testing sessions (Fig. 14a). Conversely, ArchT-induced inhibition of the RMTg-VTA pathway produced the opposite effect and a strong preference for the light-paired chamber (Fig. 14a). A 2-way ANOVA revealed a significant main effect for opsin (ChR2/ArchT) [F(1,10) = 33.22, p = 0.0002] and a significant interaction between opsin and test session [F(5,50) = 9.204, p < 0.0001]. Post hoc analysis showed a statistical change from baseline for conditioning sessions 2, 3, and 4 in both ArchT and ChR2 groups (Fig. 14a). On the final test session without light delivery, animals maintained a conditioned preference/aversion, but to a smaller degree that was no longer statistically different from initial baseline preference. Post-mortem assessment of brain tissue verified that GFP/mCherry-expressing neurons were predominantly located within the RMTg (Fig. 14b), GFP/mCherry-expressing axon terminals were within the VTA (Fig. 14c), and optic fibers were localized to the VTA (Fig. 14c). Further, cell body expression in the RMTg colocalized with FoxP1 staining (Fig. 14d–g). Within the VTA, GFP/mCherry expression was observed predominantly in axon terminals (Fig. 14h–k). Notably, it was rare for cell body expression to be observed in the VTA (Fig. 14h–k), but in the instances in which some caudal VTA neuronal expression occurred, preference scores were comparable to group averages.
Fig. 14.
Optogenetic stimulation or inhibition of RMTg projections to the VTA drives real-time place aversion or preference, respectively, in transgenic Vgat-ires-Cre mice. a. As compared to the baseline amount of time spent in the laser-paired chamber (when no laser was delivered), ChR2-induced stimulation of RMTg projections to the VTA caused real-time avoidance of the light-paired chamber (n=7), while ArchT-induced inhibition of the RMTg-VTA pathway led to a strong real-time preference for the light-paired chamber (n=5). On the final test, no laser was delivered. *p<0.05, **p<0.01, ***p<0.001, ****p<0.0001 in post hoc analysis, as compared to baseline. b. Representative image of virus expression (mCherry) in the RMTg of Vgat-ires-Cre mice. c. Representative image of virus expression (mCherry visualized with DAB) in RMTg axon terminals within the VTA, and the location of bilateral optic fibers aimed at the VTA. d-g. Representative photos show Cre-dependent virus expression (mCherry) in FoxP1-labeled neurons in the RMTg of Vgat-ires-Cre mice (images are from region shown in g). h-k. Virus expression (mCherry) was also observed in axon terminals within VTA, but was not observed in TH-labeled or other cell bodies within VTA (images are from region shown in k). Scalebars = 50 μm for d-f and h-j, and 1 mm for g and k.
DISCUSSION
Our findings show that RMTg neurons have genetic profiles distinct from surrounding GABAergic neurons, including GABAergic neurons in the VTA, and that these distinct profiles can aid in identification and functional analysis of the RMTg. We found that FoxP1 was a particularly comprehensive and selective marker of the RMTg, allowing us to refine its boundaries in rats, and extend its characterization to mice, in which we saw robust changes in place preference with bidirectional modulation of this neural population.
Specificity of FoxP1 and Pnoc for RMTg in both rats and mice
We found that FoxP1 and Pnoc were highly colocalized with at least 3 previously known markers of the RMTg: retrograde labeling from the VTA, psychostimulant-induced c-Fos, and GABAergic markers. Both gene products were also absent or greatly reduced in the majority of VTA GABAergic neurons, indicating that RMTg neurons are genetically distinct from VTA GABA neurons. Specifically, we found that within rat RMTg, FoxP1 colocalized with retrograde labeling from VTA/SNc (Fig. 1, 3) and cocaine-induced c-Fos (Fig. 1, 4), but rarely colocalized with TH expression in VTA (Fig. 1), and was predominantly found caudal to dopaminergic neurons (Fig. 2, 3). Pnoc was identified via RNA-seq (Fig. 5), and showed colocalization with retrograde labeling from the VTA (Fig. 6, 7), Gad1 (Fig. 6, 8), and psychostimulant-induced c-Fos (Fig. 6, 9). In mouse, we also found that FoxP1 colocalized with retrograde labeling from VTA (Fig. 10, 11) and Vgat within RMTg, but not within VTA (Fig. 10, 11). Finally, using transgenic mice, we found that Pnoc- and Vgat-related zsGreen expression within RMTg colocalized with retrograde labeling from VTA and anterograde tracing from LHb (Fig. 12, 13). These results corroborate with recent work showing that FoxP1 expression colocalized with Gad1 and methamphetamine-induced FosB, and overlapped with LHb projections, in the mouse RMTg (Lahti et al. 2016).
Both FoxP1 and Pnoc labeled a higher proportion of neurons within the RMTg boundaries than previous markers. FoxP1 and Pnoc labeled 91% and 68% of RMTg neurons, respectively (based on NeuN and GABAergic totals), whereas retrograde labeling from the VTA and psychostimulant-induced Fos typically label less than half of neurons within these same boundaries (Fig. 3h–n) (Jhou et al. 2009b; Lahti et al. 2016). However, Pnoc was also present outside the RMTg (albeit at lower levels than within RMTg, Fig. 8a–g), whereas FoxP1 was notably absent in most regions immediately outside the RMTg, making it an especially specific label. Relative to previously established markers, FoxP1 expression allowed more precise delineation of RMTg borders, revealing sharper than expected lateral and caudal boundaries, as well as a dorsomedial elongation not noted in prior studies (e.g. Fig. 3c, 4d, 11g).
FoxP1 expression defined a strikingly similar region in mice as compared to rats, and again colocalized with retrograde labeling from the VTA and GABAergic markers. As in rats, this region resided just dorsal and caudal to the IPN, sitting in or ventral to the xscp/vtgx decussation, and overall residing caudal to the VTA and medial to the cholinergic neurons of the PPTg (Fig. 11). Despite the close similarity to rat RMTg, we did note some differences in mice. Notably, the red nucleus, which is largely rostral to the RMTg in rats (Fig. 3a), extends more caudally in mice and is visible dorsal to the mouse RMTg (Fig. 11b, f), at levels where the red nucleus would not be present in rats. In addition, the bilateral portions of RMTg appear joined along the midline at rostral levels in mice (Fig. 11, 13), but not rats.
In both rats and mice, we saw that Pnoc ISH signals were stronger in the RMTg than just outside the RMTg (Fig. 8, Online Resource 2). However, in Pnoc::ZsGreen mice, reporter labeling appeared just as dense outside the RMTg as within (Fig. 12). This non-specific ZsGreen labeling could be explained by expanded Pnoc expression during early brain development, or because cells expressing even low levels of Pnoc-Cre would induce high levels of ZsGreen expression via the robust CAG promoter. Hence, ZsGreen expression levels in transgenic Pnoc-Cre mice do not necessarily reflect Pnoc expression in the adult mouse. In addition, this non-specific ZsGreen labeling might reflect some potential species differences, which is supported by the observation that the Pnoc ISH signal in RMTg neurons, relative to surrounding neurons, appears denser in rats (Fig. 8) as compared to mice (Online Resource 2).
Genetic distinction between RMTg and VTA GABA neurons
We found that RMTg neurons were enriched in Pnoc (Figs. 8, 11) and FoxP1 (Figs. 3, 13), whereas the majority of GABAergic neurons in the VTA lacked Pnoc (Fig. 8, in rats) and FoxP1 (Fig. 11, in mice). Hence, the RMTg does not appear to be simply a caudal extension of VTA GABAergic neurons, even though a small number of VTA neurons do express FoxP1 or Pnoc. Notably, most FoxP1 neurons in the VTA appeared to be neither DAergic nor GABAergic, as FoxP1 did not colocalize with TH in either rats (Fig. 1m–p) or mice (data not shown), and did not colocalize with VTA ZsGreen in Vgat::ZsGreen mice (Fig. 11e–h), suggesting that this small population of FoxP1 VTA neurons may represent a third (possibly glutamatergic) population of VTA neurons (Morales and Root 2014). Consistent with our findings, recent investigations into the embryonic and adult gene expression profiles of ventral midbrain GABAergic neurons have revealed that GABAergic neurons in SNr, VTA, and RMTg represent different subgroups with unique molecular markers (Lahti et al. 2016). In addition, considerable functional data from prior studies support a distinction between RMTg and VTA GABAergic neurons. For example, mu opioid agonists are more reinforcing when injected into the RMTg versus VTA, and mu opioid agonists block inhibition of DA neurons induced by stimulation of the RMTg but not VTA interneurons (Matsui and Williams 2011; Jhou et al. 2012; Matsui et al. 2014; Jalabert et al. 2011; Zangen et al. 2002). In light of these differences, it is notable that both RMTg and VTA GABAergic neurons have been shown to signal reward prediction errors (Stopper et al. 2014; Hong et al. 2011; Jhou et al. 2009a; Eshel et al. 2015).
Heterogeneity within RMTg
In the current study, a small minority of neurons (9–20%) within the RMTg borders lacked FoxP1 expression but still expressed “classic” RMTg markers, such as VTA retrograde labeling or cocaine-induced c-Fos. Currently, it is unclear whether these FoxP1-lacking neurons are indeed lacking in FoxP1 (possibly representing a distinct type of neuron), or simply express FoxP1 protein levels that were too low to be detected by IHC. The small number of such neurons will likely make further study of them difficult.
We also saw evidence for rostrocaudal and/or mediolateral gradients within the RMTg. More lateral RMTg neurons preferentially innervated the SNc (Fig. 3), consistent with prior indications that the RMTg projection to DA neurons is topographic (Jhou et al. 2009b). One possible caveat regarding this finding is that our retrograde tracer injection into the SNc also spread into adjacent regions just dorsal and ventral to the SNc, unlike tracer injections into the VTA which were largely confined to that region. However, our previous anterograde tracing studies found that RMTg projections to regions just outside the SNc are much sparser than to the SNc itself (Jhou et al. 2009b). In addition to a potential anatomic gradient within the RMTg in terms of efferent projections, we also saw evidence for an activity gradient within the RMTg in terms of psychostimulant-induced c-Fos, which appeared more prominent in rostral and medial portions of the RMTg (Fig. 4), where SNc-projecting neurons are sparse. This parallels prior studies showing that psychostimulant-induced c-Fos is abundant in VTA-projecting RMTg neurons (Colussi-Mas et al. 2007; Geisler et al. 2008). Notably, we saw no topographic gradients in FoxP1 expression, which was present throughout the RMTg with no obvious mediolateral or rostrocaudal gradient in intensity. However, we saw some evidence that Pnoc expression is lower at caudal levels of the rat RMTg (Figs. 7–9).
Functional considerations and future directions
Many RMTg functions are in opposition to those of midbrain DA structures, consistent with the robust inhibitory influence of the RMTg on DA neuron activity. Specifically, whereas DA activation is associated with locomotor stimulation and reward-seeking, activation of the RMTg in rats is associated with motor inhibition, as well as fear, avoidance, and punishment-related behaviors (Jhou et al. 2009a; Jhou et al. 2013; Sanchez-Catalan et al. 2016; Vento et al. 2017; Bourdy et al. 2014; Hong et al. 2011; Jalabert et al. 2011; Stopper et al. 2014). While these initial studies in the RMTg were conducted in rats or nonhuman primates, we now show that optogenetic excitation or inhibition of the RMTg in mice drives real-time place avoidance or preference, respectively (Fig. 14), demonstrating a role for RMTg in affective encoding in mice. These findings are consistent with previous reports demonstrating that optogenetic stimulation of LHb afferents to the (presumed) RMTg caused real-time place aversion in mice, and optogenetic inhibition of GABA neurons within the VTA or RMTg caused real-time place preference (Siuda et al. 2015; Stamatakis and Stuber 2012). Notably, in these previous studies the identity of the RMTg was inferred via homology to rat, but was not confirmed explicitly as was done in the current study. The combined use of transgenic Vgat-ires-Cre mice and FoxP1 IHC (as used in the current studies) will be greatly beneficial to future RMTg research. Future efforts to develop transgenic FoxP1-Cre mice will provide even greater selectivity for targeting the RMTg.
The newly identified presence of enhanced Pnoc levels in RMTg neurons could have additional implications for understanding some of the aforementioned RMTg functions. Pnoc encodes the peptide nociceptin/OFQ, which inhibits DA neurons in slices, and hence could augment the actions of GABA also released by the RMTg (Zheng et al. 2002). Although Pnoc-Cre mice were not useful for specifically identifying the RMTg in mouse brain (Fig. 12a), the particularly high levels of Pnoc per neuron in the RMTg could be functionally significant, as nociceptin has been implicated in pain, aversion, and anxiety behaviors (Toll et al. 2016). However, it is unknown to what extent these functions are mediated by the RMTg versus the many other Pnoc-expressing neuron populations in the brain.
Conclusions
We characterized FoxP1 and Pnoc as potential neurochemical markers for the RMTg. Our data indicate that FoxP1 is particularly effective as a marker for the RMTg, as it is more comprehensive, selective, and reliable than previously established markers in both rats and mice, and is easily detected via IHC. Examination of FoxP1 and its colocalization with previously established RMTg markers allowed us to corroborate and extend previous definitions of the RMTg. Altogether, we identified more precise boundaries for the RMTg in rats and mice, and provided further evidence that GABAergic neurons within the RMTg are distinct from GABAergic neurons within the VTA and SN.
Supplementary Material
ACKNOWLEDGMENTS
The authors would like to thank Jacqui Joseph, Jennifer Hergatt, Nicki Pullmann, Nathan Burnham, and Haley Spencer for excellent technical assistance. We thank Drs. Marisela Morales and Huiling Wang for contributing rat Pnoc ISH results, and Drs. Elin Lehrmann and William Freed for DNA microarray results that preceded the RNA-seq findings shown here. This work was supported by National Institutes of Health grants R21 DA037744 (RJS) and R03 DA034431 (TCJ), as well as Department of Defense grant W911NF-16-2-0070 (TCJ).
Funding: Funding provided by National Institutes of Health grants R21 DA037744 (RJS) and R03 DA034431 (TCJ), and Department of Defense grant W911NF-16-2-0070 (TCJ).
Footnotes
Conflict of Interest: The authors declare that they have no conflict of interest.
Ethical Approval: All animal studies were conducted in accordance with the Guide for the Care and Use of Laboratory Animals, and were approved by the Institutional Animal Care and Use Committee at MUSC.
REFERENCES
- Balcita-Pedicino JJ, Omelchenko N, Bell R, Sesack SR (2011) The inhibitory influence of the lateral habenula on midbrain dopamine cells: ultrastructural evidence for indirect mediation via the rostromedial mesopontine tegmental nucleus. J Comp Neurol 519 (6):1143–1164. doi: 10.1002/cne.22561 [DOI] [PMC free article] [PubMed] [Google Scholar]
- Barrot M, Sesack SR, Georges F, Pistis M, Hong S, Jhou TC (2012) Braking dopamine systems: a new GABA master structure for mesolimbic and nigrostriatal functions. J Neurosci 32 (41):14094–14101. doi:32/41/14094 [pii] 10.1523/JNEUROSCI.3370-12.2012 [DOI] [PMC free article] [PubMed] [Google Scholar]
- Benjamini Y, Hochberg Y (1995) Controlling the false discovery rate: a practical and powerful approach to multiple testing. J R Statist Soc B 57 (1):289–300. [Google Scholar]
- Bourdy R, Sanchez-Catalan MJ, Kaufling J, Balcita-Pedicino JJ, Freund-Mercier MJ, Veinante P, Sesack SR, Georges F, Barrot M (2014) Control of the nigrostriatal dopamine neuron activity and motor function by the tail of the ventral tegmental area. Neuropsychopharmacology 39 (12):2788–2798. doi: 10.1038/npp.2014.129 [DOI] [PMC free article] [PubMed] [Google Scholar]
- Brinschwitz K, Dittgen A, Madai VI, Lommel R, Geisler S, Veh RW (2010) Glutamatergic axons from the lateral habenula mainly terminate on GABAergic neurons of the ventral midbrain. Neuroscience 168 (2):463–476. doi:S0306–4522(10)00443–4 [pii] 10.1016/j.neuroscience.2010.03.050 [DOI] [PubMed] [Google Scholar]
- Colussi-Mas J, Geisler S, Zimmer L, Zahm DS, Berod A (2007) Activation of afferents to the ventral tegmental area in response to acute amphetamine: a double-labelling study. Eur J Neurosci 26 (4):1011–1025. [DOI] [PMC free article] [PubMed] [Google Scholar]
- Erlander MG, Tillakaratne NJ, Feldblum S, Patel N, Tobin AJ (1991) Two genes encode distinct glutamate decarboxylases. Neuron 7 (1):91–100. [DOI] [PubMed] [Google Scholar]
- Eshel N, Bukwich M, Rao V, Hemmelder V, Tian J, Uchida N (2015) Arithmetic and local circuitry underlying dopamine prediction errors. Nature 525 (7568):243–246. doi: 10.1038/nature14855 [DOI] [PMC free article] [PubMed] [Google Scholar]
- Fu R, Zuo W, Gregor D, Li J, Grech D, Ye JH (2016) Pharmacological manipulation of the rostromedial tegmental nucleus changes voluntary and operant ethanol self-administration in rats. Alcohol Clin Exp Res 40 (3):572–582. doi: 10.1111/acer.12974 [DOI] [PMC free article] [PubMed] [Google Scholar]
- Geisler S, Marinelli M, Degarmo B, Becker ML, Freiman AJ, Beales M, Meredith GE, Zahm DS (2008) Prominent activation of brainstem and pallidal afferents of the ventral tegmental area by cocaine. Neuropsychopharmacology 33 (11):2688–2700. doi: 10.1038/sj.npp.1301650 [DOI] [PMC free article] [PubMed] [Google Scholar]
- Goncalves L, Sego C, Metzger M (2012) Differential projections from the lateral habenula to the rostromedial tegmental nucleus and ventral tegmental area in the rat. J Comp Neurol 520 (6):1278–1300. doi: 10.1002/cne.22787 [DOI] [PubMed] [Google Scholar]
- Hong S, Jhou TC, Smith M, Saleem KS, Hikosaka O (2011) Negative reward signals from the lateral habenula to dopamine neurons are mediated by rostromedial tegmental nucleus in primates. J Neurosci 31 (32):11457–11471. doi:31/32/11457 [pii] 10.1523/JNEUROSCI.1384-11.2011 [DOI] [PMC free article] [PubMed] [Google Scholar]
- Huff ML, LaLumiere RT (2015) The rostromedial tegmental nucleus modulates behavioral inhibition following cocaine self-administration in rats. Neuropsychopharmacology 40 (4):861–873. doi: 10.1038/npp.2014.260 [DOI] [PMC free article] [PubMed] [Google Scholar]
- Jalabert M, Bourdy R, Courtin J, Veinante P, Manzoni OJ, Barrot M, Georges F (2011) Neuronal circuits underlying acute morphine action on dopamine neurons. Proc Natl Acad Sci U S A 108 (39):16446–16450. doi:1105418108 [pii] 10.1073/pnas.1105418108 [DOI] [PMC free article] [PubMed] [Google Scholar]
- Jhou T (2005) Neural mechanisms of freezing and passive aversive behaviors. J Comp Neurol 493 (1):111–114. doi: 10.1002/cne.20734 [DOI] [PubMed] [Google Scholar]
- Jhou TC, Fields HL, Baxter MG, Saper CB, Holland PC (2009a) The rostromedial tegmental nucleus (RMTg), a GABAergic afferent to midbrain dopamine neurons, encodes aversive stimuli and inhibits motor responses. Neuron 61 (5):786–800. doi:S0896–6273(09)00121–4 [pii] 10.1016/j.neuron.2009.02.001 [DOI] [PMC free article] [PubMed] [Google Scholar]
- Jhou TC, Geisler S, Marinelli M, Degarmo BA, Zahm DS (2009b) The mesopontine rostromedial tegmental nucleus: A structure targeted by the lateral habenula that projects to the ventral tegmental area of Tsai and substantia nigra compacta. J Comp Neurol 513 (6):566–596. doi: 10.1002/cne.21891 [DOI] [PMC free article] [PubMed] [Google Scholar]
- Jhou TC, Good CH, Rowley CS, Xu SP, Wang H, Burnham NW, Hoffman AF, Lupica CR, Ikemoto S (2013) Cocaine Drives Aversive Conditioning via Delayed Activation of Dopamine-Responsive Habenular and Midbrain Pathways. J Neurosci 33 (17):7501–7512. doi:33/17/7501 [pii] 10.1523/JNEUROSCI.3634-12.2013 [DOI] [PMC free article] [PubMed] [Google Scholar]
- Jhou TC, Xu SP, Lee MR, Gallen CL, Ikemoto S (2012) Mapping of reinforcing and analgesic effects of the mu opioid agonist Endomorphin-1 in the ventral midbrain of the rat. Psychopharmacology (Berl) 224 (2):303–312. doi: 10.1007/s00213-012-2753-6 [DOI] [PMC free article] [PubMed] [Google Scholar]
- Kaufling J, Aston-Jones G (2015) Persistent Adaptations in Afferents to Ventral Tegmental Dopamine Neurons after Opiate Withdrawal. J Neurosci 35 (28):10290–10303. doi: 10.1523/JNEUROSCI.0715-15.2015 [DOI] [PMC free article] [PubMed] [Google Scholar]
- Kaufling J, Veinante P, Pawlowski SA, Freund-Mercier MJ, Barrot M (2009) Afferents to the GABAergic tail of the ventral tegmental area in the rat. J Comp Neurol 513 (6):597–621. doi: 10.1002/cne.21983 [DOI] [PubMed] [Google Scholar]
- Lahti L, Haugas M, Tikker L, Airavaara M, Voutilainen MH, Anttila J, Kumar S, Inkinen C, Salminen M, Partanen J (2016) Differentiation and molecular heterogeneity of inhibitory and excitatory neurons associated with midbrain dopaminergic nuclei. Development 143 (3):516–529. doi: 10.1242/dev.129957 [DOI] [PubMed] [Google Scholar]
- Lavezzi H, Parsley K, Ariel M, Zahm DS (2010) Fos expression in a projection from the rostromedial tegmental nucleus (RMTg) to the pars dissipata of the pedunculopontine tegmental nucleus (PPTg) following administration of methamphetamine in the rat. Society for Neuroscience Abstracts:491.494. [Google Scholar]
- Lavezzi HN, Parsley KP, Zahm DS (2015) Modulation of locomotor activation by the rostromedial tegmental nucleus. Neuropsychopharmacology 40 (3):676–687. doi: 10.1038/npp.2014.223 [DOI] [PMC free article] [PubMed] [Google Scholar]
- Lavezzi HN, Zahm DS (2011) The mesopontine rostromedial tegmental nucleus: an integrative modulator of the reward system. Basal Ganglia 1 (4):191–200. doi: 10.1016/j.baga.2011.08.003 [DOI] [PMC free article] [PubMed] [Google Scholar]
- Lecca S, Melis M, Luchicchi A, Ennas MG, Castelli MP, Muntoni AL, Pistis M (2011) Effects of drugs of abuse on putative rostromedial tegmental neurons, inhibitory afferents to midbrain dopamine cells. Neuropsychopharmacology 36 (3):589–602. doi: 10.1038/npp.2010.190 [DOI] [PMC free article] [PubMed] [Google Scholar]
- Lecca S, Melis M, Luchicchi A, Muntoni AL, Pistis M (2012) Inhibitory inputs from rostromedial tegmental neurons regulate spontaneous activity of midbrain dopamine cells and their responses to drugs of abuse. Neuropsychopharmacology 37 (5):1164–1176. doi: 10.1038/npp.2011.302 [DOI] [PMC free article] [PubMed] [Google Scholar]
- Lein ES, Hawrylycz MJ, Ao N, Ayres M, Bensinger A, Bernard A, Boe AF, Boguski MS, Brockway KS, Byrnes EJ, Chen L, Chen TM, Chin MC, Chong J, Crook BE, Czaplinska A, Dang CN, Datta S, Dee NR, Desaki AL, Desta T, Diep E, Dolbeare TA, Donelan MJ, Dong HW, Dougherty JG, Duncan BJ, Ebbert AJ, Eichele G, Estin LK, Faber C, Facer BA, Fields R, Fischer SR, Fliss TP, Frensley C, Gates SN, Glattfelder KJ, Halverson KR, Hart MR, Hohmann JG, Howell MP, Jeung DP, Johnson RA, Karr PT, Kawal R, Kidney JM, Knapik RH, Kuan CL, Lake JH, Laramee AR, Larsen KD, Lau C, Lemon TA, Liang AJ, Liu Y, Luong LT, Michaels J, Morgan JJ, Morgan RJ, Mortrud MT, Mosqueda NF, Ng LL, Ng R, Orta GJ, Overly CC, Pak TH, Parry SE, Pathak SD, Pearson OC, Puchalski RB, Riley ZL, Rockett HR, Rowland SA, Royall JJ, Ruiz MJ, Sarno NR, Schaffnit K, Shapovalova NV, Sivisay T, Slaughterbeck CR, Smith SC, Smith KA, Smith BI, Sodt AJ, Stewart NN, Stumpf KR, Sunkin SM, Sutram M, Tam A, Teemer CD, Thaller C, Thompson CL, Varnam LR, Visel A, Whitlock RM, Wohnoutka PE, Wolkey CK, Wong VY, Wood M, Yaylaoglu MB, Young RC, Youngstrom BL, Yuan XF, Zhang B, Zwingman TA, Jones AR (2007) Genome-wide atlas of gene expression in the adult mouse brain. Nature 445 (7124):168–176. doi:nature05453 [pii] 10.1038/nature05453 [DOI] [PubMed] [Google Scholar]
- Margolis EB, Toy B, Himmels P, Morales M, Fields HL (2012) Identification of rat ventral tegmental area GABAergic neurons. PLoS One 7 (7):e42365. doi: 10.1371/journal.pone.0042365 [DOI] [PMC free article] [PubMed] [Google Scholar]
- Matsui A, Jarvie BC, Robinson BG, Hentges ST, Williams JT (2014) Separate GABA afferents to dopamine neurons mediate acute action of opioids, development of tolerance, and expression of withdrawal. Neuron 82 (6):1346–1356. doi: 10.1016/j.neuron.2014.04.030 [DOI] [PMC free article] [PubMed] [Google Scholar]
- Matsui A, Williams JT (2011) Opioid-sensitive GABA inputs from rostromedial tegmental nucleus synapse onto midbrain dopamine neurons. J Neurosci 31 (48):17729–17735. doi: 10.1523/JNEUROSCI.4570-11.2011 [DOI] [PMC free article] [PubMed] [Google Scholar]
- Morales M, Root DH (2014) Glutamate neurons within the midbrain dopamine regions. Neuroscience 282:60–68. doi: 10.1016/j.neuroscience.2014.05.032 [DOI] [PMC free article] [PubMed] [Google Scholar]
- Morales MF, Wang H, Zhang P, Lehrmann E, Wood WH, Becker KG, Ikemoto S, Jhou TC (2011) Expression of prepronociceptin mRNA in the rostromedial tegmental nucleus (RMTg) Program No. 201.20. 2011 Neuroscience Meeting Planner. Washington, DC: Society for Neuroscience, 2011; Online. [Google Scholar]
- Neal CR Jr., Mansour A, Reinscheid R, Nothacker HP, Civelli O, Watson SJ Jr. (1999) Localization of orphanin FQ (nociceptin) peptide and messenger RNA in the central nervous system of the rat. J Comp Neurol 406 (4):503–547. [PubMed] [Google Scholar]
- Oakman SA, Faris PL, Kerr PE, Cozzari C, Hartman BK (1995) Distribution of pontomesencephalic cholinergic neurons projecting to substantia nigra differs significantly from those projecting to ventral tegmental area. J Neurosci 15 (9):5859–5869. [DOI] [PMC free article] [PubMed] [Google Scholar]
- Paxinos G, Franklin KBJ (2001) The Mouse Brain in Stereotaxic Coordinates. 2nd edn. Academic Press, London [Google Scholar]
- Paxinos G, Watson C (2007) The Rat Brain in Stereotaxic Coordinates. 6th edn. Academic Press, London [Google Scholar]
- Perrotti LI, Bolanos CA, Choi KH, Russo SJ, Edwards S, Ulery PG, Wallace DL, Self DW, Nestler EJ, Barrot M (2005) DeltaFosB accumulates in a GABAergic cell population in the posterior tail of the ventral tegmental area after psychostimulant treatment. Eur J Neurosci 21 (10):2817–2824. [DOI] [PubMed] [Google Scholar]
- Quina LA, Tempest L, Ng L, Harris JA, Ferguson S, Jhou TC, Turner EE (2015) Efferent pathways of the mouse lateral habenula. J Comp Neurol 523 (1):32–60. doi: 10.1002/cne.23662 [DOI] [PMC free article] [PubMed] [Google Scholar]
- Sanchez-Catalan MJ, Faivre F, Yalcin I, Muller MA, Massotte D, Majchrzak M, Barrot M (2016) Response of the tail of the ventral tegmental area to aversive stimuli. Neuropsychopharmacology 42 (3):638–648. doi: 10.1038/npp.2016.139 [DOI] [PMC free article] [PubMed] [Google Scholar]
- Sheth C, Furlong TM, Keefe KA, Taha SA (2016) Lesion of the rostromedial tegmental nucleus increases voluntary ethanol consumption and accelerates extinction of ethanol-induced conditioned taste aversion. Psychopharmacology (Berl) 233 (21–22):3737–3749. doi: 10.1007/s00213-016-4406-7 [DOI] [PMC free article] [PubMed] [Google Scholar]
- Simmons DM, Arriza JL, Swanson LW (1989) A complete protocol for in situ hybridization of messenger RNAs in brain and other tissues with radio-labeled single-stranded RNA probes. Journal of histotechnology 3:169–181. [Google Scholar]
- Siuda ER, Copits BA, Schmidt MJ, Baird MA, Al-Hasani R, Planer WJ, Funderburk SC, McCall JG, Gereau RWt, Bruchas MR (2015) Spatiotemporal control of opioid signaling and behavior. Neuron 86 (4):923–935. doi: 10.1016/j.neuron.2015.03.066 [DOI] [PMC free article] [PubMed] [Google Scholar]
- Stamatakis AM, Stuber GD (2012) Activation of lateral habenula inputs to the ventral midbrain promotes behavioral avoidance. Nat Neurosci 15 (8):1105–1107. doi:nn.3145 [pii] 10.1038/nn.3145 [DOI] [PMC free article] [PubMed] [Google Scholar]
- Stopper CM, Tse MTL, Montes DR, Wiedman CR, Floresco SB (2014) Overriding phasic dopamine signals redirects action selection during risk/reward decision making. Neuron 84 (1):177–189. doi: 10.1016/j.neuron.2014.08.033 [DOI] [PubMed] [Google Scholar]
- Toll L, Bruchas MR, Calo G, Cox BM, Zaveri NT (2016) Nociceptin/orphanin FQ receptor structure, signaling, ligands, functions, and interactions with opioid systems. Pharmacol Rev 68 (2):419–457. doi: 10.1124/pr.114.009209 [DOI] [PMC free article] [PubMed] [Google Scholar]
- Vento PJ, Burnham NW, Rowley CS, Jhou TC (2017) Learning From One’s Mistakes: A Dual Role for the Rostromedial Tegmental Nucleus in the Encoding and Expression of Punished Reward Seeking. Biol Psychiatry 81 (12):1041–1049. doi: 10.1016/j.biopsych.2016.10.018 [DOI] [PMC free article] [PubMed] [Google Scholar]
- Wang F, Flanagan J, Su N, Wang LC, Bui S, Nielson A, Wu X, Vo HT, Ma XJ, Luo Y (2012) RNAscope: a novel in situ RNA analysis platform for formalin-fixed, paraffin-embedded tissues. J Mol Diagn 14 (1):22–29. doi: 10.1016/j.jmoldx.2011.08.002 [DOI] [PMC free article] [PubMed] [Google Scholar]
- Wang HL, Morales M (2008) Corticotropin-releasing factor binding protein within the ventral tegmental area is expressed in a subset of dopaminergic neurons. J Comp Neurol 509 (3):302–318. doi: 10.1002/cne.21751 [DOI] [PMC free article] [PubMed] [Google Scholar]
- Wang HL, Morales M (2009) Pedunculopontine and laterodorsal tegmental nuclei contain distinct populations of cholinergic, glutamatergic and GABAergic neurons in the rat. Eur J Neurosci 29 (2):340–358. doi: 10.1111/j.1460-9568.2008.06576.x [DOI] [PMC free article] [PubMed] [Google Scholar]
- Yetnikoff L, Cheng AY, Lavezzi HN, Parsley KP, Zahm DS (2015) Sources of input to the rostromedial tegmental nucleus, ventral tegmental area, and lateral habenula compared: A study in rat. J Comp Neurol 523 (16):2426–2456. doi: 10.1002/cne.23797 [DOI] [PMC free article] [PubMed] [Google Scholar]
- Zangen A, Ikemoto S, Zadina JE, Wise RA (2002) Rewarding and psychomotor stimulant effects of endomorphin-1: anteroposterior differences within the ventral tegmental area and lack of effect in nucleus accumbens. J Neurosci 22 (16):7225–7233. doi:20026722 [DOI] [PMC free article] [PubMed] [Google Scholar]
- Zheng F, Grandy DK, Johnson SW (2002) Actions of orphanin FQ/nociceptin on rat ventral tegmental area neurons in vitro. Br J Pharmacol 136 (7):1065–1071. doi: 10.1038/sj.bjp.0704806 [DOI] [PMC free article] [PubMed] [Google Scholar]
Associated Data
This section collects any data citations, data availability statements, or supplementary materials included in this article.


