Supplemental Digital Content is available in the text.
Keywords: aorta, arterial pressure, hypertension, cardiovascular disease, stroke volume
Abstract
We examined the influence of arterial stiffening and ventricular ejection dynamics on the age-related increase in central pulse pressure. A total of 2033 women aged 18 to 91 years from the Twins UK cohort were studied. Aortic flow and central blood pressure were measured by Doppler sonography and carotid tonometry, respectively. Measured values of central pulse pressure were compared with values predicted from aortic pulse wave velocity and ventricular ejection characteristics. Central pulse pressure at the first shoulder (P1) increased with age from 29.2±8.0 in those <40 years to 44.2±13.8 mm Hg in those >70 years (means±SD; P<0.001), an increase explained almost entirely by the concomitant increase in aortic pulse wave velocity. Pulse pressure, at the second pressure peak (P2, usually equal to peak central pulse pressure) increased to a greater extent with age: from 29.1±7.8 mm Hg for those <40 years to 60.2±20.5 mm Hg for those >70 years (P<0.001). The ratio of P2/P1 closely mirrored the ratio of ejection volume to ejection velocity at corresponding time points, and the proportionately greater increase in P2 compared with P1 was explained by increased ventricular ejection up to the time of P2. This increased from 52.5±13.1 to 59.3±17.8 mL (P<0.001) in parallel with an age-related increase in stroke volume and body mass index. These results suggest that the age-related change in central pulse wave morphology is driven mainly by an increase in arterial stiffening and altered pattern of ventricular ejection.
See Editorial Commentary, pp 980–982
An increase in pulse pressure after middle age, more marked in women than in men, leading to an increase in systolic blood pressure (BP) is the major cause of incident hypertension in the aging population.1 Systolic BP and pulse pressure are also the BP components most closely associated with cardiovascular risk because of hypertension in middle-aged to older subjects.2 Central pulse pressure (cPP), has been thought to be mainly determined by stiffness of the aorta, with age-related aortic stiffening leading to an irreversible increase in cPP.3 However, cPP is also influenced by left ventricular ejection dynamics and by pressure wave reflection.4,5 cPP can be partitioned into a component related to the first shoulder (P1) of the pressure waveform and subsequent augmentation pressure (AP), leading to the second peak (with pulse pressure P2) usually equal to cPP (Figure 1). Although AP is usually only a small fraction of cPP, an increase in AP plays a disproportionate contribution to the age-related increase in cPP.6,7 Previously attributed to pressure wave reflection,8 studies from Framingham have shown that reflection (when assessed as the amplitude of backward to forward pressure wave amplitude) contributes to a minor degree to age-related changes in cPP and AP.7,9 By contrast, recent studies have highlighted the potential importance of ventricular ejection dynamics in determining pulsatile pressure components.5,9,10 Theoretical principles supported by in-silico simulations and experimental data suggest that, to a first approximation, P1 is determined by the product of proximal aortic pulse wave velocity (PWV) and aortic flow velocity (U1) at the time of P1,11 and P2 by the product of aortic PWV and ejection volume at the time of P2 (V2).12 Assuming proportionality of proximal/distal aortic PWV and of left ventricular outflow/aortic cross-sectional areas, the ratio P2/P1 (closely related to augmentation index) is then simply determined by the ratio of V2/U1 (Figure 1).
Figure 1.
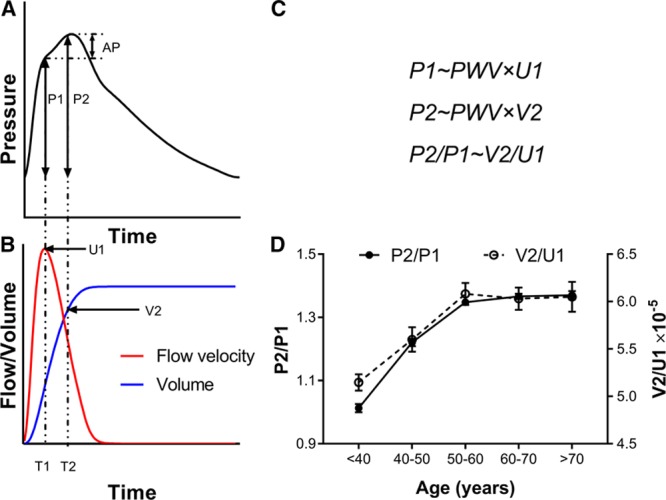
Relation of central pulse pressure components to ejection flow and volume. A, Central pressure waveform showing the first systolic shoulder (P1) and second peak (P2) which is usually equal to central pulse pressure (cPP). Augmentation pressure (AP) is the difference between P2 and P1. B, Aortic flow velocity (U) and ventricular ejection volume (V) obtained by integration of flow velocity and multiplication by cross-sectional area. C, P1 is proportional to the product of aortic pulse wave velocity (PWV) with aortic flow velocity at time of P1 (U1) and P2 to the product of PWV and ejection volume at time of P2 (V2). Thus the P2/P1 ratio is predicted to depend only on the characteristics of ventricular ejection defining V2/U1. D, Relationship of P2/P1 to V2/U1 in Twins UK.
The aim of the present study was thus to examine whether age-related changes in central pressure components in the Twins UK cohort, a cohort of female twins representative of women in the general population in the UK, can be explained by a combination of arterial stiffening (increase in PWV) and age-related change in ventricular ejection dynamics. We measured central aortic pressure by carotid tonometry and aortic flow using pulsed wave Doppler ultrasound. Ventricular ejection volumes were obtained by integration of aortic flow and, in a sub-sample, estimated from 2D echocardiograms. cPP was divided into components related to P1 and AP. Wave intensity analysis and wave separation analysis was used to examine the contribution of forward and backward pressure waves to these components.
Methods
Study Population
Subjects comprised 2033 unselected female twins from the Twins UK cohort. Most of the measurements are available for external researchers to use via application to Twins UK: http://twinsuk.ac.uk. The study was approved by the St Thomas’ Hospital Research Ethics Committee, and written informed consent was obtained from all subjects. Measurements were performed during a single visit to a quiet temperature-controlled vascular laboratory (22°C–24°C) over the period 2006 to 2016. Height and weight were measured and smoking status, menopausal status, and medication use recorded. Fasting total cholesterol, high-density lipoprotein cholesterol, triglycerides, and glucose were measured in an accredited laboratory.
Hemodynamic Measurements
Hemodynamic measurements were performed as previously described.5 Radial and carotid pressure waveforms were obtained by applanation tonometry performed by an experienced operator using the SphygmoCor system (AtCor, Australia). Approximately 10 cardiac cycles were ensemble averaged. Waveforms that did not meet the in-built quality control criteria in the SphygmoCor system were rejected. Brachial BP was measured in triplicate by a validated oscillometric method (Omron 705CP, Omron Health Care, Japan) immediately before measurements of tonometry and used to calibrate radial waveforms and thus to obtain a mean arterial pressure through integration of the radial waveform. Carotid waveforms were calibrated from mean arterial pressure and diastolic brachial BP on the assumption of equality of these pressures at central and peripheral sites.13 Carotid-femoral PWV was calculated from sequential recordings of the carotid and femoral artery pressure waveforms using the same SphygmoCor device and transducer. Difference in time of pulse arrival between the 2 sites referenced to the R wave of the ECG was taken as the transit time. Path length between these 2 sites was estimated from the distance between the sternal notch and femoral artery at the point of applanation and PWV calculated as the quotient of path length and transit time. Measurements were made in triplicate, and mean values were used for analysis. Ultrasound imaging was performed by an experienced operator using a Siemens CV70 ultrasound system (Acuson-Siemens Corp, California) before 2010 and later Vivid-7 ultrasound platform (General Electric Healthcare, UK). Flow velocity in the left ventricular outflow tract (LVOT) was recorded using pulsed wave Doppler obtained from an apical 5-chamber view. All ultrasound measurements were averaged over at least 3 cardiac cycles. Ultrasound measurements were obtained immediately after measurements of BP and tonometry.
Waveform Postprocessing
Ensemble-averaged carotid pressure was used as surrogate for ascending aortic pressure.14 This together with LVOT flow velocity was processed offline using custom software written in MATLAB (MathWorks, Natick). The first systolic shoulder/peak of the aortic pressure waveform was identified as the first local minimum of the first derivative of the pressure curve (and confirmed by visual inspection by an observer blinded to the results) to determine P1 and AP as the difference between pulsatile pressure at the second systolic peak (P2) and that at P1. Augmentation index was calculated as: AP/cPP×100%. LVOT flow velocity was multiplied by LVOT cross-sectional area to obtain the aortic flow. Ejection volumes (V1 and V2) corresponding to timing of P1 and P2 (T1 and T2) were obtained by integration of the aortic flow waveform from the start of systole to T1 and T2. Stroke volume (SV) was obtained by integration of aortic flow waveform, and cardiac output (CO) as the product of SV and heart rate. In a sub-sample of subjects, SV was also obtained as the difference between left ventricular end-systolic volume and end-diastolic volume. End-diastolic volume and end-systolic volume were calculated using the formula of Teichholz:  , where D is the maximum minor axis of the left ventricle at end-diastole or end-systole and was measured on the parasternal long-axis or short-axis view.15
Pressure wave decomposition was performed using Parker’s time-domain approach,16 based on conservation of mass and momentum, to obtain forward (Pf) and backward (Pb) pressure components of cPP so that: Pf+Pb=P–Pd, where P is total pressure and Pd is the diastolic pressure. Pf and Pb are given by:  and
and 
Where U is flow velocity, ρ is blood density, and c is PWV which was calculated using the method of the sum-of-squares (PWVss).17 LVOT velocity rather than true aortic flow velocity (which may differ from LVOT velocity because of the change in cross-sectional from LVOT to aorta) was used to calculate both PWVss and Pf and Pb because wave separation is not affected by scaling of velocity (as errors in c and dU in the above equations). Wave intensity, the flux of wave energy per unit area, was calculated as dI=dPdU (again using LVOT velocity) and separated into forward (dIf) and backward (dIb) components: 
Wave intensity is positive for forward waves and negative for those that are traveling in the backward direction. Total wave energy can be obtained by integrating the above equation with respect to time.
Statistics
Subject characteristics and results are presented as means±SD. Subjects were subdivided into groups according to decades of age and those <40 years and >70 years. Comparisons of subject characteristics across groups were made by one-way ANOVA or (for categorical variables) by χ2 test. Multiple regression analysis was used to analyze the relationship between SV, age and BMI and to examine the relationship between aortic flow, ejection volume, and PWV, since previous work has shown that pulse pressure components up to the time of peak flow are explained almost completely by these variables.11 Analysis was performed using SPSS version 22 (SPSS Inc, Chicago, Illinois) and P<0.05 was taken as significant.
Results
Age-Related Change in PWV and Pulse Pressure Components
Characteristics of the study participants and peripheral BPs are presented in Table 1. The women were aged 18 to 91 years, with a mean age of 57 years; 381 (18.7%) were on treatment with antihypertensive drugs, and 246 (12.1%) were on lipid-lowering treatment. Peripheral BP increased with age with a small increase in diastolic BP of 5.3±11.1 mm Hg across the age range <40 to >70 years and a greater increase in peripheral systolic BP of 26.2±20.6 mm Hg, corresponding to an increase in peripheral PP of 20.9±15.6 mm Hg. Changes in PWV and cPP components are summarized by decades of age in Table 2 and in Figure 2. Carotid-femoral PWV increased ≈1.09±0.09 m/s per decade of aging (12.4%; P<0.001, Table 2, Figure 2B) and proximal aortic PWV calculated by the sum-of-squares method increased in parallel with carotid-femoral PWV (Table 2). In all age groups mean values of P2 were >P1 so that mean values of cPP were close to those of P2. P1 and P2 increased approximately linearly across the age range (Figures 2A and 2B) in parallel with PWV but there was a greater increase in P2 (31.1±21.5 mm Hg) compared with P1 (15.0±15.3 mm Hg), corresponding to an increase in AP and augmentation index of 16.0±12.2 mm Hg and 25.4±19.3 %, respectively over the age range. End-systolic pressure (Pes) increased by 17.2±13.5 mm Hg over the age range.
Table 1.
Subject Characteristics
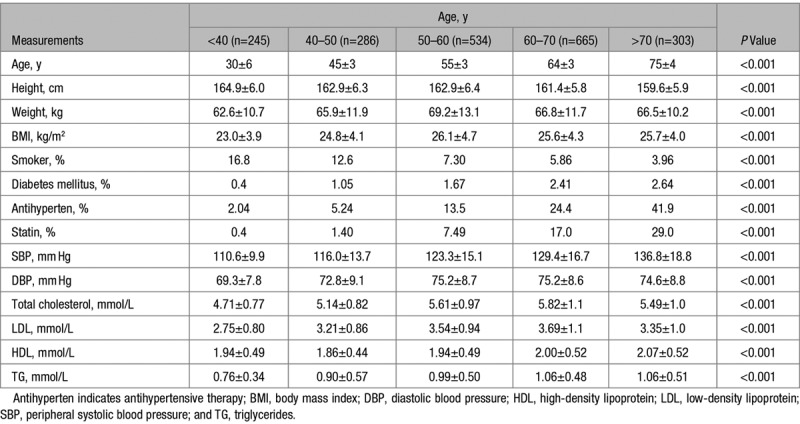
Table 2.
Central Hemodynamics
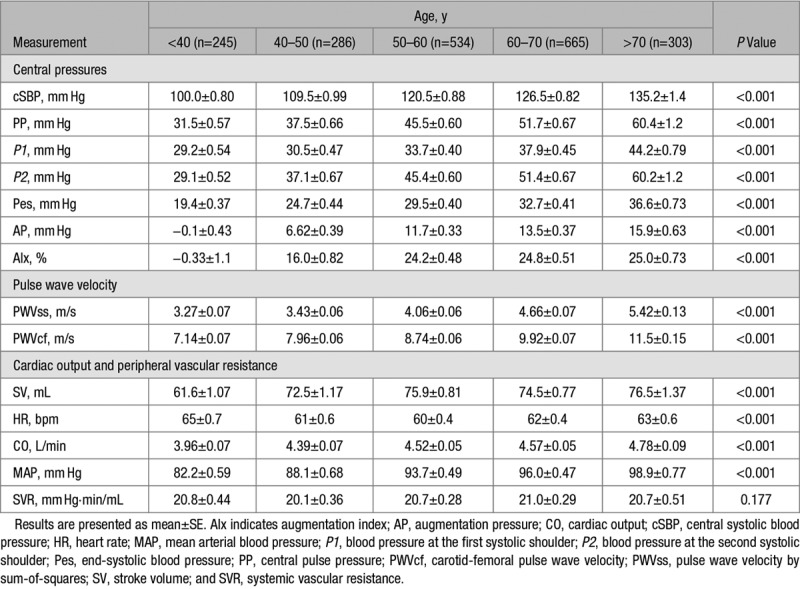
Figure 2.
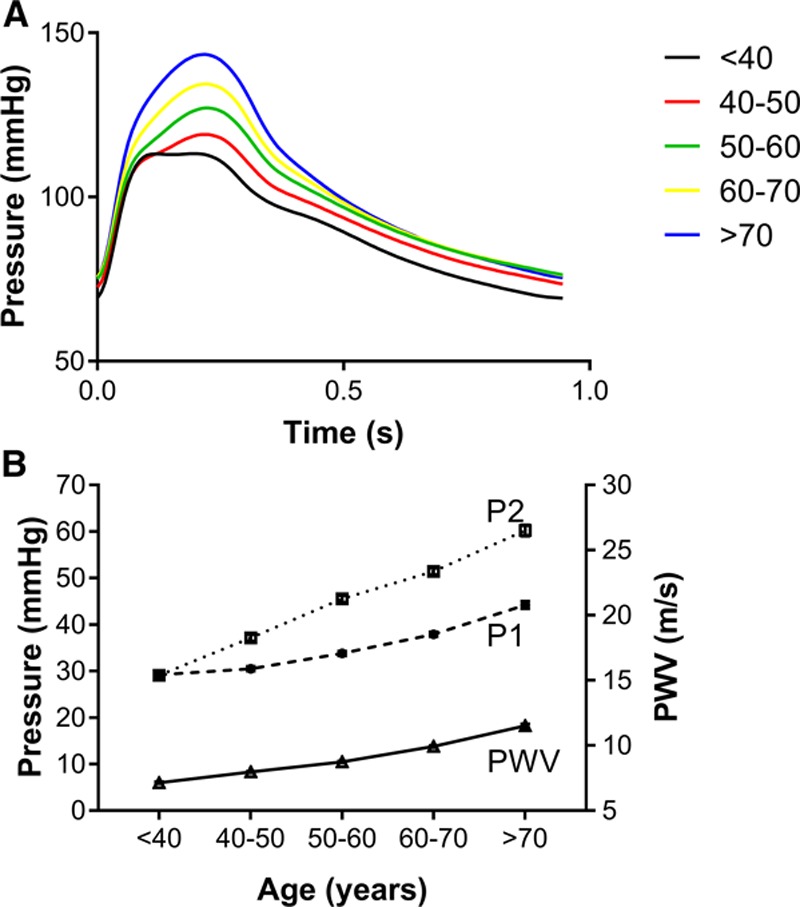
Variation of central pressure and pulse pressure components with age. A, Average central pressure waveforms for age groups <40 to >70 y. B, Relationship of central pulse pressure at first shoulder/peak (P1), second peak (P2), and carotid-femoral pulse wave velocity (PWV) to age.
SV, CO, and Peripheral Vascular Resistance
There was an increase in SV of 14.3±21.9 mL (23%), over the age range <40 to 50–60 (Table 2) that was related to the increase in BMI across this age range (Figure 3, Table S1 in the online-only Data Supplement). In the sub-sample (n=1371) in whom SV was calculated from the difference between LV end-diastolic and end-systolic diameters, there was a difference between the absolute values of SV calculated by integration of the LVOT flow waveform and LV dimensions. However, the relationship between SV and BMI did not differ according to the method for measuring SV and the percentage change with age and BMI was similar irrespective of whether SV was derived from flow velocity or LV volumes, with SV increasing across the range of BMI <25 to >30 by 8.9% and 9.6% as derived by flow velocity and LV volumes, respectively (supplementary Table S1) and the association of SV with BMI when adjusted for age was similar for both methods (standardized β coefficients of 0.13 and 0.15 for SV derived from LVOT flow and LV volumes, respectively). The increase in SV, corresponded to an increase in CO of 0.8 L/min over the total age range (but again limited mainly to the range <40 to 50–60) which accounted for the increase in mean arterial pressure of 13.9 mm Hg over the total age range with systemic vascular resistance remaining constant over the total age range (P=0.177).
Figure 3.
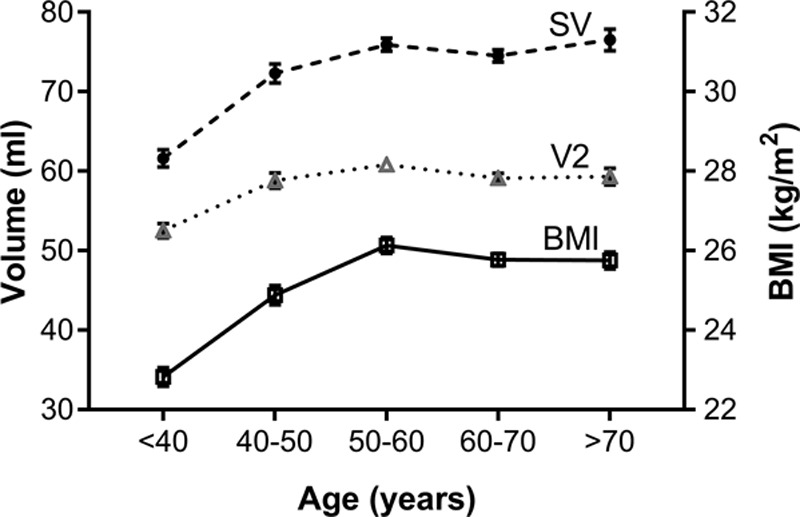
Relationship of stroke volume (SV), ejection volume at time of second pressure peak (V2), and body mass index to age. BMI indicates body mass index.
Characteristics of the Aortic Flow Waveform
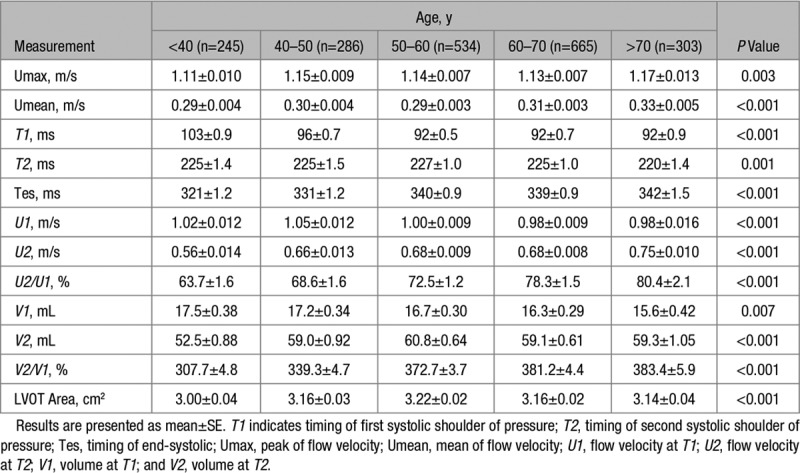
Flow waveform characteristics are presented in Table 3 and Figure S1. LVOT maximum flow velocity (Umax) and mean flow velocity (Umean) both increased with age (by 0.06 and 0.04 m/s respectively, each P<0.005) as did the duration of systole, largely accounting for the increase in SV across the age range. Both T1 and T2 decreased slightly with age. U1 decreased slightly with age but U2 increased with age, and the same trends were seen with ejection volumes V1 and V2. Thus in addition to greater V2 and SV in older subjects, there was an age-related change in the pattern of ejection, with a greater proportion of ejected volume occurring later in systole (Table 3).
Table 3.
Flow Waveform Characteristics
Wave Intensity Analysis
The amplitudes of forward and backward pressure waves and of values of individual forward and backward components of pressure (P1, P2, and Pes) and timings of these are shown in supplementary Table S2. Wave intensities and timing of wave intensity components are shown in supplementary Table S3. P1 and P2 were determined mainly by the forward wave across the age range (Table S2). The backward wave provided a proportionately greater contribution to P2 and Pes than to P1, and this contribution increased across the age range with the contribution of the backward wave to P2 increasing from 6.5±3.5 mm Hg in those <40 years to 13.5±6.8 mm Hg in those >70 years group (P<0.001). The ratio of the backward wave component to the forward wave component of pulse pressure remained approximately constant (Figure S1) although the reflection coefficient (ratio of maximum amplitude of backward to forward wave) tended to increase and then decrease with age (Table S2). The forward wave comprised mainly a forward compression wave with a relatively minor contribution from a forward expansion wave whereas compression and expansion components of the backward wave were of approximately equal magnitude (Table S3). The peak of the forward wave was delayed in systole with increasing age. However, this was due to delay of the expansion wave since the forward compression wave tended to arrive earlier in systole in older compared with younger subjects (Table S3). The backward wave arrived earlier in subjects >70 years compared with those <40 years (104±44 versus 86±34 ms; P<0.001). Both compression and expansion components of the backward wave arrived earlier in older compared with younger subjects (Table S3).
Determinants of cPP
In multiple regression analysis, investigating flow velocity, ejection volume, and carotid-femoral PWV as potential determinants of pressure, P1 was independently correlated to PWV and U1 (standardized, β 0.47 and 0.04 respectively, P<0.001 and P=0.030, respectively on backward stepwise regression incorporating PWV, U1 and V1 as potential explanatory variables, Table S4) but not with V1. P2 was independently correlated with PWV and V2 (standardized β 0.49 and 0.13 respectively, each P<0.001) but not with U2. Findings were similar when the analysis was restricted to subjects untreated with antihypertensive drugs (β=0.44 and 0.05 for relationships of P1 with PWV and U1 respectively, P<0.001 and P=0.021 respectively, and β=0.49 and 0.14 for relationships of P2 with PWV and V2 respectively, each P<0.001). The ratio of P2/P1 was thus correlated with the morphology of the flow waveform V2/U1, and age-related changes in P2/P1 mirrored those in V2/U1 (Figure 1D).
Discussion
Understanding the hemodynamic basis of the age-related increase in pulse pressure is key to targeting appropriate treatment strategies to prevent and treat the large burden of cardiovascular disease associated with hypertension in middle-aged to older persons. The present study confirms previous observations of an age-related increase in cPP with a substantial component of this due to an increase in AP.6,7 It also confirms previous findings that the increase in augmentation index is not explained by an earlier arrival or increased amplitude of the backward wave relative to that of the forward wave, as evidenced by the reflection coefficient changing little with age and the contribution of the backward wave to components of pulse pressure remaining approximately proportional to that of the forward wave. AP can be influenced by ventricular dynamics, and an alternative explanation for the age-related increase in AP is an altered pattern of ventricular ejection. The novel findings of the present study are that the increase in AP with age is best explained by the ratio of ventricular ejection volume V2 to ejection velocity U1. Although examining associations cannot determine causality, these associations together with previous work support the conclusion that V2/U1 is a major determinant of AP. U1 falls slightly with age but V2 increases with age/BMI. Our results suggest, therefore, that the age-related increase in cPP is predominantly driven by an increase in PWV, which accounts for almost all of the increase in P1. The increase of P2 above P1 is determined by increased ejection volume, V2, at the time of P2 associated with a change in the pattern of ejection with a greater proportion of ejected volume occurring after T1 in older subjects. We have previously observed a shift towards a later sustained ventricular ejection associated with delayed relaxation of the ventricle in patients with hypertension. This can be explained by a reduction in first-phase ejection fraction, with ejection sustained to maintain overall ejection fraction and SV, through a reverse of the shortening-deactivation phenomenon.18 This mechanism could contribute to the altered pattern of ventricular emptying we observed in present study, and it is notable that the delay of the forward expansion wave driven by ventricular braking would be consistent with this effect. Delayed ventricular ejection could result from a primary cardiac phenomenon or be secondary to an increase in dynamic afterload characterized by increased aortic PWV. Such a delay in ventricular ejection would not, however, be expected to account for the increase in overall SV and it is more likely that this was driven mainly by increased BMI. The age-related increase in V2, was closely related to that in overall SV and occurred up to the age of 60 years in parallel with an increase in BMI, which tended to plateau after this age, as observed in other population studies.19 We demonstrated an independent relationship of SV with BMI that is well established and thought to be because of the need for CO to meet metabolic demands20,21 and thus it is likely that an age-related increase in BMI is a determinant of that in V2 and overall SV. However, conclusions regarding causality cannot be inferred from this cross-sectional study and interventional studies will be required to examine the relative influence of BMI on cPP components.
Our study is subject to a number of important limitations, we studied only female twins from the Twins UK cohort and although these are representative of the general female population in the UK, the extent to which the present findings apply in men requires evaluation in other cohorts. Our study is focused on central rather than peripheral pulse pressure because of its close relationship to central hemodynamics and left ventricular dynamic load and because it is a determinant of peripheral BP. Central pressure is at least as closely related to adverse outcomes as peripheral pressure22 and, in older subjects, differences between central and peripheral pressure are relatively modest.23 Measurements of pressure and flow were obtained noninvasively, were not simultaneous and both direct measurements and derived measurements are inevitably subject to experimental error. Such errors are, however, likely to be random and unlikely to influence relationships with age. Calibration of central BP from peripheral BP is known to be subject to error, and the method used in the present study (widely used when the study was designed) causes an under-estimation of central pressure because of brachial-radial amplification. However the relationship of P2 to P1 is not affected by calibration. Measurements of LVOT velocity and calculation of aortic flow are subject to error but the finding of similar trends with age when SV was obtained from flow and from ventricular dimensions suggests that such error would have been unlikely to influence relationships with age. Aortic flow velocity (but not flow) differs from LVOT velocity because of the change in cross-sectional area from LVOT to aorta but provided that the same velocity is used to calculate PWVss and wave separation this does not affect values or timings of forward and backward pressure waves. It does have an influence on wave intensity but wave intensity did not inform our major conclusions. Finally, it should be stressed that relationships between pulsatile central pressure components, aortic stiffness, and ventricular ejection dynamics will depend on the serial distribution of PWV and diameter along the aortic tree since P1 is dependent on proximal aortic PWV and P2 on the compliance associated with the elasticity and diameter of the aorta and proximal arterial tree and that the latter is incompletely captured by PWV.12 More detailed measurements of regional aortic structure and function that are possible with ultrasound will be required to fully characterize the relationship between pulsatile components of pressure and aortic structure and function.
Perspectives
The present study confirms the importance of aortic stiffening in contributing to increased pulsatility of central BP, particularly early in systole. In addition to arterial properties it identifies ventricular dynamics as a key determinant of the relation between early and late systolic pulsatile components of pressure. Conditions and drugs that influence cardiac function may, therefore, influence pulse wave morphology independent of arterial function. SV is an important determinant of cPP, and the increase in cPP can be explained by an increase in SV occurring in parallel with that of BMI. Interventions to decrease SV (eg, weight reduction) and modulate ventricular dynamics might be useful in addition to reducing aortic stiffness in preventing/treating systolic hypertension.
Conclusions
This population study in the Twins UK cohort suggests that, in middle-aged to older women, the age-related increase in cPP results from an increase in aortic stiffness, sustained ventricular ejection and an increase in SV that parallels that in BMI. The age-related change in morphology of the central pressure waveform, in particular the increase in the AP, relates to sustained ventricular ejection and an altered pattern of ventricular ejection.
Sources of Funding
This work was funded by the British Heart Foundation (special project grant SP/12/4/29573, project grant PG/17/50/32903), supported by the Wellcome EPSRC Centre for Medical Engineering at King’s College London (WT 203148/Z/16/Z), and contributed to the AIM HY (Ancestry and biological Informative Markers in stratification of HYpertension) stratified medicines programme in hypertension funded by the Medical Research Council and the British Heart Foundation. TwinsUK is funded by the Wellcome Trust, Medical Research Council, European Union, the National Institute for Health Research (NIHR)-funded BioResource, Clinical Research Facility and Biomedical Research Centre based at Guy’s and St Thomas’ NHS Foundation Trust in partnership with King’s College London. The work was also supported by the NIHR Cardiovascular MedTech Co-operative at Guy’s and St Thomas’ NHS Foundation Trust.
Disclosures
None.
Supplementary Material
Footnotes
The online-only Data Supplement is available with this article at https://www.ahajournals.org/doi/suppl/10.1161/HYPERTENSIONAHA.118.12402.
Novelty and Significance
What Is New
Age-related change in morphology of the upstroke of the central aortic blood pressure waveform in women, augmentation pressure in particular, is explained by sustained ventricular ejection and increase in stroke volume associated with aging and weight gain.
What Is Relevant
Conditions and drugs that influence cardiac function may influence pulse wave morphology independent of arterial function. Stroke volume is an important determinant of central pulse pressure and the increase in central pulse pressure can be explained by an increase in stroke volume occurring in parallel with that of body mass index. Since drugs with a specific action to reduce arterial stiffness are not yet available, interventions to decrease stroke volume (eg, weight reduction) and modulate ventricular dynamics might be useful in preventing/treating systolic hypertension.
Summary
Understanding the hemodynamic basis of the age-related increase in pulse pressure is key to targeting appropriate treatment strategies to prevent and treat the large burden of cardiovascular disease associated with hypertension in middle-aged to older persons. This population study in the Twins UK cohort suggests that, in middle-aged to older women, the age-related increase in central pulse pressure results from an increase in aortic stiffness, sustained ventricular ejection, and an increase in stroke volume that parallels that in body mass index. The age-related change in morphology of the central pressure waveform, in particular, the increase in the augmentation pressure, relates to sustained ventricular ejection and an altered pattern of ventricular ejection.
References
- 1.Franklin SS, Gustin W, IV, Wong ND, Larson MG, Weber MA, Kannel WB, Levy D. Hemodynamic patterns of age-related changes in blood pressure. The Framingham Heart Study. Circulation. 1997;96:308–315. doi: 10.1161/01.cir.96.1.308. [DOI] [PubMed] [Google Scholar]
- 2.Franklin SS, Lopez VA, Wong ND, Mitchell GF, Larson MG, Vasan RS, Levy D. Single versus combined blood pressure components and risk for cardiovascular disease: the Framingham Heart Study. Circulation. 2009;119:243–250. doi: 10.1161/CIRCULATIONAHA.108.797936. doi: 10.1161/CIRCULATIONAHA.108.797936. [DOI] [PMC free article] [PubMed] [Google Scholar]
- 3.O’Rourke MF, Nichols WW. Aortic diameter, aortic stiffness, and wave reflection increase with age and isolated systolic hypertension. Hypertension. 2005;45:652–658. doi: 10.1161/01.HYP.0000153793.84859.b8. doi: 10.1161/01.HYP.0000153793.84859.b8. [DOI] [PubMed] [Google Scholar]
- 4.Mitchell GF. Arterial stiffness: insights from Framingham and Iceland. Curr Opin Nephrol Hypertens. 2015;24:1–7. doi: 10.1097/MNH.0000000000000092. doi: 10.1097/MNH.0000000000000092. [DOI] [PubMed] [Google Scholar]
- 5.Fok H, Guilcher A, Brett S, Jiang B, Li Y, Epstein S, Alastruey J, Clapp B, Chowienczyk P. Dominance of the forward compression wave in determining pulsatile components of blood pressure: similarities between inotropic stimulation and essential hypertension. Hypertension. 2014;64:1116–1123. doi: 10.1161/HYPERTENSIONAHA.114.04050. doi: 10.1161/HYPERTENSIONAHA.114.04050. [DOI] [PubMed] [Google Scholar]
- 6.Cecelja M, Jiang B, Spector TD, Chowienczyk P. Progression of central pulse pressure over 1 decade of aging and its reversal by nitroglycerin a twin study. J Am Coll Cardiol. 2012;59:475–483. doi: 10.1016/j.jacc.2011.10.871. doi: 10.1016/j.jacc.2011.10.871. [DOI] [PubMed] [Google Scholar]
- 7.Mitchell GF, Wang N, Palmisano JN, Larson MG, Hamburg NM, Vita JA, Levy D, Benjamin EJ, Vasan RS. Hemodynamic correlates of blood pressure across the adult age spectrum: noninvasive evaluation in the Framingham Heart Study. Circulation. 2010;122:1379–1386. doi: 10.1161/CIRCULATIONAHA.109.914507. doi: 10.1161/CIRCULATIONAHA.109.914507. [DOI] [PMC free article] [PubMed] [Google Scholar]
- 8.O’Rourke MF, Adji A. An updated clinical primer on large artery mechanics: implications of pulse waveform analysis and arterial tonometry. Curr Opin Cardiol. 2005;20:275–281. doi: 10.1097/01.hco.0000166595.44711.6f. [DOI] [PubMed] [Google Scholar]
- 9.Torjesen AA, Wang N, Larson MG, Hamburg NM, Vita JA, Levy D, Benjamin EJ, Vasan RS, Mitchell GF. Forward and backward wave morphology and central pressure augmentation in men and women in the Framingham Heart Study. Hypertension. 2014;64:259–265. doi: 10.1161/HYPERTENSIONAHA.114.03371. doi: 10.1161/HYPERTENSIONAHA.114.03371. [DOI] [PMC free article] [PubMed] [Google Scholar]
- 10.Fok H, Guilcher A, Li Y, Brett S, Shah A, Clapp B, Chowienczyk P. Augmentation pressure is influenced by ventricular contractility/relaxation dynamics: novel mechanism of reduction of pulse pressure by nitrates. Hypertension. 2014;63:1050–1055. doi: 10.1161/HYPERTENSIONAHA.113.02955. doi: 10.1161/HYPERTENSIONAHA.113.02955. [DOI] [PubMed] [Google Scholar]
- 11.Vennin S, Mayer A, Li Y, Fok H, Clapp B, Alastruey J, Chowienczyk P. Noninvasive calculation of the aortic blood pressure waveform from the flow velocity waveform: a proof of concept. Am J Physiol Heart Circ Physiol. 2015;309:H969–H976. doi: 10.1152/ajpheart.00152.2015. doi: 10.1152/ajpheart.00152.2015. [DOI] [PMC free article] [PubMed] [Google Scholar]
- 12.Vennin S, Li Y, Willemet M, Fok H, Gu H, Charlton P, Alastruey J, Chowienczyk P. Identifying hemodynamic determinants of pulse pressure: a combined numerical and physiological approach. Hypertension. 2017;70:1176–1182. doi: 10.1161/HYPERTENSIONAHA.117.09706. doi: 10.1161/HYPERTENSIONAHA.117.09706. [DOI] [PubMed] [Google Scholar]
- 13.Pauca AL, Wallenhaupt SL, Kon ND, Tucker WY. Does radial artery pressure accurately reflect aortic pressure? Chest. 1992;102:1193–1198. doi: 10.1378/chest.102.4.1193. [DOI] [PubMed] [Google Scholar]
- 14.Chen CH, Ting CT, Nussbacher A, Nevo E, Kass DA, Pak P, Wang SP, Chang MS, Yin FC. Validation of carotid artery tonometry as a means of estimating augmentation index of ascending aortic pressure. Hypertension. 1996;27:168–175. doi: 10.1161/01.hyp.27.2.168. [DOI] [PubMed] [Google Scholar]
- 15.Wandt B, Bojö L, Tolagen K, Wranne B. Echocardiographic assessment of ejection fraction in left ventricular hypertrophy. Heart. 1999;82:192–198. doi: 10.1136/hrt.82.2.192. [DOI] [PMC free article] [PubMed] [Google Scholar]
- 16.Parker KH, Jones CJ. Forward and backward running waves in the arteries: analysis using the method of characteristics. J Biomech Eng. 1990;112:322–326. doi: 10.1115/1.2891191. [DOI] [PubMed] [Google Scholar]
- 17.Davies JE, Whinnett ZI, Francis DP, Willson K, Foale RA, Malik IS, Hughes AD, Parker KH, Mayet J. Use of simultaneous pressure and velocity measurements to estimate arterial wave speed at a single site in humans. Am J Physiol Heart Circ Physiol. 2006;290:H878–H885. doi: 10.1152/ajpheart.00751.2005. doi: 10.1152/ajpheart.00751.2005. [DOI] [PubMed] [Google Scholar]
- 18.Gu H, Li Y, Fok H, Simpson J, Kentish JC, Shah AM, Chowienczyk PJ. Reduced first-phase ejection fraction and sustained myocardial wall stress in hypertensive patients with diastolic dysfunction: a manifestation of impaired shortening deactivation that links systolic to diastolic dysfunction and preserves systolic ejection fraction. Hypertension. 2017;69:633–640. doi: 10.1161/HYPERTENSIONAHA.116.08545. doi: 10.1161/HYPERTENSIONAHA.116.08545. [DOI] [PMC free article] [PubMed] [Google Scholar]
- 19.Craig R, Fuller E, Mindell J, editors. Chaper 9, adult obesity and overweight. Vol. 2015. London: 2014. Health Survey For England. [Google Scholar]
- 20.Messerli FH, Ventura HO, Reisin E, Dreslinski GR, Dunn FG, MacPhee AA, Frohlich ED. Borderline hypertension and obesity: two prehypertensive states with elevated cardiac output. Circulation. 1982;66:55–60. doi: 10.1161/01.cir.66.1.55. [DOI] [PubMed] [Google Scholar]
- 21.Messerli FH, Sundgaard-Riise K, Reisin ED, Dreslinski GR, Ventura HO, Oigman W, Frohlich ED, Dunn FG. Dimorphic cardiac adaptation to obesity and arterial hypertension. Ann Intern Med. 1983;99:757–761. doi: 10.7326/0003-4819-99-6-757. [DOI] [PubMed] [Google Scholar]
- 22.Vlachopoulos C, Aznaouridis K, O’Rourke MF, Safar ME, Baou K, Stefanadis C. Prediction of cardiovascular events and all-cause mortality with central haemodynamics: a systematic review and meta-analysis. Eur Heart J. 2010;31:1865–1871. doi: 10.1093/eurheartj/ehq024. doi: 10.1093/eurheartj/ehq024. [DOI] [PubMed] [Google Scholar]
- 23.Herbert A, Cruickshank JK, Laurent S, Boutouyrie P Reference Values for Arterial Measurements Collaboration. Establishing reference values for central blood pressure and its amplification in a general healthy population and according to cardiovascular risk factors. Eur Heart J. 2014;35:3122–3133. doi: 10.1093/eurheartj/ehu293. doi: 10.1093/eurheartj/ehu293. [DOI] [PubMed] [Google Scholar]


