

Abstract
BACKGROUND & AIMS:
Although treatment of hepatitis C virus (HCV) infection has improved, the prevalence of alcoholic liver disease (ALD) has been increasing, so we need an updated estimate of the burden and etiology-specific mortality of chronic liver diseases. We studied trends in age-standardized mortality of chronic liver diseases in adults at least 20 years old in the United States from 2007 through 2016.
METHODS:
We collected data from the US Census and National Center for Health Statistics mortality records and identified individuals with HCV infection, ALD, nonalcoholic fatty liver disease, or hepatitis B virus infection using ICD-10 codes. We obtained temporal mortality rate patterns using joinpoint trend analysis with estimates of annual percentage change (APC).
RESULTS:
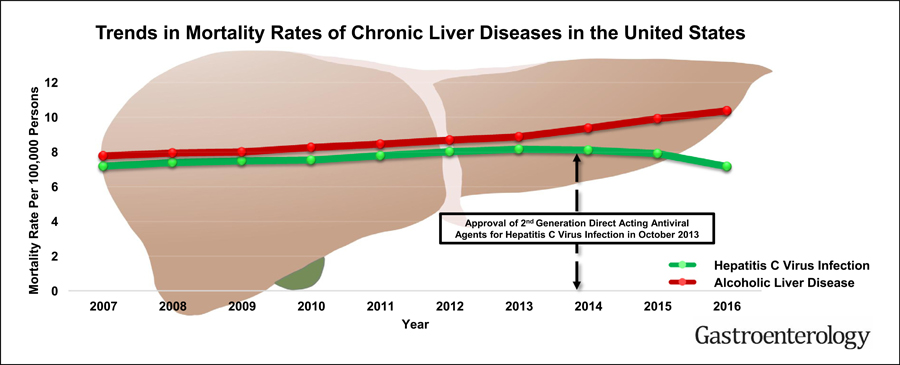
Age-standardized HCV-related mortality increased from 7.17 per 100,000 persons in 2007 to 8.14 per 100,000 persons in 2013, followed by a marked decrease in the time period at which patients began receiving treatment with direct-acting antiviral agents (from 8.09 per 100,000 persons in 2014 to 7.15 per 100,000 persons in 2016). The APC in HCV mortality increased 2.0%/year from 2007 through 2014 but decreased 6.4%/year from 2014 through 2016. In contrast, age-standardized mortality increased for ALD (APC 2.3% from 2007 through 2013 and APC 5.5% from 2013 through 2016) and nonalcoholic fatty liver disease (APC 6.1% from 2007 through 2013 and APC 11.3% from 2013 through 2016). Mortality related to hepatitis B virus decreased steadily from 2007 through 2016, with an average APC of −2.1% (95% CI −3.0 to −1.2). Etiology-based mortality in minority populations was higher. HCV-related mortality (per 100,000 persons) was highest in non-Hispanic blacks (10.28) and whites (6.92), followed by Hispanics (5.94), and lowest in non-Hispanic Asians (2.33). Non-Hispanic Asians had higher mortality for hepatitis B virus infection (2.82 per 100,000 vs 1.02 for non-Hispanic blacks and 0.47 for non-Hispanic whites).
CONCLUSION:
In our population-based analysis of chronic liver disease mortality in the United States, the decrease in HCV-related mortality coincided with the introduction of direct-acting antiviral therapies, whereas mortality from ALD and nonalcoholic fatty liver disease increased during the same period. Minorities in the United States have disproportionately higher mortality related to chronic liver disease.
Keywords: Direct-Acting Antiviral, Alcohol-Related Liver Disease, Steatosis, National Center for Health Statistics
Graphical abstract
Globally, it is estimated that 71 million people are chronically infected with the hepatitis C virus (HCV).1 The prevalence of chronic HCV infection in the United States is estimated to be 2.7–5.2 million,2,3 with the prevalence of cirrhosis secondary to HCV infection increasing from 6.6% to 17.0% over the past 2 decades.4 The Global Burden of Disease Study showed that absolute deaths attributable to HCV infection increased dramatically from 303,000 in 1990 to 704,000 in 2013.5 By 2007, HCV-related deaths surpassed those related to the human immunodeficiency virus in the United States.6 In late 2013, the US Food and Drug Administration approved sofosbuvir, a potent and safe direct-acting antiviral (DAA) agent, heralding a revolutionary era in the treatment of chronic HCV infection. Given the better tolerability and high rates of sustained virologic response achieved with DAA agents in HCV-infected patients with advanced hepatic fibrosis and/or cirrhosis,7,8 we hypothesized that treatment of HCV infection with DAA-based regimens would result in an improved survival benefit compared with interferon-based regimens or regimens including first-generation protease inhibitors. In contrast to chronic HCV infection, alcoholic liver disease (ALD) has been increasing in prevalence in the setting of ineffective medical treatment options and represents an estimated 3.8% of global mortality.9 In the United States, age- and sex-adjusted ALD-related mortality (per 100,000 persons) decreased from 6.9 in 1980 to 4.4 in 2003.10 However, a recent National Institute of Alcoholism and Alcohol Abuse Surveillance Report showed that the death rate from ALD-related cirrhosis was 5.7 per 100,000 persons in 2013, representing an increase of 1.8% from 2012.11 ALD replaced HCV infection as the leading indication for liver transplantation in the United States in 2016.12 There are no recent updated reports on trends in ALD-related national mortality rates. In addition, the increasing prevalence of obesity and diabetes currently affecting 60% of adults in the United States appears to be the main contributor to the increasing prevalence of nonalcoholic fatty liver disease (NAFLD).13,14 Nonalcoholic steatohepatitis (NASH) is one of the fastest growing indications for liver transplantation in the United States and could become the most common indication in the near future.15 Furthermore, despite public health efforts, the overall prevalence of chronic hepatitis B virus (HBV) infection has remained constant since 1999 at approximately 0.3% in the United States.16 HBV-related mortality trends could provide crucial insight into future HCV-related mortality trends and anticipated impact of DAA-based therapy, because potent antiviral therapies to suppress chronic HBV infection have been available since the mid-2000s. It also is important to assess the impact of race- and ethnicity-based differences in the prevalence of chronic liver disease and ensuing mortality in the United States.17 A study examining the race and ethnic variation of advanced liver disease using a multiethnic cohort showed that ALD was the most common cause of cirrhosis in whites, whereas HCV was the leading liver disease in African Americans.17
To determine whether the highly efficacious DAA-based treatment was effective in decreasing the disease burden and mortality associated with chronic HCV infection, we examined HCV-related mortality before and during the DAA era. In addition, we compared temporal trends in HCV-related mortality with other common chronic liver diseases, namely ALD, NAFLD, and HBV. More importantly, we realized that identifying chronic liver disease from the information listed on the death certificate as the underlying cause of death might not be sufficient for estimating national mortality for chronic liver disease for a diagnosis such as NASH, where other conditions can contribute to death (cardiovascular disease, cancer, etc). To summarize, the aims of this population-based study were (1) to examine temporal trends in mortality rates for HCV, ALD, NAFLD, and HBV in the United States from 2007 through 2016 and to discern the impact of DAA-based therapy on HCV mortality rates; (2) to investigate the underlying cause of death in subjects with chronic liver disease; and (3) to determine race- and ethnicity-specific trends and differences in mortality rates based on the etiology of chronic liver disease.
Methods
Study Data
To examine trends in mortality rates related to chronic liver disease in US adults at least 20 years old, stratified by race and ethnicity, we used de-identified death records from the Centers for Disease Control and Prevention (CDC) National Vital Statistics System. These death records were extracted primarily from death certificates. The CDC National Vital Statistics System database captures more than 99% of deaths in US residents in all 50 states and the District of Columbia.18 Data for the population younger than 20 years were unreliable because of the small number of events and therefore were excluded from this analysis. The National Center for Health Statistics uses the International Classification of Diseases, Tenth Revision (ICD-10) to record cause of death on death certificates. The National Center for Health Statistics processes death records to produce an annual national dataset on multiple-cause mortality, which is then made available for public use.19 The database is a file in which each observation is 1 death with the decedent’s demographic characteristics and other factors related to the death. The cause of death from the death certificate is incorporated into 3 fields: underlying cause of death, entity axis, and record axis.6 The underlying cause of death lists the 1 disease or condition that led to death. The entity axis includes all causes of death listed on the death certificate. To improve specificity of the data, the record axis represents a refined version of the entity axis in which redundant conditions are deleted, related conditions are combined for coding efficiency, and causes violating certain logical checks are eliminated. Because of the higher specificity of the record axis, we analyzed the record axis for underlying or contributing causes of death.6 In addition, we categorized the underlying cause of death (cause-specific mortality) in subjects with chronic liver disease. Because all data are publicly available and de-identified, the study was not subject to approval by the institutional review board.
Definitions of Etiologies of Chronic Liver Disease
ICD-10 codes were used to identify etiologies of disease from this database. Chronic HCV infection was identified using the diagnosis codes for HCV infection (B17.1, B18.2, and B19.2). Chronic HBV infection was identified using codes for HBV infection (B16, B17.0, B18.0, B18.1, and B19.1). ICD-10 diagnostic codes were used to identify ALD (K70.0, K70.1, K70.2, K70.3, K70.4, and K70.9) and NAFLD (K76.0 and K75.81). ICD-10 codes were used to identify etiologies of disease from this database using US-specific codes (B19.1 and B19.2). We categorized subjects with HCV infection and ALD as having HCV infection. Likewise, subjects with HBV infection and ALD were categorized as having HBV infection. We defined hepatocellular carcinoma (HCC) as the underlying cause of death using ICD-10 code C22.0. From the wide array of information available in this database, the variables necessary for the analysis included demographic data (age, sex, race and ethnicity, and education status). Age, race and ethnicity, and education were ascertained using standard methods. Race and ethnicity were categorized into 5 mutually exclusive groups: non-Hispanic whites, non-Hispanic blacks, non-Hispanic Asians and Pacific Islanders, and Hispanics (who could be of any race). Data for American Indians and Alaskan natives were unreliable because of the small number of events and therefore were excluded from this analysis. Underlying cause of death was categorized using the following 3 major cause-specific mortalities in subjects with chronic liver disease: (1) liver related (viral hepatitis [ICD-10 codes B15–B19], malignant neoplasms of the liver and intrahepatic bile ducts [C22], chronic liver disease, toxic liver disease, and cirrhosis [K70–K77], sequelae of viral hepatitis [B94.2], ascites [R18], and bleeding esophageal varices [I85.0]); (2) cardiovascular disease related (I00–I99), including ischemic heart disease, heart failure, atherosclerosis, cardiovascular disease, and other diseases of the arteries; and (3) cancer related (C00–C97), including all malignant neoplasms except HCC.
Statistical Analysis
To calculate age-standardized mortality rates, we divided the count of deaths from HCV, ALD, NAFLD, and HBV by the total US census population for each year. Age-standardized mortality rates per 100,000 persons by age group (20–29, 30–39, 40–49, 50–59, 60–69, 70–79, and ≥80 years) and age-standardized mortality rates by race and ethnicity were calculated, standardized to the age distribution of the 2010 US standard population using the direct method. The total population census used to calculate the incidence of mortality was derived from census population estimates from the US Census Bureau. We described demographic characteristics of the study population as frequencies with percentages for categorical variables. To estimate changes in temporal trends over time, we used the National Cancer Institute’s joinpoint regression program (version 4.5.0.1). This program uses a piecewise linear regression approach to determine whether age-standardized mortality rates over time are best explained by a single segment or multiple linear segments.20 This method helps describe trends in mortality rate by connecting several line segments on a logit scale at “joinpoints” and tests for model fit with a maximum of 2 joinpoints. Each trend segment is described by an annual percentage change (APC) and the trend for the entire study period is described by the average APC, which is a summary measurement of trend accounting for transitions within each trend segment. Joinpoint regression identifies a set of joinpoints—the time points (calendar years) at which the change in the slope of the age-standardized mortality rate is statistically significant—and computes the year-to-year percentage change in annual age-standardized mortality rate and the 95% confidence interval (CI) over each linear trend segment between adjacent joinpoints.21 This approach identifies the year when the trend (slope of the increase or decrease) in mortality rate changes significantly and determines the magnitude of the change.
Results
Patient Characteristics
Of US adults at least 20 years old, a total of 25,379,768 deaths on the CDC National Vital Statistics System’s mortality database from 2007 to 2016 were analyzed in this study. Baseline characteristics are presented in Table 1. Deaths from HCV, ALD, and HBV mostly concerned men, whereas a larger percentage of deaths in the NAFLD group concerned women. For racial distributions, although the proportion of non-Hispanic whites was the most frequent in all etiologies of chronic liver disease, non-Hispanic blacks in the HCV and HBV, Hispanics in the ALD and NAFLD, and non-Hispanic Asians in the HBV each represented more than 10% of deaths in their respective etiologies.
Table 1.
Characteristics of Death From Chronic Liver Disease as a Cause of Death in the United States, 2007–2016 (Total Population = 25,379,768)
| Hepatitis C | Alcoholic liver disease | Nonalcoholic fatty liver disease | Hepatitis B | |
|---|---|---|---|---|
| Total | 176,922 | 200,434 | 30,091 | 17,785 |
| Age at death | ||||
| 20–39 y | 3,254 (1.84) | 13,313 (6.64) | 3,250 (10.80) | 875 (4.92) |
| 40–59 y | 97,824 (55.29) | 111,205 (55.48) | 11,490 (38.18) | 8,437 (47.44) |
| ≥60 y | 75,844 (42.87) | 75,916 (37.88) | 15,351 (51.02) | 8,473 (47.64) |
| Ethnicity | ||||
| Non-Hispanic whites | 111,986 (63.67) | 144,490 (72.43) | 23,984 (79.90) | 8,492 (47.99) |
| Non-Hispanic blacks | 31,734 (18.04) | 15,353 (7.70) | 1,734 (5.78) | 3,391 (19.16) |
| Non-Hispanic Asians or Pacific Islander | 4,247 (2.41) | 2,469 (1.24) | 579 (1.93) | 4,193 (23.70) |
| Hispanics | 25,359 (14.42) | 30,244 (15.16) | 3,221 (10.73) | 1,495 (8.45) |
| Sex | ||||
| Men | 125,623 (71.00) | 143,737 (71.71) | 14,489 (48.15) | 13,023 (73.22) |
| Women | 51,299 (29.00) | 56,697 (28.29) | 15,602 (51.85) | 4,762 (26.78) |
| Education | ||||
| Less than high school | 36,226 (25.70) | 34,045 (20.78) | 4,179 (17.03) | 3,688 (26.38) |
| Completed high school | 66,432 (47.13) | 70,589 (43.09) | 10,319 (42.05) | 5,699 (40.77) |
| Some college | 19,863 (14.09) | 26,272 (16.04) | 4,102 (16.71) | 1,695 (12.13) |
| Completed college or beyond | 18,448 (13.09) | 32,900 (20.08) | 5,941 (24.21) | 2,897 (20.7) |
Age-Standardized Mortality Rates for Chronic Liver Disease
Figure 1A presents age-standardized all-cause mortality rates for chronic liver disease. Age-standardized HCV-related mortality rates reached a plateau in 2013 and markedly decreased from 2014 to 2016. Using joinpoint analyses (Table 2), age-standardized mortality rates for HCV infection increased from 2007 to 2014 (APC 2.0%, 95% CI 1.6–2.4) and decreased from 2014 to 2016 (APC −6.4%, 95% CI −9.1 to −3.6). In contrast, there was a linear increase in age-standardized mortality rates for ALD and NAFLD, whereas HBV-related mortality rates continuously decreased over 10 years. As shown in Figure 1B, age-standardized HCV-related mortality rates based on underlying cause of death reached a plateau in 2013 and more markedly decreased from 2014 to 2016 compared with all-cause mortality (APC −13.7 for underlying cause of death vs −6.4 for all-cause mortality). In addition, there was a linear increase in age-standardized mortality rates for ALD and NAFLD, whereas HBV-related mortality rates steadily decreased over 10 years. As presented in Figure 2 and Supplementary Table 1, annual trends in liver-related mortality in subjects with HCV infection markedly decreased from 2013 (67.8%) to 2016 (63.7%), with an annual decrease of 2.2% (95% CI −3.0 to −1.4), whereas annual trends in liver-related mortality in subjects with ALD did not change during the study period. Comparable to previous results, annual trends in liver-related mortality in subjects with HBV infection decreased steadily from 2007 to 2016 (APC −1.0%, 95% CI −1.5 to −0.5). As expected, compared with other chronic liver diseases, the underlying cause of death in subjects with NAFLD was more likely to be cardiovascular disease, which steadily decreased over time, whereas NAFLD-related liver mortality markedly increased in recent years (APC 4.9%, 95% CI 4.2–5.5).
Figure 1.
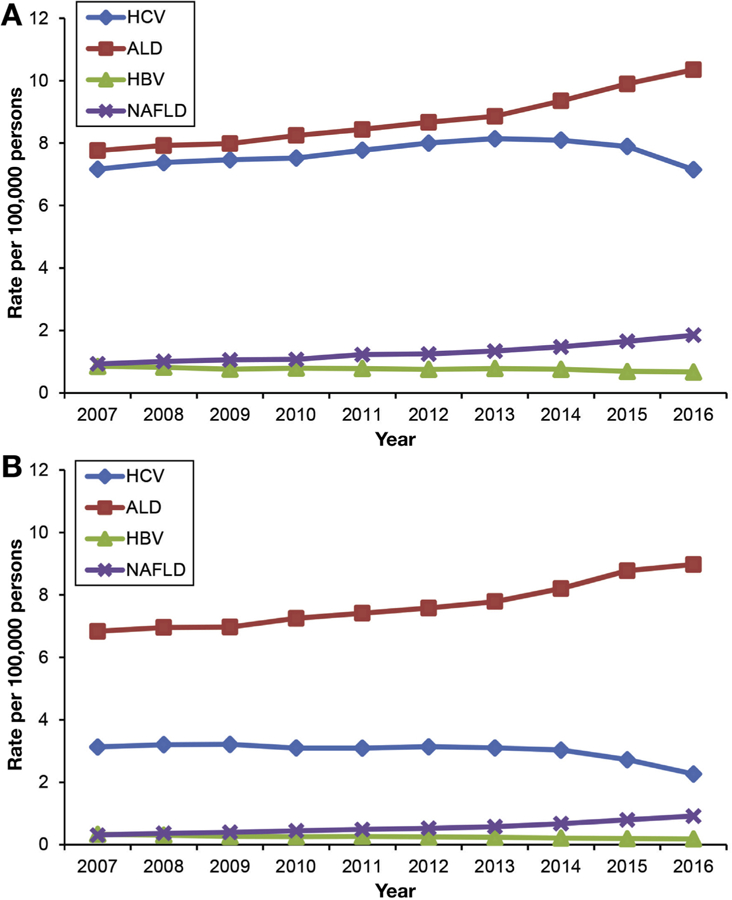
Annual age-standardized mortality rates for chronic liver disease in the United States from 2007 through 2016. (A) All-cause mortality. (B) Underlying cause of death.
Table 2.
Age-Standardized Chronic Liver Disease-Related Mortality Rate and APC in US Adults at Least 20 Years Old in 2007–2016
| Deaths (age-standardized rate), n |
Average APC (95% CI) |
Trend segment 1 |
Trend segment 2 |
||||
|---|---|---|---|---|---|---|---|
| 2007 (2,428,343) |
2016 (2,749,864) |
2007–2016 | Year | APC (95% CI) | Year | APC (95% CI) | |
| All-cause mortalitya | |||||||
| Hepatitis C | 15,106 (7.17) | 18,153 (7.15) | 0.1 (−0.5 to 0.6) | 2007–2014 | 2.0 (1.6–2.4) | 2014–2016 | −6.4 (−9.1 to −3.6) |
| Alcoholic liver disease | 16,383 (7.76) | 25,306 (10.35) | 3.4 (3.0–3.7) | 2007–2013 | 2.3 (1.9–2.7) | 2013–2016 | 5.5 (4.3–6.7) |
| Nonalcoholic fatty liver disease | 1,981 (0.93) | 4,672 (1.85) | 7.8 (6.3–9.4) | 2007–2013 | 6.1 (4.5–7.8) | 2013–2016 | 11.3 (6.3–16.6) |
| Hepatitis B | 1,794 (0.85) | 1,682 (0.68) | −2.1 (−3.0 to−1.2) | ||||
| Underlying cause of death | |||||||
| Hepatitis C | 6,604 (3.13) | 5,749 (2.2|7) | −3.6 (−4.5 to −2.6) | 2007–2014 | −0.4 (−1.2 to 0.3) | 2014–2016 | −13.7 (−18.2 to −9.0) |
| Alcoholic liver disease | 14,453 (6.83) | 21,878 (8.98) | 3.3 (2.7–4.0) | 2007–2013 | 2.3 (1.6–3.1) | 2013–2016 | 5.3 (3.2–7.5) |
| Nonalcoholic fatty liver disease | 649 (0.31) | 2,372 (0.92) | 12.3 (10.6–14.1) | 2007–2013 | 10.5 (8.6–12.4) | 2013–2016 | 16.0 (10.3–22.1) |
| Hepatitis B | 705 (0.34) | 467 (0.19) | −5.6 (−6.8 to −4.4) | ||||
All-cause mortality combined underlying cause of death and contributing causes through the record axis.
Figure 2.

Annual trends in cause-specific underlying cause of death in subjects with chronic liver disease. (A) Hepatitis C virus infection. (B) Alcoholic liver disease. (C) Nonalcoholic fatty liver disease. (D) Hepatitis B virus infection. CVD, cardiovascular disease.
Annual trends in the proportion of HCC-related deaths in subjects with liver-related mortality stratified by etiology of chronic liver disease increased from 2007 to 2016, with an annual increase of 3.7%–5.5% (Supplementary Figure 1). Interestingly, the proportion of HCC-related deaths in subjects with liver-related mortality within the HCV group increased abruptly from 2014, whereas in subjects with HBV infection the HCC-related mortality as a proportion of overall HBV liver-related mortality increased markedly from 2007 to 2010 compared with subjects with ALD and NAFLD (Supplementary Table 2). As presented in Supplementary Figure 2 and Supplementary Table 3, annual trends in non-HCC–related mortality in subjects with HCV infection decreased markedly, with an annual rate of −6.9% (95% −CI 10.0 to −3.7) from 2014 to 2016, whereas annual trends in HCC-related mortality in subjects with HCV did not change during the same period.
Age-Standardized Mortality Rates for Chronic Liver Disease by Race and Ethnicity
Racial and ethnic differences in age-standardized mortality rates for chronic liver disease varied by etiology (Figure 3). In 2016, HCV-related mortality rate (Figure 3A) was highest in non-Hispanic blacks (10.28) and whites (6.92), followed by Hispanics (5.94), and lowest in non-Hispanic Asians (2.33). Compared with the other racial and ethnic groups, non-Hispanic whites had higher mortality rates from ALD (Figure 3B) and NAFLD (Figure 3C). In contrast, non-Hispanic Asians had higher mortality rates for HBV infection (Figure 3D). Trends in HCV-related mortality rates varied by race and ethnicity (Table 3). Mortality rates increased in non-Hispanic whites (APC 2.9%) and blacks (APC 1.2%) from 2007 to 2014 and decreased in non-Hispanic whites (APC−5.6%) and blacks (APC −6.0%) after the introduction of DAA agents. For other racial groups, HCV-related mortality rates decreased annually by 5.5% in Asians and 3.2% in Hispanics over 10 years, with a marked decrease of −11.1% in Asians and −9.9% in Hispanics annually during the DAA era. In contrast, mortality rates for ALD increased steadily across all ethnicities during the study period (Table 4). Age-standardized ALD-related mortality steeply increased in non-Hispanic whites (5.0%) and Hispanics (6.1%), followed by non-Hispanic blacks (4.0%), from 2010 to 2016 (Table 4). Race- and ethnicity-based trends in NAFLD-related mortality rates were disparate (Table 4). Age-standardized mortality rates for NAFLD increased continuously in non-Hispanic whites from 2007 to 2016. Age-standardized NAFLD-related mortality rates increased continuously in Hispanics from 2007 to 2016. Mortality rates remained stable in non-Hispanic blacks from 2007 to 2016. In non-Hispanic Asians, mortality rates initially remained stable from 2007 to 2010, but increased annually by 7.8% from 2010 to 2016. Age-standardized mortality rates for HBV infection decreased steadily across all races and ethnicities from 2007 to 2016 (Table 3).
Figure 3.
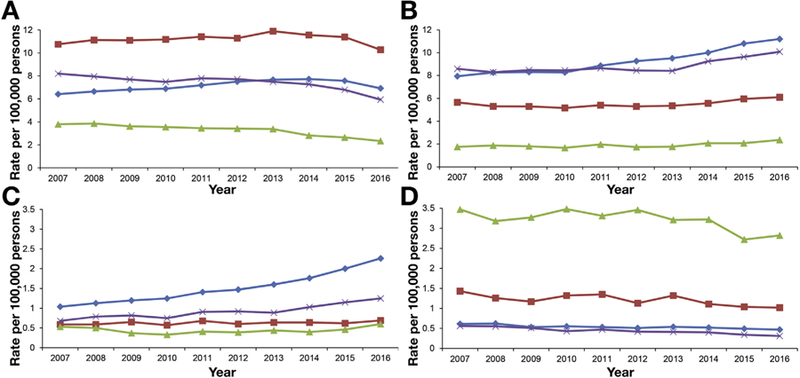
Annual age-standardized and race- and ethnicity-based mortality rates for chronic liver disease in the United States from 2007 through 2016. (A) Hepatitis C virus infection. (B) Alcoholic liver disease. (C) Nonalcoholic fatty liver disease. (D) Hepatitis B virus infection. Blue diamond line, non-Hispanic whites; red square line, non-Hispanic blacks; green triangle line, non-Hispanic Asians; purple × line, Hispanics.
Table 3.
Age-Standardized Viral Hepatitis-Related Mortality Rate and APC in US Adults at Least 20 Years Old According to Ethnicity Status in 2007–2016
| Age-standardized rate |
Average APC (95% CI) |
Trend segment 1 |
Trend segment 2 |
||||
|---|---|---|---|---|---|---|---|
| 2007 | 2016 | 2007–2016 | Year | APC (95% CI) | Year | APC (95% CI) | |
| Hepatitis C | |||||||
| Non-Hispanic whites | 6.41 | 6.92 | 1.0 (0.3–1.6) | 2007–2014 | 2.9 (2.4–3.4) | 2014–2016 | −5.6 (−8.8 to −2.2) |
| Non-Hispanic blacks | 10.76 | 10.28 | −0.4 (−1.4 to 0.6) | 2007–2014 | 1.2 (0.5–1.9) | 2014–2016 | −6.0 (−10.9 to −0.8) |
| Non-Hispanic Asians | 3.79 | 2.33 | −5.5 (−6.5 to −4.4) | 2007–2013 | −2.5 (−3.8 to −1.3) | 2013–2016 | −11.1 (−14.3 to −7.6) |
| Hispanics | 8.19 | 5.94 | −3.2 (−4.7 to −1.6) | 2007–2014 | −1.2 (−2.3 to −0.1) | 2014–2016 | −9.9 (−17.2 to −1.9) |
| Hepatitis B | |||||||
| Non-Hispanic whites | 0.61 | 0.47 | −2.5 (−3.6 to −1.4) | ||||
| Non-Hispanic blacks | 1.43 | 1.02 | −2.9 (−4.8 to −0.9) | ||||
| Non-Hispanic Asians | 3.47 | 2.82 | −1.9 (−3.5 to −0.4) | ||||
| Hispanics | 0.56 | 0.31 | −6.0 (−7.3 to −4.6) | ||||
Table 4.
Age-Standardized ALD or NAFLD-Related Mortality Rate and APC in Adults at Least 20 Years Old According to Ethnicity Status in 2007–2016
| Age-standardized rate |
Average APC (95% CI) |
Trend segment 1 |
Trend segment 2 |
||||
|---|---|---|---|---|---|---|---|
| 2007 | 2016 | 2007–2016 | Year | APC (95% CI) | Year | APC (95% CI) | |
| ALD | |||||||
| Non-Hispanic whites | 7.94 | 11.21 | 3.7 (2.9–4.6) | 2007–2010 | 1.4 (−1.2 to 4.0) | 5.0 (4.1–5.9) | |
| Non-Hispanic blacks | 5.65 | 6.1 | 1.2 (−0.1 to 2.6) | 2007–2012 | −1.0 (−3.1 to 1.1) | 2012–2016 | 4.0 (1.0–7.2) |
| Non-Hispanic Asians | 1.75 | 2.36 | 2.5 (0.5–4.6) | ||||
| Hispanics | 8.59 | 10.09 | 2.1 (1.3–2.9) | 2007–2013 | 0.1 (−0.7 to 1.0) | 2013–2016 | 6.1 (3.4–9.0) |
| NAFLD | |||||||
| Non-Hispanic whites | 1.04 | 2.26 | 8.9 (7.9–10.0) | 2007–2013 | 7.2 (6.1–8.4) | 2013–2016 | 12.4 (9.0–15.9) |
| Non-Hispanic blacks | 0.59 | 0.69 | 1.2 (−0.3 to 2.6) | ||||
| Non-Hispanic Asians | 0.53 | 0.6 | −0.2 (−6.1 to 6.1) | 2007–2010 | −14.6 (−30.0 to 4.2) | 2010–2016 | 7.8 (0.8–15.4) |
| Hispanics | 0.68 | 1.25 | 6.1 (4.3–7.9) | ||||
Discussion
In this analysis of nationally representative data, we examined etiology-based shifting trends in mortality rates of chronic liver disease in the United States. Our analysis demonstrated that since the introduction of DAA agents in the United States, there has been a significant decrease in nationwide HCV-related mortality rates compared with the pre-DAA era. Our data demonstrate that DAA agents have favorably affected HCV-related mortality rates in the United States. In contrast, mortality rates for ALD and NAFLD increased during the 10-year study period, whereas HBV-related mortality steadily decreased.
Previous interferon-based regimens with or without first-generation protease inhibitors demonstrated less than optimal HCV eradication rates and poor tolerance for advanced liver disease. The recent approval of highly efficacious DAA agents with minimal adverse effects has provided therapeutic options for all stages of HCV-related liver disease. Furthermore, the use of DAA agents has been incorporated into the new American Association for the Study of Liver Diseases and Infectious Diseases Society of America guidelines.22 In particular, the widespread use of DAA agents in patients with compensated and decompensated HCV-related cirrhosis may have been crucial in decreasing fatalities associated with end-stage liver disease.23 Therefore, DAA-based regimens circumvent the suboptimal response and adverse effects of interferon-based treatments.24,25 Several studies have shown that DAA agents provide pan-genotypic coverage with a nearly universal sustained virologic response in HCV-infected patients with compensated cirrhosis26,27 and decompensated cirrhosis.25,28 During the DAA era, studies have demonstrated a decrease in patients with a primary diagnosis of HCV infection and end-stage liver disease who are waiting for liver transplantation.29 Although data associating DAA-based treatment with lower HCV-related mortality rates have been lacking, our results clearly document a significant decrease in HCV-related mortality after the introduction of DAA agents in the United States. The management of chronic HCV infection remains challenging, with just 50% of HCV-infected patients having been tested and only 16% having been treated in the United States.30 However, these percentages are likely to be considerably higher in those with HCV-related cirrhosis, a subpopulation at the highest risk of mortality related to chronic liver disease. Because the prevalence of cirrhosis in patients with chronic HCV infection is estimated to range from 20% to 30%,31–33 focused screening in high-risk populations is needed for pre-emptive diagnosis and prompt treatment with DAA-based regimens. For HBV, potent and effective antiviral agents may have resulted in the significant decrease in HBV-related mortality from the decreased incidence of end-stage liver disease and HCC.
In our study, there are several noteworthy national trends noted in patients with chronic liver disease. First, as previously forecasted, our study confirmed the increasing mortality rates in ALD and NAFLD. As a result of the obesity epidemic in the United States, the burden of NAFLD is projected to increase over the next decade.34 A recent study showed that the increased burden of NASH was reflected by an increasing proportion of patients with NASH-related cirrhosis.29 Similarly, ALD-related hospitalization continued to increase from 2002 to 2010 in the United States, and substantial increases in health care costs and usage in hospitalized patients with ALD were observed.35 ALD became the leading indication for liver transplantation in the United States in 2016.12 Because NAFLD and ALD are projected to increase in prevalence in the United States, there is an unmet need in public policy to raise awareness and decrease the disease burden of NAFLD and ALD. Effective policies to curtail the negative impact of alcohol on health have decreased alcohol-related mortality, including mortality associated with ALD.36 For example, alcohol-related mortality in the United Kingdom decreased after the introduction of the alcohol duty escalator but then increased in 2016 after the abolition of this alcohol policy.37 Second, our study demonstrated that minority populations in the United States have a disproportionately higher burden of mortality related to chronic liver disease. Significant differences in mortality rates associated with chronic liver disease and changes over time were noted in non-Hispanic blacks, Hispanics, and non-Hispanic Asians. These include a larger proportion of HCV-related mortality in non-Hispanic blacks, ALD-related mortality in Hispanics, and HBV-related mortality in non-Hispanic Asians. Future studies will need to examine the diversity of chronic liver disease by ethnicity. We observed that the annual trends in HCC-related deaths as a proportion of overall etiology-specific liver-related mortality was more pronounced in individuals with viral hepatitis compared with those with ALD and NAFLD in certain periods (2014–2016 for HCV infection and 2007–2010 for HBV infection). In addition, non-HCC–related mortality in subjects with HCV infection markedly decreased from 2014 onward. These results can be explained in part by the prevention or reversal of cirrhosis-related hepatic decompensation after the introduction of highly efficacious and tolerable antivirals agents: DAA agents in late 2013, entecavir in 2005, and tenofovir disoproxil fumarate in 2008.
The strength of this study is the capture of longitudinal trends and the examination of individual-level data at the national level over a 10-year period. This allowed us to compare population-wide mortality data and gain unique insight into mortality related to chronic liver disease stratified by the etiology of chronic liver disease. We also used recently updated nationally representative mortality data, which enabled us to capture current trends for chronic liver disease. The limitations of our study are as follows. First, the underlying cause of mortality based on death certificates can be subject to misclassification and underestimation. Currently, robust data are lacking to validate death records as a monitoring tool for mortality in patients with chronic liver disease, as exemplified by the small sample size in studies in patients with chronic viral hepatitis, which were further limited by under-reporting on death certificates.38,39 The Framingham Heart Study showed that death certificates were least accurate for subjects older than 85 years and that there was no change in coding accuracy over time.40 We believe that the reporting method has been constant over time and would therefore not explain the temporal trends in chronic liver disease reported in our study. Second, age-standardized mortality rates may not represent actual mortality rates, but these rates were appropriate for comparisons across the population and over time as population distributions changed. Third, the ICD-10 code for NAFLD grossly underestimates the true prevalence of NAFLD. The low rates of NAFLD-related mortality are consistent with significant under-reporting of this etiology on death certificates, leading to an underestimation of the true prevalence of NAFLD when using ICD codes. Such problems can be mitigated when analyzing trends in which underestimation has been assumed to be relatively constant during the study period. Fourth, in the absence of linked data on an individual level, it is difficult to accurately distinguish liver-related deaths from other cause-specific deaths in subjects with chronic liver disease.
In conclusion, after the introduction of DAA-based treatment for chronic HCV infection, HCV-related mortality rates have decreased in the United States compared with the pre-DAA era. The data presented in this study demonstrate the population-level impact of DAA therapy in patients with chronic HCV infection. Mortality rates for ALD and NAFLD continue to increase, with mortality graphs demonstrating a steeper increase in recent years. In contrast, HBV-related mortality has steadily decreased during the same 10-year period. More importantly, minorities in the United States have a disproportionately higher burden of mortality resulting from chronic liver disease. These trends and disparities in mortality associated with chronic liver disease in the United States can be instrumental in steering future health care policies. It is clear that the introduction of oral, highly efficacious, and well-tolerated antiviral agents has improved outcomes in patients with viral hepatitis. However, future challenges with ALD and NAFLD will pose a different set of problems and will necessitate a multidisciplinary approach with a dedicated focus on minorities. Stakeholders and policy makers must pay attention to these ominous trends and disparities in ALD and NAFLD, with future policies focusing on primary prevention, prompt diagnosis, and pre-emptive therapy.
Supplementary Material
WHAT YOU NEED TO KNOW.
BACKGROUND AND CONTEXT
Temporal trends in chronic liver disease-related mortality are needed in the United States (US) against the backdrop of widespread use of direct-acting antiviral (DAA) agents for hepatitis C virus (HCV) infection.
NEW FINDINGS
DAA agents have favorably impacted HCV-related mortality in the US, while mortality for alcoholic liver disease (ALD) and nonalcoholic fatty liver disease (NAFLD) continues to rise. Minorities remain disproportionately disadvantaged.
LIMITATIONS
The reliance on death certificate and ICD-10 codes to determine the cause of mortality may have been conducive to misclassification and underestimation. The retrospective design of the study is also a limitation.
IMPACT
A better understanding of these trends in chronic liver disease-related mortality can be instrumental in steering future healthcare policies to improve linkage-to-care and provide minorities equitable access to medical care.
Acknowledgments
Author contributions: DK and AA were responsible for the study concept and design, acquisition of data, statistical analysis, interpretation of data, drafting of the manuscript, critical revision of the manuscript for important intellectual content, and approval of the final draft manuscript. AAL, CG, MAK, GC, and JSG were responsible for the interpretation of data, drafting of the manuscript, critical revision of the manuscript for important intellectual content, and approval of the final manuscript. All authors were involved in the final approval of the manuscript submitted and have agreed to be accountable for all aspects of the work.
Abbreviations used in this paper:
- ALD
alcoholic liver disease
- APC
annual percentage change
- CDC
Centers for Disease Control and Prevention
- CI
confidence interval
- DAA
direct-acting antiviral
- HBV
hepatitis B virus
- HCC
hepatocellular carcinoma
- HCV
hepatitis C virus
- ICD-10
International Classification of Diseases, Tenth Revision
- NAFLD
nonalcoholic fatty liver disease
- NASH
nonalcoholic steatohepatitis
Footnotes
Conflicts of interest
Authors declare no relevant conflicts of interest.
References
- 1.World Health Organization. Hepatitis C Available at: http://www.who.int/mediacentre/factsheets/fs164/en/. Accessed April 2018.
- 2.Denniston MM, Jiles RB, Drobeniuc J, et al. Chronic hepatitis C virus infection in the United States, National Health and Nutrition Examination Survey 2003 to 2010. Ann Intern Med 2014;160:293–300. [DOI] [PMC free article] [PubMed] [Google Scholar]
- 3.Chak E, Talal AH, Sherman KE, et al. Hepatitis C virus infection in USA: an estimate of true prevalence. Liver Int 2011;31:1090–1101. [DOI] [PubMed] [Google Scholar]
- 4.Udompap P, Mannalithara A, Heo NY, et al. Increasing prevalence of cirrhosis among U.S. adults aware or unaware of their chronic hepatitis C virus infection. J Hepatol 2016;64:1027–1032. [DOI] [PMC free article] [PubMed] [Google Scholar]
- 5.Stanaway JD, Flaxman AD, Naghavi M, et al. The global burden of viral hepatitis from 1990 to 2013: findings from the Global Burden of Disease Study 2013. Lancet 2016; 388:1081–1088. [DOI] [PMC free article] [PubMed] [Google Scholar]
- 6.Ly KN, Xing J, Klevens RM, et al. The increasing burden of mortality from viral hepatitis in the United States between 1999 and 2007. Ann Intern Med 2012; 156:271–278. [DOI] [PubMed] [Google Scholar]
- 7.Charlton M, Everson GT, Flamm SL, et al. Ledipasvir and sofosbuvir plus ribavirin for treatment of HCV infection in patients with advanced liver disease. Gastroenterology 2015;149:649–659. [DOI] [PubMed] [Google Scholar]
- 8.Manns M, Samuel D, Gane EJ, et al. Ledipasvir and sofosbuvir plus ribavirin in patients with genotype 1 or 4 hepatitis C virus infection and advanced liver disease: a multicentre, open-label, randomised, phase 2 trial. Lancet Infect Dis 2016;16:685–697. [DOI] [PubMed] [Google Scholar]
- 9.Rehm J, Mathers C, Popova S, et al. Global burden of disease and injury and economic cost attributable to alcohol use and alcohol-use disorders. Lancet 2009; 373:2223–2233. [DOI] [PubMed] [Google Scholar]
- 10.Paula H, Asrani SK, Boetticher NC, et al. Alcoholic liver disease-related mortality in the United States: 1980–2003. Am J Gastroenterol 2010;105:1782–1787. [DOI] [PMC free article] [PubMed] [Google Scholar]
- 11.Yoon YH, Chen CM. Surveillance Report #105. Liver cirrhosis mortality in the United States: national, state, and regional trends, 2000–2013 Available at: https://pubs.niaaa.nih.gov/publications/surveillance105/Cirr13.htm. Published 2016.
- 12.Cholankeril G, Ahmed A. Alcoholic liver disease replaces hepatitis C virus infection as the leading indication for liver transplantation in the United States. Clin Gastroenterol Hepatol 2018;16:1356–1358. [DOI] [PMC free article] [PubMed] [Google Scholar]
- 13.Younossi Z, Henry L. Contribution of alcoholic and nonalcoholic fatty liver disease to the burden of liver-related morbidity and mortality. Gastroenterology 2016; 150:1778–1785. [DOI] [PubMed] [Google Scholar]
- 14.Kim D, Kim WR, Kim HJ, et al. Association between noninvasive fibrosis markers and mortality among adults with nonalcoholic fatty liver disease in the United States. Hepatology 2013;57:1357–1365. [DOI] [PMC free article] [PubMed] [Google Scholar]
- 15.Wong RJ, Aguilar M, Cheung R, et al. Nonalcoholic steatohepatitis is the second leading etiology of liver disease among adults awaiting liver transplantation in the United States. Gastroenterology 2015;148:547–555. [DOI] [PubMed] [Google Scholar]
- 16.Roberts H, Kruszon-Moran D, Ly KN, et al. Prevalence of chronic hepatitis B virus (HBV) infection in U.S. households: National Health and Nutrition Examination Survey (NHANES), 1988–2012. Hepatology 2016;63:388–397. [DOI] [PubMed] [Google Scholar]
- 17.Setiawan VW, Stram DO, Porcel J, et al. Prevalence of chronic liver disease and cirrhosis by underlying cause in understudied ethnic groups: the multiethnic cohort. Hepatology 2016;64:1969–1977. [DOI] [PMC free article] [PubMed] [Google Scholar]
- 18.Murphy SL, Xu J, Kochanek KD, et al. Deaths: final data for 2015. Natl Vital Stat Rep 2017;66:1–75. [PubMed] [Google Scholar]
- 19.Statistics NCfH. Mortality multiple cause-of-death public use record Available at: https://www.cdc.gov/nchs/data/dvs/Multiple_Cause_Record_Layout_2016.pdf. Published 2017.
- 20.Kim HJ, Fay MP, Feuer EJ, et al. Permutation tests for joinpoint regression with applications to cancer rates. Stat Med 2000;19:335–351. [DOI] [PubMed] [Google Scholar]
- 21.Clegg LX, Hankey BF, Tiwari R, et al. Estimating average annual per cent change in trend analysis. Stat Med 2009; 28:3670–3682. [DOI] [PMC free article] [PubMed] [Google Scholar]
- 22.Panel AIHG. Hepatitis C guidance: AASLD-IDSA recommendations for testing, managing, and treating adults infected with hepatitis C virus. Hepatology 2015; 62:932–954. [DOI] [PubMed] [Google Scholar]
- 23.Banerjee D, Reddy KR. Review article: safety and tolerability of direct-acting anti-viral agents in the new era of hepatitis C therapy. Aliment Pharmacol Ther 2016; 43:674–696. [DOI] [PubMed] [Google Scholar]
- 24.Bunchorntavakul C, Reddy KR. Management of hepatitis C before and after liver transplantation in the era of rapidly evolving therapeutic advances. J Clin Transl Hepatol 2014;2:124–133. [DOI] [PMC free article] [PubMed] [Google Scholar]
- 25.Bunchorntavakul C, Tanwandee T. Treatment of chronic hepatitis C in special populations. Gastroenterol Clin North Am 2015;44:883–900. [DOI] [PubMed] [Google Scholar]
- 26.Bourliere M, Bronowicki JP, de Ledinghen V, et al. Ledipasvir-sofosbuvir with or without ribavirin to treat patients with HCV genotype 1 infection and cirrhosis non-responsive to previous protease-inhibitor therapy: a randomised, double-blind, phase 2 trial (SIRIUS). Lancet Infect Dis 2015;15:397–404. [DOI] [PubMed] [Google Scholar]
- 27.Reddy KR, Bourliere M, Sulkowski M, et al. Ledipasvir and sofosbuvir in patients with genotype 1 hepatitis C virus infection and compensated cirrhosis: an integrated safety and efficacy analysis. Hepatology 2015;62:79–86. [DOI] [PubMed] [Google Scholar]
- 28.van der Meer AJ, Veldt BJ, Feld JJ, et al. Association between sustained virological response and all-cause mortality among patients with chronic hepatitis C and advanced hepatic fibrosis. JAMA 2012;308:2584–2593. [DOI] [PubMed] [Google Scholar]
- 29.Goldberg D, Ditah IC, Saeian K, et al. Changes in the prevalence of hepatitis C virus infection, nonalcoholic steatohepatitis, and alcoholic liver disease among patients with cirrhosis or liver failure on the waitlist for liver transplantation. Gastroenterology 2017;152:1090–1099 e1. [DOI] [PMC free article] [PubMed] [Google Scholar]
- 30.Holmberg SD, Spradling PR, Moorman AC, et al. Hepatitis C in the United States. N Engl J Med 2013; 368:1859–1861. [DOI] [PMC free article] [PubMed] [Google Scholar]
- 31.Davis GL, Alter MJ, El-Serag H, et al. Aging of hepatitis C virus (HCV)-infected persons in the United States: a multiple cohort model of HCV prevalence and disease progression. Gastroenterology 2010;138:513–521; e1–6. [DOI] [PubMed] [Google Scholar]
- 32.Gordon SC, Lamerato LE, Rupp LB, et al. Prevalence of cirrhosis in hepatitis C patients in the Chronic Hepatitis Cohort Study (CHeCS): a retrospective and prospective observational study. Am J Gastroenterol 2015;110:1169–1177; quiz 1178. [DOI] [PMC free article] [PubMed] [Google Scholar]
- 33.Kanwal F, Hoang T, Kramer JR, et al. Increasing prevalence of HCC and cirrhosis in patients with chronic hepatitis C virus infection. Gastroenterology 2011; 140:1182–1188 e1. [DOI] [PMC free article] [PubMed] [Google Scholar]
- 34.Younossi ZM, Stepanova M, Afendy M, et al. Changes in the prevalence of the most common causes of chronic liver diseases in the United States from 1988 to 2008. Clin Gastroenterol Hepatol 2011;9:524–530 e1. [DOI] [PubMed] [Google Scholar]
- 35.Jinjuvadia R, Liangpunsakul S, Translational R, et al. Trends in alcoholic hepatitis-related hospitalizations, financial burden, and mortality in the United States. J Clin Gastroenterol 2015;49:506–511. [DOI] [PMC free article] [PubMed] [Google Scholar]
- 36.Sheron N. Alcohol and liver disease in Europe—simple measures have the potential to prevent tens of thousands of premature deaths. J Hepatol 2016;64:957–967. [DOI] [PubMed] [Google Scholar]
- 37.Williams R, Alexander G, Armstrong I, et al. Disease burden and costs from excess alcohol consumption, obesity, and viral hepatitis: fourth report of the Lancet Standing Commission on Liver Disease in the UK. Lancet 2017;391:1097–1107. [DOI] [PubMed] [Google Scholar]
- 38.Thomas AR, Zaman A, Bell BP. Deaths from chronic liver disease and viral hepatitis, Multnomah County, Oregon, 2000. J Clin Gastroenterol 2007;41:859–862. [DOI] [PubMed] [Google Scholar]
- 39.Durante AJ, St Louis T, Meek JI, et al. The mortality burden of chronic liver disease may be substantially underestimated in the United States. Conn Med 2008; 72:389–392. [PubMed] [Google Scholar]
- 40.Lloyd-Jones DM, Martin DO, Larson MG, et al. Accuracy of death certificates for coding coronary heart disease as the cause of death. Ann Intern Med 1998; 129:1020–1026. [DOI] [PubMed] [Google Scholar]
Associated Data
This section collects any data citations, data availability statements, or supplementary materials included in this article.