

Abstract
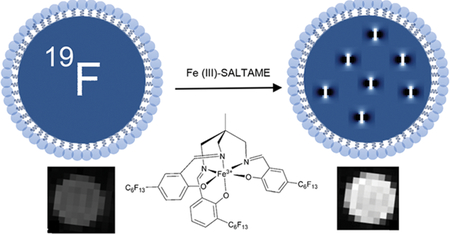
Fluorine-19 MRI is an emerging cellular imaging approach, enabling lucid, quantitative “hot-spot” imaging with no background signal. The utility of 19F-MRI to detect inflammation and cell therapy products in vivo could be expanded by improving the intrinsic sensitivity of the probe by molecular design. We describe a metal chelate based on a salicylidene-tris(aminomethyl)ethane core, with solubility in perfluorocarbon (PFC) oils, and a potent accelerator of the 19F longitudinal relaxation time (T1). Shortening T1 can increase the 19F image sensitivity per time and decrease the minimum number of detectable cells. We used the condensation between the tripodal ligand tris-1,1,1-(aminomethyl)ethane and salicylaldehyde to form the salicylidene-tris(aminomethyl)ethane chelating agent (SALTAME). We purified four isomers of SALTAME, elucidated structures using X-ray scattering and NMR, and identified a single isomer with high PFC solubility. Mn4+, Fe3+, Co3+, and Ga3+ cations formed stable and separable chelates with SALTAME, but only Fe3+ yielded superior T1 shortening with modest line broadening at 3 and 9.4 T. We mixed Fe3+ chelate with perfluorooctyl bromide (PFOB) to formulate a stable paramagnetic nanoemulsion imaging probe and assessed its biocompatibility in macrophages in vitro using proliferation, cytotoxicity, and phenotypic cell assays. Signal-to-noise modeling of paramagnetic PFOB shows that sensitivity enhancement of nearly 4-fold is feasible at clinical magnetic field strengths using a 19F spin-density-weighted gradient-echo pulse sequence. We demonstrate the utility of this paramagnetic nanoemulsion as an in vivo MRI probe for detecting inflammation macrophages in mice. Overall, these paramagnetic PFC compounds represent a platform for the development of sensitive 19F probes.
Keywords: MRI, 19F, metal chelate, perfluorocarbon, nanoemulsion, macrophage, inflammation
Graphical Abstract
For decades, metal chelate chemistry has been the centerpiece in efforts to formulate magnetic resonance imaging (MRI) contrast media. A compelling direction is the use of metal chelates for emerging nonproton imaging approaches such as fluorine-19 MRI.1 19F MRI enables hot-spot imaging with no background signal and quantification of spin-density-weighted images.2,3 19F MRI using perfluorocarbon (PFC) nanoemulsion (NE) probes has been used to detect cell therapy products in vivo (e.g., stem cells and immune cells) that were labeled ex vivo prior to delivery to the subject; these methods have recently been translated into human patients.4 In other uses, PFC probes have been used effectively for imaging leukocyte infiltrates associated with multiple inflammatory diseases.3,5 In this approach, following intravenous injection, the NE droplets are taken up by monocytes and macrophages in situ, and these cells accumulate at sites of inflammation yielding 19F MRI hot-spots.
The utility of this nascent technology could be expanded by improving the sensitivity of 19F detection via molecular design. 19F MRI is limited by the total amount and distribution of fluorine atoms introduced into the subject’s tissue, as well as the amount of PFC that can be safely internalized into cells of interest. Thus, one must improve the intrinsic sensitivity of the PFC molecule. A key parameter for boosting sensitivity is decreasing the high 19F longitudinal relaxation time (T1) of PFC molecules. The T1 value ultimately limits the rate of 19F MRI data acquisition. Generally, 19F imaging requires summation of multiple acquisitions (i.e., signal averaging) to yield a sufficient signal-to-noise ratio (SNR) to gain statistical confidence. A high 19F T1 value generally requires a longer repetition time, thus limiting the number of acquisitions and amount of signal averaging attainable during a fixed total imaging time. Shortening T1 allows more signal averages and thus increases SNR and sensitivity and decreases the minimum number of detectable cells per voxel in the same total scan time.
The intermolecular paramagnetic relaxation enhancement (PRE) mechanism6 can be used to decrease T1 by incorporating paramagnetic centers such as Gd3+ and Fe3+ into or near the fluorous phase.1,7 The strength of the PRE dipole–dipole interaction is inversely proportional to the sixth power (1/r6) of the fluorine–metal distance. Thus, paramagnetic centers bound to the NE surface can be inefficient, due to the long distance between the relaxation agent and the bulk PFC molecules inside the NE droplet. To yield the optimal T1 and T2 (spin–spin relaxation time) with minimal metal added, the paramagnetic center should be dissolved in PFC. However, dissolving the paramagnetic center is challenging due to PFC’s highly hydrophobic and lipophobic nature. Free paramagnetic cations are insoluble in PFC; thus, they must be bound to a fluorous-soluble chelating agent. Previous work has shown that metal-binding β-diketones conjugated to linear perfluoropolyether (PFPE) have solubility in PFCs, and optimal 19F-relaxation occurred when bound to Fe3+, whereas Gd3+ yielded severe line broadening.1
In this study, we present synthesis and characterization of a fluorophilic chelating agent based on a salicylidene-tris-(aminomethyl)ethane core, referred to as SALTAME; these chelates are soluble in PFC and serve as potent PRE agents. We describe the SALTAME structure, physical properties, NMR relaxation times, and the impact of different bound metal cations, NE probe formulation, and characterization of probe-labeled macrophages in vitro. We demonstrate the utility of paramagnetic SALTAME-PFC NE as an in vivo 19F MRI probe for detecting inflammation-associated macrophages in mice. Overall, the creation of paramagnetic NE probes is a chemical synthesis avenue for advancing the field of 19F MRI.
RESULTS AND DISCUSSION
Molecular Design and Synthesis of the SALTAME Complex.
We describe a synthesis scheme for fluorophilic metal chelates. At the design onset, based on prior work,1 we assume transition metals, and Fe3+ in particular, are the best T1 accelerator for PFCs, while paramagnetic lanthanides (e.g., Gd3+) cause severe line broadening, essentially becoming 19F T2 agents.1 Moreover, perfluorooctyl bromide (PFOB) is the preferred 19F-rich MRI signal media for metal chelate dissolution due to its rapid clearance from the body and well-characterized clinical safety profile.8–10
We used (Figure 1) the condensation between tris-1,1,1-(aminomethyl)ethane (TAME) and salicylaldehyde (SAL) to form the tripodal SALTAME, for three reasons: (i) SALTAME is known to be a high-affinity hexadentate chelating agent with three N and three O atoms, capable of binding different paramagnetic cations;11 (ii) with a maximum of three negative charges, a chelated trivalent paramagnetic center (e.g., Fe3+) gives an overall neutral charge that favors solubility in PFCs; (iii) the geometry of the chelate stabilizes the high-spin state of cations, such as S = 5/2 for Fe3+, which maximizes the PRE effect.11 However, an unsubstituted SALTAME chelate (Figures 1 and 5 R1– R6 = H) is insoluble in PFCs due to the simultaneous hydrophobic and lipophobic nature of all PFCs. As PFCs only dissolve highly fluorinated compounds, we sought to append perfluoroalkyl substituents to the SALTAME complex to increase fluorophilicity. We tried the reported photochemical ring alkylation of SA with perfluoroalkyl iodides under basic conditions,12 but it gave a mixture of monoalkylated isomers 3a and 3b and dialkylated isomer 3c, which were difficult to isolate (route 1). Instead, alkylation of bromosalicylaldehydes with heating under basic conditions,13 followed by reductive debromination,14 gave 3a and 3b in much higher yields (route 2). Different isomers of 5a can be obtained by condensation of pure 3a or 3b or their weighed mixtures (1:2 or 2:1 w/w) with TAMEand subsequent addition of ferric chloride and separation of the isomers. Although the SALTAME imines tend to dissociate, their iron complexes are very stable and can be readily isolated using chromatographic methods. Confirmation of their structures was achieved by high-resolution liquid chromatography–mass spectrometry (LC-MS) of 5a, as well as NMR analysis of the respective SALTAME ligands (Figures S1–S3). As expected, incorporation of paramagnetic Fe3+ into SALTAME greatly increases the intrinsic longitudinal and transverse relaxation rates for fluorine NMR of the 5a isomers (Table 1) and perturbs their proton and carbon NMR spectra. Definitive structural assignment of three of the four possible 5a isomers (5a POP, OOO, and PPP) is shown by X-ray crystallography (Figures 2, S4, and S5, respectively).
Figure 1.
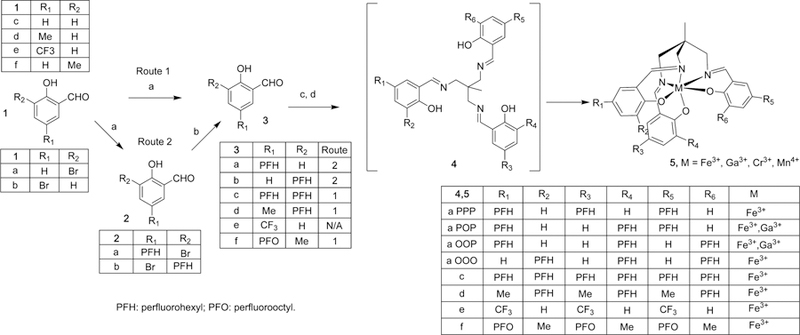
Synthetic scheme for chelating agents. Fe3+-SALTAME chelate 5a POP is used to form P-PFOB. Reagents: (a) perfluoralkyl iodide, CsCO3, DMF, 100 °C; (b) 1 atm of H2, Pd–C, NaOAc, MeOH; (c) TAME, NEt3, EtOH, 80 °C; (d) FeCl3, NaOAc, EtOAc–EtOH.
Figure 5.
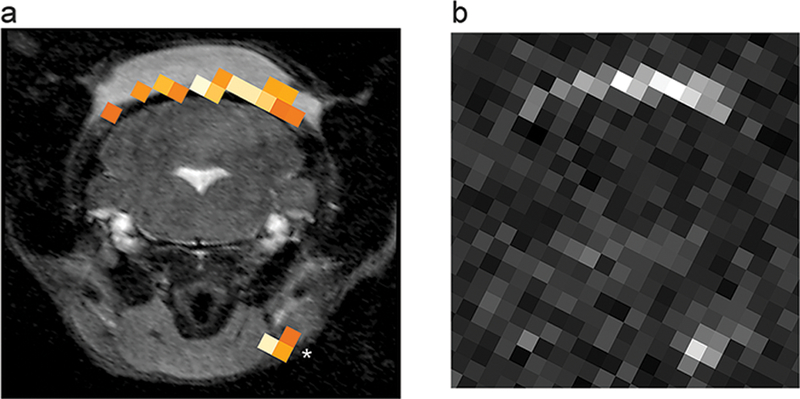
In vivo 1H/19F MRI using P-PFOB NE to visualize inflammation in mice. An LPS-doped Matrigel plug implanted in the subcutaneous tissue of the neck was used to induce localized inflammation. One day after intravenous injection of P-PFOB NE ([Fe3+-SALTAME 5a POP] = 20mMin PFOB oil phase, yielding 4.4 mM in inoculant after P-PFOB NE formulation in water), coronal 1H/19F MRI data of the plug region were acquired. (a) Grayscale 1H showing the hindbrain, cervical spine, and isointense Matrigel in the subcutaneous tissue of the neck. The 19F signal, rendered in pseudocolor, is present in the periphery of the Matrigel plug and nearby lymph node (asterisk), consistent with the presence of inflammatory infiltrates. (b) Raw, unthresholded 19F image. The peak voxel 19F SNR at the Matrigel boundary and lymph node is 17.6 and 16.4, respectively. For 19F, CSI imaging parameters were as follows: 134 averages, TR = 13.3 ms, TE = 0.53 ms, and matrix size is 32 × 32. For T2*-weighted 1H, TR/TE = 550/14 ms and matrix size is 128 × 96. For additional details see the Supporting Information.
Table 1.
Intramolecular Fluorine-19 Relaxation Rates (R1 and R2) at 9.4 T of Fe3+-SALTAME Chelates 5a, Ga3+- SALTAME Chelate 5a POP, and Nonchelated Perfluorinated Salicylaldehydes 3a and 3ba
| isomer | R1 (s−1) | R2 (s−1) | |
|---|---|---|---|
| nonchelated precursors | 3b | 0.87 ± 0.01 | 1.12 ± 0.01 |
| 3a | 1.33 ± 0.01 | 1.75 ± 0.01 | |
| Ga3+-SALTAME | 5a PPP | 2.36 ± 0.06 | 5.18 ± 0.01 |
| Fe3+-SALTAME isomers | 5a PPP | 146.7 ± 4.4 | 177.6 ± 3.9 |
| 5a POP | 176.9 ± 3.9 | 219.2 ± 0.3 | |
| 5a OOP | 227.5 ± 7.3 | 333.9 ± 12.0 | |
| 5a OOO | 414.7 ± 13.7 | 653.0 ± 14.5 |
Chelation with diamagnetic Ga3+ has only a small effect, whereas chelation with paramagnetic Fe3+ causes a 2–3 orders of magnitude increase in R1 and R2 values. Relaxation rates correspond to 5 CF2 groups for precursors and Ga3+ chelate and the 5′ CF2 group in all Fe3+ chelates. The ± is standard error of the mean (SEM).
Figure 2.
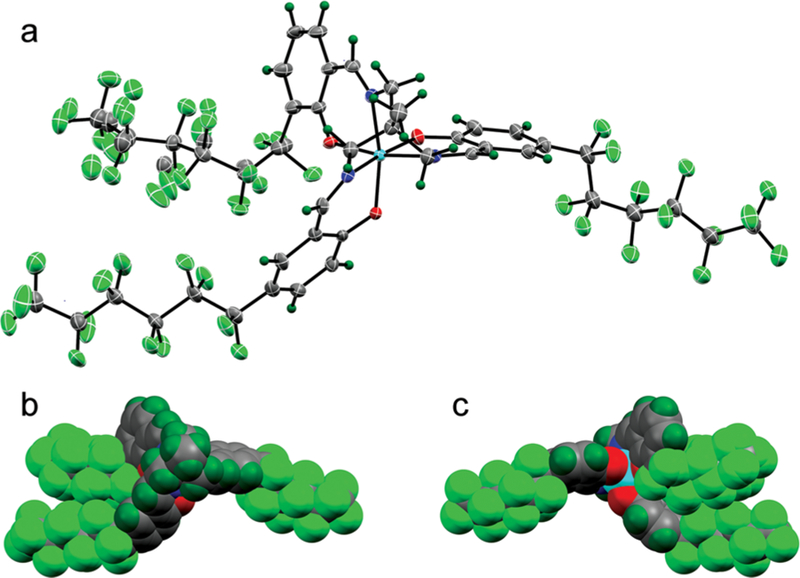
Crystal structure of 5a POP using X-ray crystallography. (a) Structure confirms the hexadentate coordination of the chelated Fe3+; (b) space-filling rendering of the same view and (c) after a 180 deg rotation to reveal the solvent-exposed face of the bound ferric ion. Iron is colored cyan for clarity.
The four 5a isomers were soluble in various PFC molecules, especially PFOB, and to a lesser extent (<0.5 mM) in perfluoro-15-crown-5-ether (PFCE) and perfluoropolyether (PFPE), which are other PFC compounds previously used for 19F MRI applications.8 Unexpectedly, the 5a isomers have remarkably different solubility in PFOB, with 5a PPP and 5a POP having the highest solubility (26 and 102 mM, respectively) among all the isomers (5a OOP and 5a OOO solubilities are 9.4 and 2.0 mM, respectively). Initial studies indicated that more stable PFOB nanoemulsions with 5a POP were formed with concentrations up to 30 mM of the SALTAME incorporated; thus we explored the properties and applications of this isomer. We also synthesized four additional SALTAME complexes 5c–f to explore the inclusion of other fluorous substituents, but all showed inferior solubility in PFOB.
Cation Selection.
We screened the impact of various cations bound to SALTAME 5a and dissolved in PFOB via NMR relaxometry and susceptibility shift measurements (Table 2). Of the period-4 cations tested (V3+, Cr3+, Mn2+, Fe3+, Co2+, Cu2+, Ni2+, Zn2+, Ga3+), only Mn4+, Fe3+, Co3+, and Ga3+ formed stable and separable (by column chromatography) chelates with SALTAME. These chelates readily dissolve in PFOB, and their intermolecular 19F NMR relaxivities and susceptibility shift properties at 9.4 T are displayed in Table 2. The diamagnetic Ga3+ chelate had little relaxation effects or shift for PFOB. Co3+ has a significant effect on the transverse relaxivity (r2) but not on the longitudinal relaxivity (r1), and the shift was not impacted. Mn4+ changes r1 and r2 and the susceptibility shift, but to a much lesser extent than Fe3+. Gd3+ did not form a stable chelate with SALTAME, presumably because it requires eight to nine coordination sites, whereas SALTAME has a coordination of six.
Table 2.
Intermolecular Fluorine-19 Relaxivities (r1 and r2) and Susceptibility Shifts of SALTAME 5a POP Chelates with Fe3+, Mn4+, Co3+, and Ga3+ at 9.4 T in PFOBa
| Mn4+ | Fe3+ | Co3+ | Ga3+ | |
|---|---|---|---|---|
| r1 (s−1 mM−1) | 0.03 | 0.50 | 0.001 | 0.002 |
| r2 (s−1 mM−1) | 0.13 | 1.07 | 0.15 | 0.02 |
| shift change (ppm/mM) | 0.035 | 0.060 | 0.001 | 0.001 |
Relaxivities were measured for (CF2)6 fluorine atoms of PFOB, and susceptibility shifts were measured for CF3 representative fluorine atoms of PFOB. Overall, the SALTAME 5a POP Fe3+ chelate has the highest relaxivity and susceptibility.
The longitudinal and transverse 19F relaxation rates of the Fe3+ chelate, 5a POP, was further evaluated as a function of iron concentration at the clinically relevant field strength of 3 T, yielding relaxivities r1 and r2 of 0.56 and 1.67 s−1 mM−1, respectively, compared to 0.50 and 1.07 s−1 mM−1 values of r1 and r2 at 9.4 T, respectively. For neat PFOB, R1/R2 values are 0.79 s−1/3.5 s−1 and 1.4 s−1/2.2 s −1 at 3 and 9.4 T, respectively.
Overall, the 5a POP Fe3+ chelate served as a representative additive and is used to formulate paramagnetic PFOB (P-PFOB) NE, which was used for further studies.
Structure of Fe3+ SALTAME.
To characterize the structure and Fe3+ coordination in chelates, data for 5a POP, PPP, and OOO were obtained by X-ray crystallography (Figures 2, S4, and S5) and NMR methods. Comparison of these structures with unsubstituted Fe3+-SALTAME (5, R1–R6 = H; Figure S6) confirms that the hexadentate coordination of Fe3+ is not affected by appending fluorous substituents to SALTAME with minimal differences in Fe–O or Fe–N bond lengths and angles compared to its nonfluorous parent.11 From these structures, we speculate that the low solubility of 5a OOOin PFOB (Table S1) may be explained by the observation that all three fluorous substituents are located on one side of 5a OOO, yielding less favorable van der Waals interactions between substituents and PFOB. Fluorous substituents are more evenly distributed around the chelate in 5a PPP and POP, yielding higher affinity to PFOB.
Intramolecular 19F NMR relaxometry measurements of 5a isomers further confirm the structural analyses. We observe that among Fe3+ chelates, the 5a OOO isomer has the highest and the 5a PPP isomer has the lowest R1 and R2 values (Table 1). Ortho-substitution causes a more drastic intramolecular PRE, by ~3 orders of magnitude, compared to para-substitution due to the closer proximity of the Fe3+ paramagnetic center to the ortho position (6.91 nm) compared to the para position (9.53 nm).
Sensitivity Enhancement of P-PFOB.
We modeled the potential MRI sensitivity enhancement of P-PFOB compared to undoped PFOB based on measured 19F NMR relaxivities in these materials. Modeling results (Figure 3a) show multifold sensitivity improvement is possible using a gradient-echo (GRE)-based MRI pulse sequence with echo time (TE) < 0.8 ms. Model details are given in the Supporting Information (Section 4).
Figure 3.
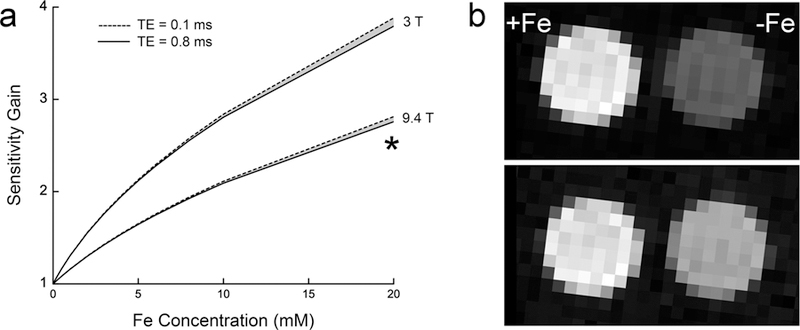
P-PFOB 19F MRI signal intensity enhancement. Panel (a) shows simulated sensitivity gain of P-PFOB versus PFOB at 3 and 9.4 T as a function of nanoemulsion-bound iron. Sensitivity gain is defined as SNR(P-PFOB)/SNR(PFOB) for constant time imaging. The model uses the empirically measured r1 and r2 relaxivities. The shaded regions represent a 0.1–0.8 ms TE parameter range. See Supporting Information Section 4 for model details. (b) Phantom 19F images (9.4 T) for P-PFOB (+Fe) and PFOB (−Fe). The top and bottom panels show the tubes optimized separately for P-PFOB ([5a POP] = 20 mM in oil) and PFOB SNR, respectively. From these images P-PFOB displays a 2.5-fold increase in SNR over PFOB when both are imaged optimally, and the asterisk in panel (a) shows approximate experimental agreement (~7.5% error) with the model. CSI parameters for (b) were 28 averages, TR = 103 ms, and TE = 0.8 ms for the top panel P-PFOB and four averages, TR = 721 ms, and TE = 0.8 ms for the bottom panel PFOB.
To support these findings, experimental data were acquired in an MRI phantom (Figure 3b) consisting of two NMR tubes containing PFOB and P-PFOB nanoemulsions. The phantoms were imaged twice at 9.4 T using a GRE chemical shift imaging (CSI) pulse sequence with two different repetition time (TR) parameters set according to TR = 0.5T1 for PFOB or P-PFOB, respectively, with the optimal Ernst angle condition set for each TR value; both images were acquired using the same total imaging time. (See Supporting Information for additional details.) Image results (Figure 3b) show the P-PFOB tube has a 2.5 times higher SNR than the PFOB tube when comparing the optimal SNR acquisition for each tube, consistent with the model prediction. This phantom imaging example does not represent the absolute value or upper limit to the possible SNR enhancement achievable with these materials; varying [Fe3+], magnetic field strength, pulse sequences, and acquisition parameters may yield different values of SNR enhancement.
Imaging Probe Formulation.
To create NE-based imaging probes, we formulated colloidal suspensions of P-PFOB. High-shear homogenization of components was used to form NE.15 To stabilize the NE, egg yolk phospholipids (EYP) was used as a surfactant; P-PFOB has a slight lipophilic character due to PFOB’s single bromine, yielding a cohesive tendency between PFOB and the fatty acid chains of EYP.16,17 Minor surfactant components were also added including CH3-(CH2)5-(CF2)5-CF3, which acts as molecular dowel, improving the emulsion stability,18 Cremophor EL (Polyoxyl 35 hydrogenated castor oil), to decrease NE droplet size and increase shelf life and circulation time,19 and mannitol as an isotonizer. After homogenization of P-PFOB ([5a POP] = 20 mM) with surfactants, the average NE particle size was ~162 nm with a polydispersity index (PDI) of 0.27, as measured by dynamic light scattering (DLS). Using similar methods, this particle size is comparable to nanoemulsions made without a chelate.15 The final P-PFOB NE had [F] = 14.26 M with a PFOB:5a POP molar ratio of 192:1. The R1 and R2 parameters were 9.01 ± 0.03 s.−1 and 16.66 ± 0.10 s−1 at 9.4 T, respectively. The NE stability was confirmed by longitudinally monitoring the particle size using DLS measurements for an emulsion stored at 4 °C over 60 days (Figure S7). Also, the NE complex is stable for at least 3 days at 37 °C in proteinaceous saline media used to mimic the blood circulation environment (Figure S8).
We also evaluated the iron-binding stability of P-PFOB NE ([Fe3+-SALTAME 5a POP] = 30 mM in PFOB) following addition of 50 mM ethylenediaminetetraacetate (EDTA), a strong competing Fe3+ chelating agent, to the aqueous phase; P-PFOB NE shows stable relaxometry parameters over 20 days, indicating that iron is tightly bound in the fluorous phase (Figure S9).
P-PFOB Labeling Macrophages in Vitro.
To test biocompatibility of formulated P-PFOB NE as a cell labeling agent, we performed in vitro assays on a labeled murine macrophage cell line derived from blood (RAW 264.7). This cell is a representative phagocyte that would take up NE in vivo after intravenous delivery. Following a 16 h incubation of RAW cells with various NE concentrations, the uptake level approached ~1012 fluorine atoms per cell, measured by 19F NMR (Figure S10).
We investigated the potential effect of P-PFOB labeling on RAW cell viability and phenotype (Figure 4). To study cytotoxicity, we used a flow cytometry assay for apoptosis (Figure 4a–c) using 10-N-nonyl acridine orange (NAO).20 As a positive control to induce oxidative stress, 10% ethanol was added to the cell media. No evidence of cytotoxicity is observed in NE-labeled compared to unlabeled cells (Figure 4a,b), whereas ethanol-treated cells display cytotoxicity (Figure 4c) and a characteristic bimodal appearance described elsewhere.20 Figure 4b also shows that the labeled cells have increased side-scatter signal due to light scattering from PFC-loaded intracellular vesicles, a common observation. Side-scatter is routinely used in flow cytometry to distinguish cell types by granularity. Labeled cells often display increased granularity with internalization of PFC droplets. To assay cell phenotype, we used flow cytometry to monitor potential changes in cell surface CD86 expression as a marker for macrophage activation, where increased levels indicate a pro-inflammatory response to label. Lipopolysaccharide (LPS) treatment was used as a positive control to induce a pro-inflammatory phenotype. The CD86 expression level in NE-labeled macrophages is comparable to unlabeled cells (Figure 4d), whereas in LPS-treated cells the level is visibly higher, suggesting that P-PFOB NE does not stimulate a pro-inflammatory phenotype in macrophages.
Figure 4.
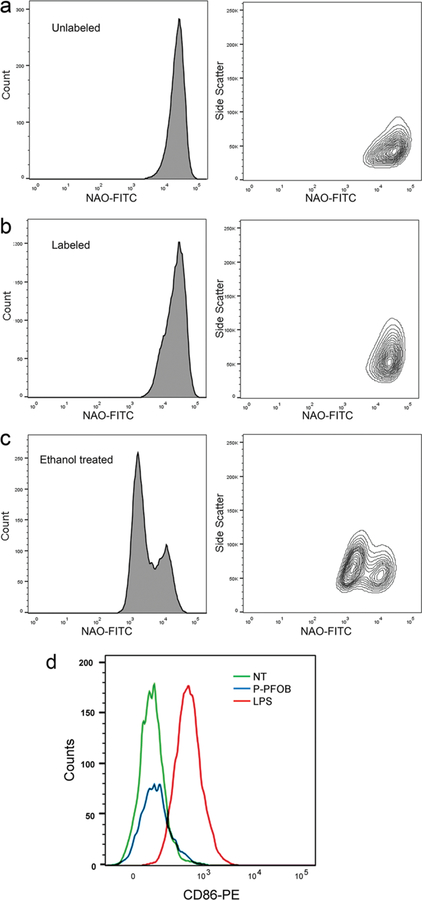
In vitro cytotoxicity and cell phenotype in P-PFOB-labeled RAW cells. Cells were incubated with P-PFOB NE ([Fe3+-SALTAME 5a POP] = 20 mM in PFOB) in culture for 16 h. The NAO flow cytometry assay was used to measure cytotoxicity (apoptosis). (a) Unlabeled (negative) control cells, (b) labeled cells, and (c) 10% ethanol treated cells as positive control. (d) Flow cytometry results for CD86 expression in P-PFOB-labeled RAW cells. LPS-treated cells serve as a positive control.
Visualizing Inflammation in Vivo Using P-PFOB NE.
Proof-of-concept in vivo imaging of inflammation was performed using P-PFOB NE in a localized inflammation mouse model. Following established protocols,5,8,21 localized inflammation was induced using an LPS-doped Matrigel solution injected subcutaneously into the posterior neck of a C57BL/6 mouse (N = 3). After 2 h, a single bolus of P-PFOB NE (200 μL, [Fe3+-SALTAME 5a POP] = 20mMin PFOB oil phase), equivalent to 143 mmol F/kg body weight and 0.04 mmol chelated Fe/kg body weight, was injected intravenously. No adverse reactions were observed. Mice were imaged 24 h after injection to allow for nanoemulsion uptake by monocytes/macrophages in situ. Scans were performed at 11.7 T. The 19F images were acquired using a two-dimensional CSI pulse sequence along with conventional anatomical 1H images. A representative coronal image in the neck region is displayed in Figure 5, where the Matrigel plug appears as a hyperintense, subcutaneous structure in the dorsal region of the 1H image (Figure 5). A robust 19F signal signifying macrophage uptake is seen co-registered with the Matrigel plug. 19F is also found in an area in the anterior neck, presumably at a lymph node (asterisk, Figure 5). Overall, these preliminary in vivo data show the feasibility of using P-PFOB NE as an inflammation imaging agent.
Susceptibility Shifts by Fe3+ SALTAME.
In unemulsified P-PFOB oil we observe significant 19F shifts in all PFOB peaks with the addition of 5a POP Fe3+ chelate (Figure 6a). This shift is linear with concentration of 5a POP in PFOB, with a slope of .−0.060 ppm/mM at 9.4 T. Generally, a 19F shift reagent can be used for multispectral (color-coded) MRI. To demonstrate multispectral MRI with P-PFOB oil, a phantom was prepared using varying concentrations of 5a POP in three NMR tubes containing PFOB dissolved with [5a POP] = 0, 14.5, and 25 mM. It was imaged using a CSI pulse sequence. The red–green–blue overlays (Figure 6a, right) represent the shift images generated at the characteristic CF3 resonance frequencies of each [5a POP] concentration. The linear relationship between shift change and [5a POP] provides the potential for multiplexed imaging using different amounts of additive 5a POP to achieve 19F multichromicity.
Figure 6.
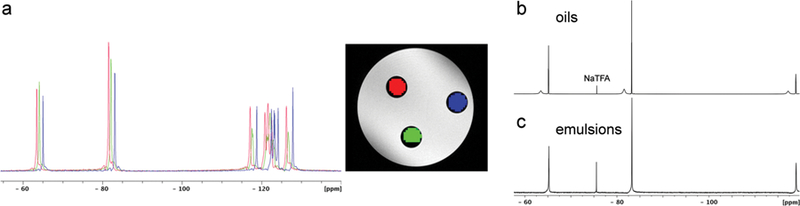
Bulk magnetic susceptibility (BMS) shifts for P-PFOB. (a, left) 19F CSI spectra of NMR tubes containing PFOB with [5a POP] = 25 mM (red), PFOB [5a POP] = 14.5 mM (green), and pure PFOB (blue) oils. The NMR tubes were embedded in agarose and imaged using the CSI method. Resulting 19F MRI images are shown (a, right), where shifted CF3 peaks are assigned red, green, or blue color channels and superimposed along with the 1H grayscale image. Here, red is −81.535 ppm with [5a POP] = 25 mM, green is −82.178 ppm with [5a POP] = 14.5 mM, and blue is.−83.048 ppm for pure PFOB. The CSI data were acquired with TR/TE = 26.4/0.53 ms, matrix size 64 × 64, and 6 averages. (See Supporting Information for additional details.) (b, c) P-PFOB emulsification, forming spheroidal oil droplets, eliminates observed BMS shift. Displayed are 19FNMRspectra of PFOB and P-PFOB, prepared with dual-capillaryNMR samples inside a 5mmNMRtube, where (b) are oils and (c) formed nanoemulsions. In (b), two sets of peaks are observed, where P-PFOB displays a downfield BMS shift of ~1.6 ppm with peak broadening. After emulsification (c), only one set of peaks is observed. Capillaries are immersed in D2O with 0.1% NaTFA as an internal standard.
However, we attribute the observed field shift to bulk magnetic susceptibility (BMS) effects,22 where shift is dependent on sample geometry (i.e., cylindrical NMR tube). Upon formulating the P-PFOB oil into a colloidal suspension of spherical NE droplets (described above), the P-PFOB shift compared to PFOB is strongly attenuated (Figure 6b,c).
Overall, we describe the design and characterization of SALTAME, a stable hexadentate chelating agent for iron(III). We used this moiety to formulate a nanoemulsion MRI probe that can be used for “hot-spot” detection in vivo. Incorporation of iron-bound SALTAME into the fluorous phase of NE causes a profound reduction of the 19F T1 value and only mild line broadening, thus offering improved sensitivity of 19F MRI due to increased signal averaging and/or reduced MRI scan time.
One of the primary challenges in the emerging field of 19F MRI is sensitivity, and improvement of the intrinsic MRI sensitivity of the PFC molecule employed could lower the barriers for wider use in biomedical applications. Generally, PFCs are often employed due to their high F-density and safety profile. PFOB has been shown to be a promising molecular candidate for the translation of 19F MRI because of its low toxicity and rapid clearance from the body due to its modest lipophilicity.8,23 In fact, PFOB has already been used in patients as an oxygen transporting media.9,16 Importantly, it has a short half-life (3–8 days), in vivo. By comparison, PFCE, another PFC molecule commonly used for 19F MRI, has a body half-life of >100 days.16 Generally, clearance of PFC NE agents from the body occurs via uptake into cells and organs of the reticuloendothelial system, followed by lung exhalation.24 However, PFOB has some undesirable properties as a 19F probe; it has a complex multipeak 19F spectrum and intrinsically high T1 values common for many PFC molecules.25 In fact, among the most common PFCs, PFOB has the highest T1 value of ~1.2 s, compared to ~0.9 ms for PFCE, for example, at 3 T.26 Generally, 19F MRI requires signal averaging, and the high T1 value of PFOB limits the rate of 19F MRI data acquisition within a constrained imaging time. Shortening T1 can increase the SNR per time and decrease the minimum number of detectable cells per voxel.
T1 can be profoundly altered by paramagnetic cations due to PRE. In prior studies, PRE has been used for 19F probes using lanthanide macrocycles with fluorinated sites.27–30 These chelates29 yield a reduction of ~2–3 orders of magnitude in intramolecular T1, similar to Fe3+-SALTAME 5a isomers (Table 1). However, the relatively low 19F content of macrocyclic chelates makes it challenging to achieve detectable intracellular labeling levels, compared to fluorine-dense PFC oils. Gd-macrocyclic chelates tethered to an NE surface provides mild 19F T1 enhancement, but are unstable inside cells.31
Fe3+-SALTAME retains the distorted octahedral geometry and, presumably, the high-spin state of the previously reported Fe3+ chelate without fluorous substituents.11 Its high stability and affinity for Fe3+ permit easy isolation of the complex and formulation into PFOB NE without the requirement of the subsequent iron loading step necessary for prior compounds.1 We observed that Fe3+ is the most effective cation for intermolecular 19F T1 acceleration in PFOB, consistent with our prior work.1 Gd3+ and Fe3+ ions form the basis of T1- and T2- based 1H contrast agents, respectively, but for 19F MRI, the roles these ions play are reversed.1
The in vivo inflammation mouse model results (Figure 5) are preliminary data showing in vivo compatibility and MRI detectability of P-PFOB NE. The method of using intravenously delivered 19F MRI for “in situ” labeling of macrophages to elucidate inflammation hot-spots is well established and has been used preclinically in a wide range of disease models.3,23,32 Alternative PFC NE formulations facilitate ex vivo cell uptake in culture,33 for example during the preparation of stem cell or immunotherapeutic cytotherapies, and following transfer to the patient, these cells are detected in vivo using 19F MRI.4 The fluorine inside the cells yields positive-signal hot-spot images that can be quantified to measure apparent cell numbers at sites of accumulation, thereby enabling “in vivo cytometry”.34 The sensitivity limits of detection are on the order of 104–105 cells/voxel.3
The relaxation rates of P-PFOB are predictably tuned by varying Fe concentration. Tests were performed using a range of concentrations less than the maximum because these are the most useful for MRI experiments using the conventional (i.e., spin echo or gradient echo) pulse sequences most used in MRI practice (see SI Section 4). However, advanced MRI pulse sequences, such as zero time to echo (ZTE) and ultrashort time to echo (UTE), which are used by early adoptors in MRI practice,29 can predictably reap the benefits of the maximum iron concentration when T1 and T2 are very short; a detailed comparison of the performance of P-PFOB with different pulse sequences is beyond the scope of this article.
The total amount of Fe delivered via the P-PFOB injection is miniscule compared to innate Fe levels in mice. The total dose of SALTAME-bound Fe in the inoculant is approximately 50 μg of chelated Fe. The amount of Fe contained in mouse blood tissue, which represents roughly 2/3 of the total iron stores in the body, is approximately 0.75 mg of Fe, 15-fold higher. Thus, Fe metabolism of the organism should not be impacted by addition of P-PFOB, which contains small amounts of saturated, SALTAME-bound Fe.
The cell toxicity data presented (Figure 4) is preliminary, but shows no overt toxicity induced by intracellular labeling; the flow-based NAO assay is very sensitive, and both positive and negative controls were included in the experimental design. Generally, the cell safety of PFC cell labeling has been demonstrated exhaustively in numerous studies and cell types,35–38 including primary immune cells for a human clinical trial4 using a panel of in vitro cell assays of phenotype and function, including NAO.
We observe significant linear 19F NMR field shifts in all PFOB peaks with the addition of a SALTAME Fe3+ chelate (Figure 6a) in the unemulsified oil. SALTAME as a 19F shift reagent could be used for multicolor MRI tags composed of neat P-PFOB oils, for example, to image catheter tips39 and the gastrointestinal track38 or for external 19F fiduciary capsules.
CONCLUSIONS
Here, we describe the design and characterization of SALTAME, a stable hexadentate chelating agent for iron(III). We used this moiety to formulate a nanoemulsion MRI probe that can be used for “hot-spot” detection in vivo. Incorporation of iron-bound SALTAME into the fluorous phase of NE causes a profound reduction of the 19F T1 value and only mild line broadening, thus offering improved sensitivity of 19F MRI due to increased signal averaging and/or reduced MRI scan time.
Overall, the use of fluorinated molecules is emerging as an option for cellular imaging probe design. This probe has the potential to enable longitudinal, noninvasive quantification of inflammation and therapeutic cell delivery and aid in the monitoring of therapeutic test articles.
METHODS
Materials.
Chemicals were purchased from Sigma-Aldrich (St. Louis, MO, USA) or other reputable suppliers, and organic solvents (liquid chromatography-grade) were purchased from Fisher Scientific (Pittsburgh, PA, USA) and used as received. Anhydrous dimethylformamide (DMF) and acetonitrile were stored over activated 4 Å molecular sieves. Fluorous solvents were purchased from Perseptive Biosystems (Framingham, MA, USA). Precoated silica gel plates (60 F-254, Merck Millipore, Billerica, MA, USA) were used for thin-layer chromatography (TLC), and silica gel 60 (230–400 mesh) was used for column chromatography.
Analytic Methods.
All reactions were carried out under N2 unless otherwise noted. Reactions were monitored by TLC and LC-MS using an Agilent (Santa Clara, CA, USA) 1100 HPLC with MSD Trap XLT using a Phenomenex Luna C18(2) 100 Å, 5 μm, 4.6mm × 250 column, MeCN/H2O linear gradients with constant 0.05% v/v CF3CO2H additive, 1 mL/min flow, and ESI positive or negative ion mode. Reaction products were purified by flash chromatography on silica gel eluted with ethyl acetate and hexane. High-resolution mass spectrometry was performed by the Molecular Mass Spectrometry Facility at the University of California San Diego. Ultraviolet–visible (UV–vis) absorption spectra were recorded on a Shimadzu (Kyoto, Japan) spectrophotometer. Solubility of Fe3+-SALTAME compounds in perfluorocarbons was determined by absorbance at 450 nm following dilution in ethyl acetate using experimentally determined extinction coefficients of 700 M−1 cm−1 for the 5a isomers.
NMR Measurements.
NMR spectra and relaxation rates were recorded on a Bruker Ascend 400 MHz (9.4 T) spectrometer (Billerica, MA, USA). Additional relaxation rate measurements were performed at 3 T using a GE750 (General Electric, Milwaukee, WI, USA) clinical MRI system equipped with a custom dual-channel 19F/1H 72 mm diameter volume coil (RAPID Biomedical, Rimpar, Germany). The 19F NMR spectra were referenced to an internal standard, sodium trifluoroacetate (NaTFA, 0.1 wt %, .−76.00 ppm, Sigma-Aldrich, T6508), which was placed in a separate sealed capillary tube within the NMR tube. Relaxation measurements were performed using a standard inversion recovery pulse sequence and a Carr–Purcell–Meiboom–Gill sequence with echo-time values in 12 linear increments. The T1 and T2 values were obtained by nonlinear fitting using MNova 6.0.2 software (Mestrelab, Escondido, CA, USA). Fit errors were less than 5% of T1 and T2 values. For quantitative peak measurements, spectra were acquired using calibrated 90° pulses, 32 000 complex points, spectral window 0 to .−200 ppm, relaxation delay 2.5 s, and 128 averages. Spectra were processed in MNova with manual phase correction and Whittaker smoother baseline correction (filter = 1 ppm). Relaxation parameters were measured for six middle CF2 peaks of PFOB, spanning ~10 ppm, which account for 12 out of 17 F atoms in the molecule. To assay nanoemulsion uptake (19F/cell) using NMR, an aliquot of 1 × 10⁶ cells was pelleted and resuspended in 0.1 mL of lysis solution (0.5% Triton X, 100mM NaCl, 20mM Tris, 1 mM EDTA), and reference compound NaTFA (0.745 mg/mL)/D2O was added to a 5 mm NMR tube. The integrated ratio of PFOB fluorine peaks to NaTFA singlet fluorine peak at −76.00 ppm determined the amount of 19F in the cell pellet, and the 19F/cell was calculated.
Phantom MRI.
A phantom consisted of two 5 mm NMR tubes containing PFOB and P-PFOB ([5a POP] = 20 mM in PFOB oil) nanoemulsions side-by-side. Images were acquired using a 9.4 T Bruker Avance III HD Nanobay spectrometer equipped for microimaging with a double-tuned 10mm 1H/19F coil and ParaVision 6 software. Two sets of 19F images were acquired using a two-dimensional CSI method to yield optimal SNR for each tube. Imaging parameters were TE = 0.8 ms, matrix size 32 × 32, field of view 9.5 × 9.5 ×3 mm3, and acquisition time 49 min for each. To optimize SNR for each tube, the TR was set to 103 ms with 28 averages, and then TR = 721 ms and four averages, with the optimal Ernst angle condition set for each TR value.
In Vivo MRI.
Live mouse images were acquired using an 11.7 T horizontal-bore Bruker BioSpec MRI system equipped with a double-tuned 1H/19F mouse volume coil and ParaVision 6 software. Mice were anesthetized using 1.5% isoflurane in O2 and maintained at 37 °C during acquisitions. The 19F images were acquired using a two-dimensional CSI method with TR/TE = 13.3/0.53 ms, matrix size 32 × 32, field of view 20 × 20 × 6 mm3, 134 averages, and acquisition time ~30 min. For anatomical data, 1H spin–echo images were acquired with TR/TE = 550/14 ms, matrix size 128 × 96, field of view 20 × 20 × 1 mm3, and acquisition time ~3 min. CSI visualization was performed using the CSI Visualization Tool inside the ParaVision software. The calculation and display of the phantom was performed by selecting all PFOB resonance peaks from .−60 to .−130 ppm. Notably, examination of the CSI spectral data showed no peaks at −82.8 and .−89.9 ppm, corresponding to isoflurane anesthesia.
Shift MRI.
Images to demonstrate POP Fe3+ chelate dissolved in PFOB oil induces bulk magnetic susceptibility shifts were acquired using the above 11.7 T MRI system. A CSI pulse sequence was used with TR/TE = 26.4/0.53 ms, matrix size 64 × 64, FOV 30 × 30 × 3 mm3, 1024 complex points, spectrum width 40.8 kHz, six averages, and acquisition time 10.8 min. CSI visualization was performed using the CSI Visualization Tool in ParaVision software. The calculation and display of the P-PFOB map was performed by selecting the CF3 resonance peak only.
The crystallographic data have been deposited at the Cambridge Crystallographic Data Centre (CCDC) as CCDC 1572939 (5a POP at 100 K), CCDC 1572845 (5a OOOat 100 K), and CCDC 1572938 (5a PPP at 100 K) and can be obtained free of charge from the CCDC via www.ccdc.cam.ac.uk/getstructures.
Supplementary Material
ACKNOWLEDGMENTS
Funding for E.T.A. was provided by National Institutes of Health (NIH) grants R01-EB017271, R01-EB024015, and R01 CA139579 and the California Institute for Regenerative Medicine LA1-C12-06919. A.H.J. is funded by a Cook Medical Cesare Gianturco/RSNA Research Resident grant and NIH T32 4T32EB005970.
Footnotes
ASSOCIATED CONTENT
Supporting Information
Additional materials and methods associated with chemical synthesis, NMR spectra of compounds and intermediates, MRI sensitivity modeling, biological cell testing, and crystallization methods. (PDF)X-ray crystallographic data for 5a POP (CIF)X-ray crystallographic data for 5a OOO (CIF)X-ray crystallographic data for 5a PPP (CIF)
Notes
The authors declare the following competing financial interest(s): E.T.A. is founder, consultant, member of the advisory board, and shareholder of Celsense, Inc.
REFERENCES
- (1).Kislukhin AA; Xu HY; Adams SR; Narsinh KH; Tsien RY; Ahrens ET Paramagnetic Fluorinated Nanoemulsions for Sensitive Cellular Fluorine-19 Magnetic Resonance Imaging. Nat. Mater 2016, 15, 662. [DOI] [PMC free article] [PubMed] [Google Scholar]
- (2).Ahrens ET; Flores R; Xu HY; Morel PA In Vivo Imaging Platform for Tracking Immunotherapeutic Cells. Nat. Biotechnol 2005, 23, 983. [DOI] [PubMed] [Google Scholar]
- (3).Ahrens ET; Zhong J In Vivo MRI Cell Tracking Using Perfluorocarbon Probes and Fluorine-19 Detection. NMR Biomed 2013, 26, 860. [DOI] [PMC free article] [PubMed] [Google Scholar]
- (4).Ahrens ET; Helfer BM; O’Hanlon CF; Schirda C Clinical Cell Therapy Imaging Using a Perfluorocarbon Tracer and Fluorine-19 MRI. Magn. Reson. Med 2014, 72, 1696. [DOI] [PMC free article] [PubMed] [Google Scholar]
- (5).Temme S; Bonner F; Schrader J; Flogel U 19F Magnetic Resonance Imaging of Endogenous Macrophages in Inflammation. Wiley Interdiscip Rev. Nanomed Nanobiotechnol 2012, 4, 329. [DOI] [PubMed] [Google Scholar]
- (6).Bloembergen N; Morgan LO Proton Relaxation Times in Paramagnetic Solutions. Effects of Electron Spin Relaxation. J. Chem. Phys 1961, 34, 842. [Google Scholar]
- (7).Neubauer AM; Myerson J; Caruthers SD; Hockett FD; Winter PM; Chen J; Gaffney PJ; Robertson JD; Lanza GM; Wickline SA Gadolinium-Modulated 19F Signals from Perfluorocarbon Nanoparticles as a New Strategy for Molecular Imaging. Magn. Reson. Med 2008, 60, 1066. [DOI] [PMC free article] [PubMed] [Google Scholar]
- (8).Jacoby C; Temme S; Mayenfels F; Benoit N; Krafft MP; Schubert R; Schrader J; Flogel U Probing Different Perfluorocarbons for In Vivo Inflammation Imaging by 19F MRI: Image Reconstruction, Biological Half-Lives and Sensitivity. NMR Biomed 2014, 27, 261. [DOI] [PubMed] [Google Scholar]
- (9).Riess JG; Weers JG Emulsions for Biomedical Uses. Curr. Opin. Colloid Interface Sci 1996, 1, 652. [Google Scholar]
- (10).Klein DH; Jones RC; Keipert PE; Luena GA; Otto S; Weers JG Intravascular Behavior of Perflubron Emulsions. Colloids Surf., A 1994, 84, 89. [Google Scholar]
- (11).Deeney FA; Harding CJ; Morgan GG; McKee V; Nelson J; Teat SJ; Clegg W Response to Steric Constraint in Azacryptate and Related Complexes of Iron-(II) and -(III) *. J. Chem. Soc., Dalton Trans 1998, 1837.
- (12).Filippini G; Nappi M; Melchiorre P Photochemical Direct Perfluoroalkylation of Phenols. Tetrahedron 2015, 71, 4535. [Google Scholar]
- (13).Matsugi M; Hasegawa M; Hasebe S; Takai S; Suyama R; Wakita Y; Kudo K; Imamura H; Hayashi T; Haga S Direct Perfluoroalkylation of Non-Activated Aromatic C–H Bonds of Phenols. Tetrahedron Lett 2008, 49, 4189. [Google Scholar]
- (14).Ramanathan A; Jimenez LS Reductive Dehalogenation of Aryl Bromides and Chlorides and Their Use as Aryl Blocking Groups. Synthesis 2010, 2, 217. [Google Scholar]
- (15).Janjic JM; Ahrens ET Fluorine-Containing Nanoemulsions for MRI Cell Tracking. Wiley Interdiscip Rev. Nanomed Nanobiotechnol 2009, 1, 492. [DOI] [PMC free article] [PubMed] [Google Scholar]
- (16).Riess JG Oxygen Carriers (“Blood Substitutes”)Raison D’etre, Chemistry, and Some Physiology Blut Ist Ein Ganz Besondrer Saft. Chem. Rev 2001, 101, 2797. [DOI] [PubMed] [Google Scholar]
- (17).Weers JG; Liu J; Fields T; Resch P; Cavin J; Arlauskas RA Room Temperature Stable Perfluorocarbon Emulsions with Acceptable Half-Lives in the Reticuloendothelial System. Artif Cell Blood Sub 1994, 22, 1175. [DOI] [PubMed] [Google Scholar]
- (18).Postel M; Riess JG; Weers JG Fluorocarbon Emulsions the Stability Issue. Artif Cell Blood Sub 1994, 22, 991. [DOI] [PubMed] [Google Scholar]
- (19).Ahrens ET; Janjic JM Compositions and Methods for Producing Emulsions for Nuclear Magnetic Resonance Techniques and Other Applications, USPTO 9,352,057, 2016.
- (20).Lutsenko GV Flow-Cytometry Assay for Apoptosis Using Fluorophor 10-N-nonyl acridine Orange. Biol. Membrany 2010, 27, 430. [Google Scholar]
- (21).Temme S; Jacoby C; Ding Z; Bonner F; Borg N; Schrader J; Flogel U Technical Advance: Monitoring the Trafficking of Neutrophil Granulocytes and Monocytes During the Course of Tissue Inflammation by Noninvasive 19F MRI. J. Leukocyte Biol 2014, 95, 689. [DOI] [PubMed] [Google Scholar]
- (22).Chu SCK; Xu Y; Balschi JA; Springer CS Bulk Magnetic-Susceptibility Shifts in NMR Studies of Compartmentalized Samples - Use of Paramagnetic Reagents. Magn. Reson. Med 1990, 13, 239. [DOI] [PubMed] [Google Scholar]
- (23).Bonner F; Merx MW; Klingel K; Begovatz P; Flogel U; Sager M; Temme S; Jacoby C; Salehi Ravesh M; Grapentin C; Schubert R; Bunke J; Roden M; Kelm M; Schrader J Monocyte Imaging After Myocardial Infarction with 19F MRI at 3 T: A Pilot Study in Explanted Porcine Hearts. Eur. Heart J-Card Img 2015, 16, 612. [DOI] [PubMed] [Google Scholar]
- (24).Flaim SF Pharmacokinetics and Side Effects of Perfluorocarbon-Based Blood Substitutes. Artif Cell Blood Sub 1994, 22, 1043. [DOI] [PubMed] [Google Scholar]
- (25).Giraudeau C; Flament J; Marty B; Boumezbeur F; Meriaux S; Robic C; Port M; Tsapis N; Fattal E; Giacomini E; Lethimonnier F; Le Bihan D; Valette J A New Paradigm for High-Sensitivity 19F Magnetic Resonance Imaging of Perfluorooctylbromide. Magn. Reson. Med 2010, 63, 1119. [DOI] [PubMed] [Google Scholar]
- (26).Colotti R; Bastiaansen JA; Wilson A; Flogel U; Gonzales C; Schwitter J; Stuber M; van Heeswijk RB Characterization of Perfluorocarbon Relaxation Times and Their Influence on the Optimization of Fluorine-19 MRI at 3 T. Magn. Reson. Med 2017, 77 (6), 2263. [DOI] [PubMed] [Google Scholar]
- (27).Harvey P; Kuprov I; Parker D Lanthanide Complexes as Paramagnetic Probes for 19F Magnetic Resonance. Eur. J. Inorg. Chem 2012, 2012, 2015. [Google Scholar]
- (28).De Luca E; Harvey P; Chalmers KH; Mishra A; Senanayake PK; Wilson JI; Botta M; Fekete M; Blamire AM; Parker D Characterisation and Evaluation of Paramagnetic Fluorine Labelled Glycol Chitosan Conjugates for (19)F and (1)H Magnetic Resonance Imaging. JBIC, J. Biol. Inorg. Chem 2014, 19, 215. [DOI] [PubMed] [Google Scholar]
- (29).Schmid F; Höltke C; Parker D; Faber C Boosting (19) F MRI-SNR Efficient Detection of Paramagnetic Contrast Agents Using Ultrafast Sequences. Magn. Reson. Med 2013, 69, 1056. [DOI] [PubMed] [Google Scholar]
- (30).Funk AM; Fries PH; Harvey P; Kenwright AM; Parker D Experimental Measurement and Theoretical Assessment of Fast Lanthanide Electronic Relaxation in Solution with Four Series of Isostructural Complexes. J. Phys. Chem. A 2013, 117, 905. [DOI] [PubMed] [Google Scholar]
- (31).Kok MB; de Vries A; Abdurrachim D; Prompers JJ; Grull H; Nicolay K; Strijkers GJ Quantitative (1)H MRI, (19)F MRI, and (19)F MRS of Cell-Internalized Perfluorocarbon Paramagnetic Nano-particles. Contrast Media Mol. Imaging 2011, 6, 19. [DOI] [PubMed] [Google Scholar]
- (32).Ratner AV; Hurd R; Muller HH; Bradley-Simpson B; Pitts W; Shibata JD; Sotak C; Young SW 19F Magnetic Resonance Imaging of the Reticuloendothelial Systtem. Magn. Reson. Med 1987, 5, 548. [DOI] [PubMed] [Google Scholar]
- (33).Janjic JM; Srinivas M; Kadayakkara DK; Ahrens ET Self-Delivering Nanoemulsions for Dual Fluorine-19 MRI and Fluorescence Detection. J. Am. Chem. Soc 2008, 130, 2832. [DOI] [PubMed] [Google Scholar]
- (34).Srinivas M; Turner MS; Janjic JM; Morel PA; Laidlaw DH; Ahrens ET In Vivo Cytometry of Antigen-Specific T Cells Using 19F MRI. Magn. Reson. Med 2009, 62, 747. [DOI] [PMC free article] [PubMed] [Google Scholar]
- (35).Helfer BM; Balducci A; Nelson AD; Janjic JM; Gil RR; Kalinski P; De Vries IJM; Ahrens ET; Mailliard RB Functional Assessment of Human Dendritic Cells Labeled for In Vivo F-19 Magnetic Resonance Imaging Cell Tracking. Cytotherapy 2010, 12, 238. [DOI] [PMC free article] [PubMed] [Google Scholar]
- (36).Bouchlaka MN; Ludwig KD; Gordon JW; Kutz MP; Bednarz BP; Fain SB; Capitini CM 19F-MRI for Monitoring Human NK Cells In Vivo. OncoImmunology 2016, 5, No. e1143996. [DOI] [PMC free article] [PubMed] [Google Scholar]
- (37).Rose LC; Kadayakkara DK; Wang G; Bar-Shir A; Helfer BM; O’Hanlon CF; Kraitchman DL; Rodriguez RL; Bulte JWM Fluorine-19 Labeling of Stromal Vascular Fraction Cells for Clinical Imaging Applications. Stem Cells Transl. Med 2015, 4, 1472. [DOI] [PMC free article] [PubMed] [Google Scholar]
- (38).Schirra CO; Weiss S; Krueger S; Pedersen SF; Razavi R; Schaeffter T; Kozerke S Toward True 3D Visualization of Active Catheters Using Compressed Sensing. Magn. Reson. Med 2009, 62, 341. [DOI] [PubMed] [Google Scholar]
- (39).Mattrey RF; Hajek PC; Gylys-Morin VM; Baker LL; Martin J; Long DC; Long DM Perfluorochemicals as Gastrointestinal Contrast Agents for MR Imaging: Preliminary Studies in Rats and Humans. AJR, Am. J. Roentgenol 1987, 148, 1259. [DOI] [PubMed] [Google Scholar]
Associated Data
This section collects any data citations, data availability statements, or supplementary materials included in this article.