

Summary:
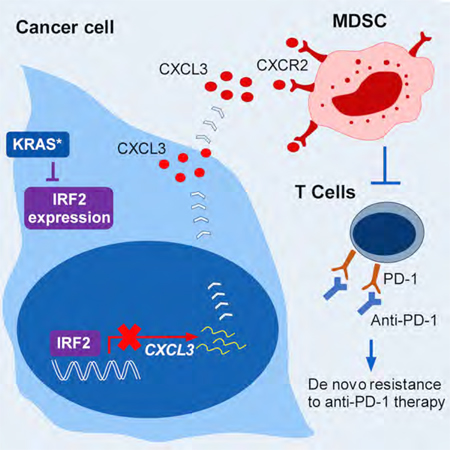
The biological functions and mechanisms of oncogenic KRASG12D (KRAS*) in resistance to immune checkpoint blockade (ICB) therapy are not fully understood. We demonstrate that KRAS* represses the expression of interferon regulatory factor 2 (IRF2), which in turn directly represses CXCL3 expression. KRAS*-mediated repression of IRF2 results in high expression of CXCL3, which binds to CXCR2 on myeloid-derived suppressor cells (MDSCs) and promotes their migration to the tumor microenvironment. Anti-PD-1 resistance of KRAS*-expressing tumors can be overcome by enforced IRF2 expression or by the inhibition of CXCR2. Colorectal cancer (CRC) showing higher IRF2 expression exhibited increased responsiveness to anti-PD-1 therapy. The KRAS*-IRF2-CXCL3-CXCR2 axis provides a framework for patient selection and combination therapies to enhance the effectiveness of ICB therapy in CRC.
Keywords: Colorectal cancer (CRC), KRAS, IRF2, CXCL3, CXCR2, Immune Checkpoint Blockade (ICB), anti-PD-1
Graphical Abstract
INTRODUCTION
Colorectal cancer (CRC) is a major cause of cancer mortality worldwide. Approximately 20% of patients with CRC have metastatic disease at diagnosis (Jemal et al., 2008). Despite improvements in systemic treatments for patients with metastatic disease, 5-year survival rate is only 12%−14% in patients with metastatic CRC (Siegel et al., 2017). Immune checkpoint blockade (ICB) therapy has provided clinical benefit to some patients with advanced cancer including those with melanoma, non-small cell lung cancer, renal cell carcinoma, and mismatch repair-deficient disease (Le et al., 2015; Robert et al., 2015; Topalian et al., 2012). ICB has shown activity in microsatellite instability-high (MSI-H) CRC but not in microsatellite-stable (MSS) CRC (Le et al., 2015; Overman et al., 2017). The majority of CRC cases are MSS, highlighting an urgent need for effective therapeutic strategies.
Oncogenic mutation of KRAS (KRAS*, the majority of which is KRASG12D), along with inactivation of APC and TP53, are signature mutations in human CRC (Wood et al., 2007). KRAS* is present in 35%−50% of human CRCs, where its presence correlates positively with disease aggressiveness and metastasis (Artale et al., 2008; Pereira et al., 2015; Vakiani et al., 2012). The clinical importance of understanding more fully the biology of KRAS* in CRC is underscored by its capacity to impair the clinical efficacy of EGFR inhibitors (Benvenuti et al., 2007) as well as by the meager clinical responses of targeted therapies directed at downstream signaling components of the KRAS pathway (Rinehart et al., 2004). These clinical observations suggest a role for oncogenic KRAS in disease progression and in governing therapeutic responses to targeted therapy.
Large-scale expression profiling of CRC has provided some clues as to how KRAS* might shape tumor immunity. Specifically, a consensus molecular subtype (CMS) classification system consisting of 4 subtypes (CMS1-CMS4) (Guinney et al., 2015), and its intersection with a coordinate immune response cluster of 28 immune genes, has revealed relatively poor immune infiltration (i.e., CD4+ T cells) and low inhibitory molecule (i.e., CTLA4, PDL1, PDL2, LAG3, and TIM3) expression in KRAS* tumors (Lal et al., 2015). Analyses using TCGA CRC datasets revealed that KRAS* tumors display features with reduced Th1-centric coordinated immune response cluster (CIRC) as well as reduced infiltration of cytotoxic cells (Lal et al., 2018).
We recently established a CRC mouse model that faithfully recapitulates the progression of the human disease (Boutin et al., 2017). This model is engineered with a doxycycline (Dox)-inducible oncogenic Kras allele and conditional null alleles of Apc and Trp53 (designated iKAP). The molecular profile of iKAP tumors most closely resembles the human CMS4 subtype, including its mesenchymal phenotype along with activated TGF-β signaling (Boutin et al., 2017; Dienstmann et al., 2017; Guinney et al., 2015). In this study, we explored whether and how KRAS* might directly influence immunity in the context of CRC progression and how such knowledge might improve clinical responses to ICB therapy.
RESULTS
KRAS* Promotes an Immune Suppressive Microenvironment in CRC Progression
Using mass cytometry (CyTOF) immunophenotyping with 20 lineage markers (Table S1), we compared tumors generated from mice harboring either conditional null alleles of Apc and Trp53 (designated iAP) or iKAP. The iAP and iKAP samples utilized for immune profiling had the same T1 to T2 tumor stage and tumor burden as confirmed by colonoscopy and histology, thus avoiding the influence of these variables on myeloid cell infiltration (Figures S1A-S1B). Immunohistochemistry (IHC) confirmed that iKAP, but not iAP, tumors stained strongly for GFP (indicator of KRAS* expression) and p-ERK (Figure S1B). Cytobank (Chen and Kotecha, 2014) based viSNE (Amir el et al., 2013) analysis of CyTOF data revealed a complex cellular landscape of epithelial cancer cells (EpCAM+CD45−), immune cells (EpCAM−CD45+), and other cells (EpCAM−CD45−) (Figure 1A). Notably, the major cell population consisted of infiltrating CD45+CD11b+ myeloid cells, which are increased in iKAP tumors as compared with iAP tumors (Figure S1C). FlowJo analysis revealed a significantly decreased percentage of T cells, particularly CD4+ T cells in iKAP tumors compared with iAP tumors (Figure 1B and Figure S1D). In contrast, MDSCs, specifically polymorphonuclear MDSCs (PMN-MDSCs) are dramatically increased in iKAP tumors compared with iAP tumors (Figure 1B and Figure S1D). These data indicate that KRAS* expression correlates with high MDSC and low T-cell infiltration.
Figure 1. KRAS* Promotes an Immune Suppressive Microenvironment in CRC Progression.
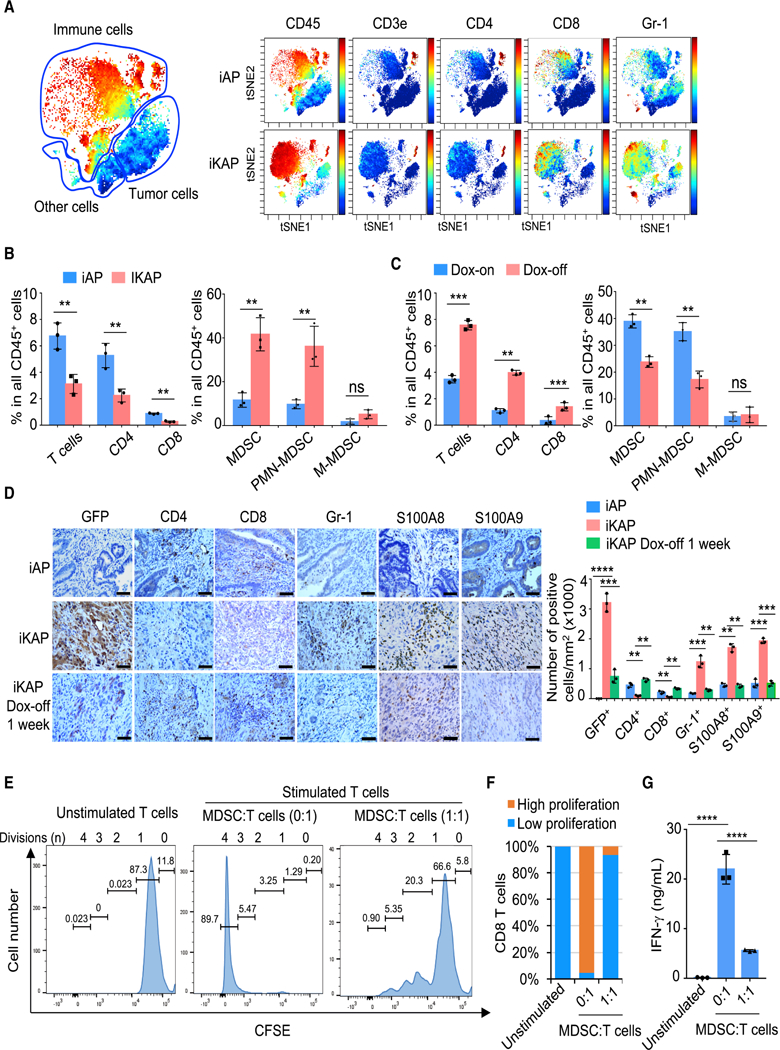
(A) viSNE analysis of immune cells from iAP and iKAP tumors colored by relative expression of CyTOF markers, with populations indicated.
(B) Quantification of tumor-infiltrating immune (CD45+) cells in iAP (n = 3) and iKAP (n = 3) primary CRC, assessed by CyTOF and analyzed by FlowJo. Cell populations were identified as T cells (CD45+CD3e+TCRβ+), CD4+ T cells (CD45+CD3e+TCRβ+CD8-CD4+), CD8+ T cells (CD45+CD3e+TCRβ+CD8+CD4-), MDSCs (CD45+CD11b+F4/80-Gr-1+), PMN-MDSC (CD45+CD11b+Gr-1+ Ly-6G+Ly-6C-), and M-MDSC (CD45+CD11b+Gr-1+ Ly-6G-Ly-6C+).
(C) Quantification of T cells, CD4+ and CD8+ T cells, and MDSCs in iKAP tumors following withdrawal of Dox for 1 week (n = 3) as compared with iKAP tumors maintained on Dox (n = 3).
(D) IHC analysis for CD4+ (CD4), CD8+ (CD8) and MDSC (Gr-1, S100A8, and S100A9) markers. Scale bars, 50 μm. Representative data of triplicate experiments are shown.
(E and F) Representative CFSE flow cytometry histograms (E) showing the effect on in vitro T-cell proliferation by MDSCs isolated from iKAP tumors and summarized result (F). Unstimulated T cells were used as negative control. Position of CFSE peaks can be used to denote the T-cell division times. High and low proliferation were defined as T-cell division ≥ 2 and ≤ 1, respectively (n ≥ 3, biological replicates).
(G) IFN-γ secretion by CD8+ T cells in the assay in (E), measured by ELISA (n = 3, biological replicates). In panels B-D and G, data represent mean ± s.d. * p < 0.05, ** p < 0.01, *** p < 0.001, **** p <0.0001, Student’s t-test.
See also Figure S1 and Table S1.
To solidify the role of KRAS* in driving MDSC infiltration, iKAP tumors were first generated through Dox administration and, upon confirmation of tumor formation by colonoscopy, dox was withdrawn and tumors analyzed at one week – a time point when KRAS* signaling is extinguished and tumors have yet to regress as confirmed by colonoscopy (Figures S1A-S1B). CyTOF analysis of these KRAS*-off tumors revealed decreased MDSCs and increased T-cells (Figure 1C, Figures S1E and S1F). IHC staining of KRAS*-expressing tumors further confirmed the lack of T-cell infiltration and conspicuous infiltration of MDSCs (positive for Gr-1 as well as for S100A8 and S100A9 (Zhao et al., 2012)) and marked decline of MDSCs following KRAS* extinction (Figure 1D).
Surprisingly, CD4+FOXP3+ Tregs were also greatly decreased in iKAP tumors compared to that of iAP tumors by CyTOF analysis (Figure S1G). Furthermore, extinguishing KRAS* signaling led to increased CD4+ FOXP3+ cell infiltration (Figure S1H). This striking observation was correlated with human TCGA CRC data, showing that FOXP3 expression was downregulated in samples with KRAS mutation (Figure S1I). Collectively, these results suggest that KRAS* blocks T-cell infiltration, including Tregs, in CRC (see discussion).
CyTOF analysis revealed that the Gr-1+ MDSCs showed high expression of S100A9 as well as ARG1 and inducible NOS (iNOS), which are two key factors implicated in MDSC-mediated immune suppression (Marvel and Gabrilovich, 2015) (Figure S1J). In addition, standard T-cell proliferation co-culture assay showed that these CD11b+Gr-1+ cells strongly suppressed CD3 and CD28 antibody-induced T-cell proliferation and activation, establishing that these CD11b+Gr-1+ cells are indeed functional MDSCs (Figures 1E-1G). Conversely, anti-Gr-1 treatment of iKAP tumors showed significant depletion of MDSCs and increased T cells, consistent with alleviation of MDSC suppression of T cells (Figures S1K-S1L). We conclude that KRAS* promotes an immune suppressive microenvironment in advanced CRC via infiltrating MDSCs.
KRAS* Suppresses Interferon (IFN) Responses in CRC
To investigate the mechanism through which KRAS* promotes an immune suppressive profile in CRC, we conducted Ingenuity Pathway Analysis (IPA) of RNA-seq profiles from iAP (n = 8) and iKAP (n = 7) tumors (T1 stage, dataset: SRP097890). KRAS* tumors showed downregulation of Interferon gamma (IFN-γ) and Interferon alpha (IFN-α) responses as the most significant pathways (Figure 2A). The prominent role of the IFN network in tumor immunity (Parker et al., 2016) prompted an assessment of whether IFN suppression resulted from a cancer cell intrinsic mechanism controlled by KRAS* versus a mechanism mediated by other cell types in the tumor microenvironment. To that end, we conducted IPA analysis of RNA-seq profiles of 6 iKAP CRC cell lines, which also showed that IFN-γ and IFN-α signatures are among the top pathways correlating with KRAS* expression (Figure 2B). These in silico findings were further validated by real-time quantitative PCR (real-time qPCR) analysis of representative IFN-stimulated genes including key IFN-α/γ network targets of IRF9 and the IL6-JAK-STAT pathway components (Figure 2C and Figure S2A). These murine data align with human CRC cell line data showing that KRAS mutation correlates with suppressed expression of IRF9, STAT1 and STAT2 (Klampfer et al., 2003) relative to KRAS wild-type CRC. Although IFN signaling is suppressed in KRAS* tumors and cell lines, the expression of either IFN-α or IFN-γ is not detectable by RNAseq analysis and CyTOF in cultured iKAP cell lines or iKAP tumor cells (data not shown), pointing to other mechanisms.
Figure 2. KRAS* Suppresses IFN Responses in CRC.
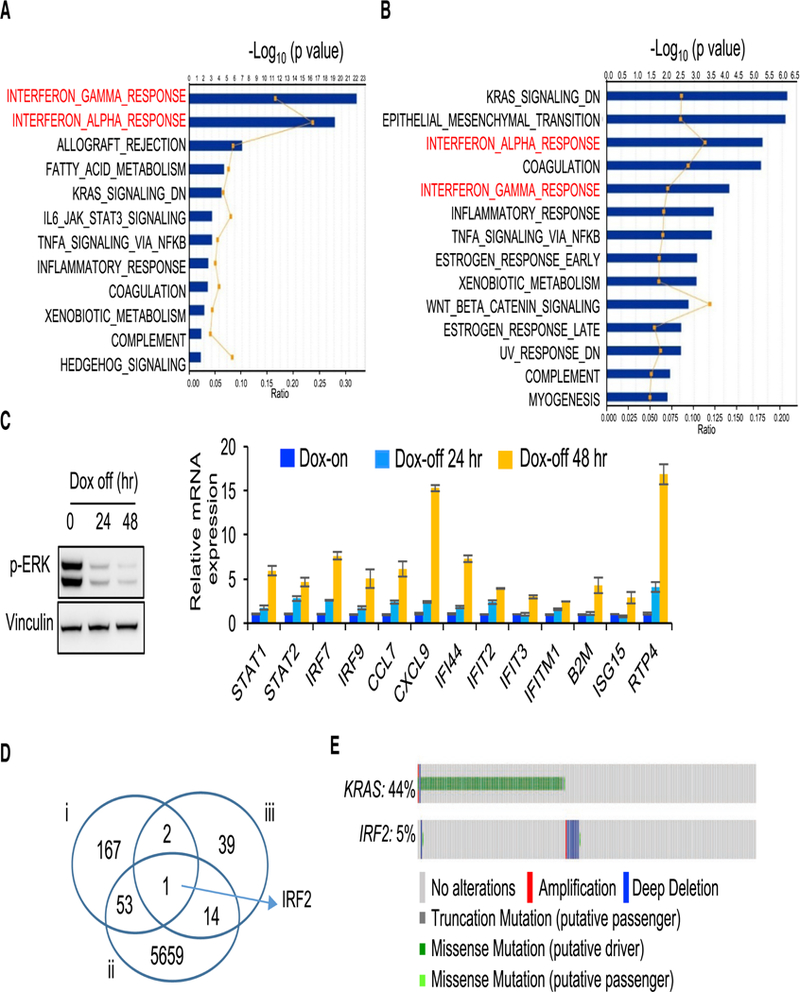
(A) IPA analysis of RNAseq data (iAP vs iKAP) showing the top 10 pathways that are suppressed in iKAP tumors (n = 7) as compared with iAP tumors (n = 8). Dataset: SRP097890. Graph displays category scores as-log10 (p value) from Fisher’s exact test.
(B) IPA analysis of RNAseq data (primary iKAP cell lines, Dox-off 24h vs Dox-on, n = 6 for each group) showing the top 10 pathways that are enriched in Dox-off cells as compared with Dox-on cells. Dataset: SRP097890. Graph displays category scores as -log10 (p value) from Fisher’s exact test.
(C) Real-time qPCR validation of representative IFN response genes in a cultured primary iKAP cell line (iKAP-1) maintained on Dox or following withdrawal of Dox for 24 or 48 hr (right). Extinction of KRAS* was measured by western blotting using anti-p-ERK antibody (left). Data are shown as mean ± s.d. from each of three independent experiments. n = 3.
(D) Venn diagram analysis cross three groups of genes. i: IFN-α and IFN-γ signature genes (n = 223); ii: Differentially expressed, invasive vs non-invasive (n = 5727); iii: Mutually exclusive with KRAS mutation (n = 56).
(E) Genomic alterations of KRAS and IRF2 in TCGA CRC database (n = 633). The gene alteration percentages are shown.
See also Figure S2, Table S2 and Table S3.
To forge a direct mechanistic link between KRAS* and IFN regulation, we conducted computational analyses designed to identify core genes that may underlie KRAS*-mediated suppression of IFN responses during CRC development and progression. To identify such pathway components, we integrated data across (i) IFN-α/γ responsive signatures (Table S2), (ii) genes that are differentially expressed in tumors from invasive versus non-invasive iKAP models (Fold change > 1.5 and p < 0.05; (Boutin et al., 2017)), and (iii) genes that showed mutually exclusive genomic deletion patterns with KRAS mutations in human CRC (p < 0.05; i.e., reasoning that this may indicate an epistatic relationship in naturally arising human CRC) (Table S3). These multi-dimensional datasets triangulated on a single gene -- interferon regulatory factor 2 (IRF2) (Figure 2D), revealing the striking finding that IRF2 deletion is mutually exclusive with KRAS mutation (Figure 2E; p < 0.05). Moreover, this mutually exclusive KRAS-IRF2 genomic pattern is present across multiple CRC datasets as well as lung and gastric cancer datasets where KRAS* is prevalent (Figure S2B).
KRAS* Suppresses IRF2 Mediated IFN Responses
The KRAS*-IRF2 link was further confirmed in primary iKAP tumors, which can sustain variable Cre-mediated activation of the Kras* allele (Boutin et al., 2017), showing low or negative IRF2 expression in tumor regions with KRAS* expression (Figure 3A and Figure S3A). Finally, KRAS*-dependent repression of IRF2 expression in vivo was confirmed with established iKAP tumors where Dox withdrawal resulted in decreased p-ERK expression and increased IRF2 expression at 48 hr and 1 week following KRAS* extinction (Figure 3B). Together, these genomic, transcriptomic, experimental and clinical correlations prompted us to hypothesize that repression of IRF2 is a key mechanism underlying the KRAS*-driven immune suppression profile in the tumor microenvironment of advanced CRC.
Figure 3. IRF2 is a Key Downstream Target of KRAS* Mediating IFN Signaling Suppression.
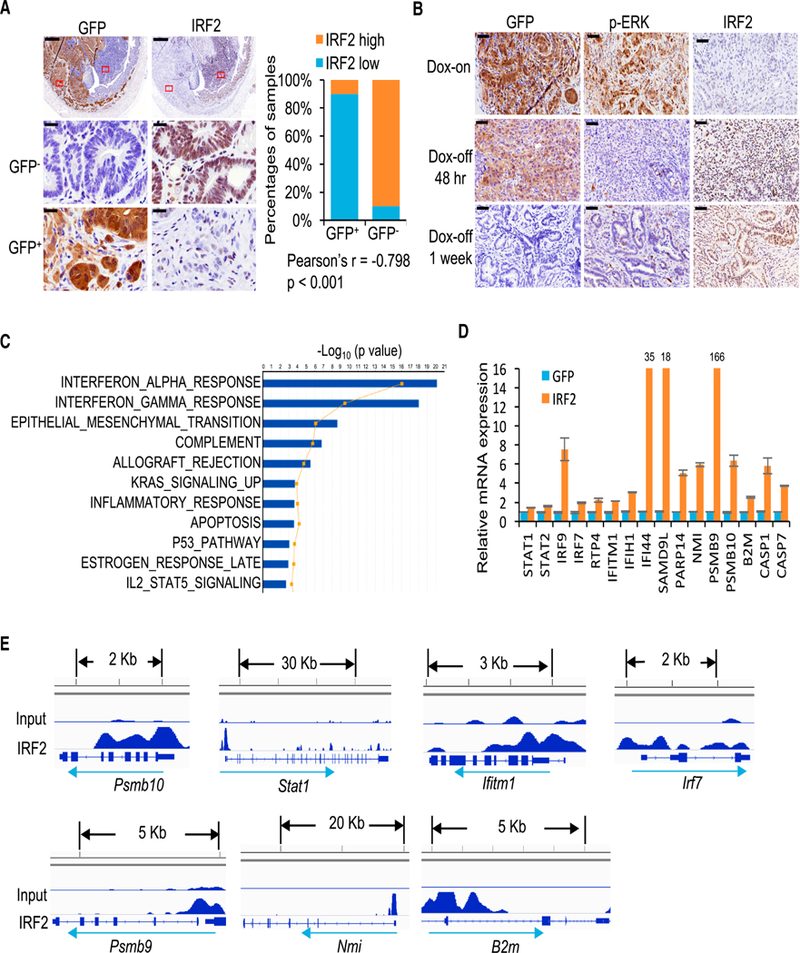
(A) IHC staining of IRF2 in areas with or without KRAS* expression in the same iKAP mouse tumor. GFP is used as a marker of KRAS* expression. The lower panels are amplified images of the boxed regions. Scale bars, 500 μm (upper panels) and 20 μm (middle and lower panels). The right graph shows quantification and Pearson Correlation of IRF2 and KRAS* expression in iKAP CRC (n = 20, biological replicates).
(B) IHC staining of IRF2 in iKAP CRC maintained on Dox (Dox-on) or taken off Dox (Dox-off) for 48 hr (upper) or 1 week (lower). Scale bars, 50 μm.
(C) The top 10 pathways changed in IRF2-overexpressing cells as compared with control cells revealed by microarray and IPA analysis.
(D) Real-time qPCR validation of representative IFN response genes in iKAP cells overexpressing IRF2 as compared with vector control. Data are shown as mean ± s.d. n = 3.
(E) ChIP-seq in iKAP cells revealed binding peaks for IRF2 on the promoters of IFN response genes.
See also Figure S3.
IRF2 is a transcription factor that binds to the IFN-stimulated response element, IFN consensus sequence and IRF element (Harada et al., 1989; Tanaka et al., 1993). To further identify IRF2 targets governing tumor immunology and illuminate KRAS* driven immune suppression mechanisms, we conducted microarray expression analysis of iKAP cell lines with enforced IRF2 expression (Figure S3B). IPA analysis revealed that IFN-α/γ signatures were reversed in IRF2-overexpressed iKAP cells as compared with iKAP cells (Figure 3C). Genes in the IRF2 mediated IFN-α/γ signatures showed upregulation, including interferon signaling molecules (STAT1, STAT2, IRF9, IRF7), those involved in host defense-related regulation of immunity (RTP4, IFITM1, IFIH1, IFI44, PARP14, NMI, SAMD9L), antigen presentation (PSMB9, PSMB10, B2M) and cell death (CASP7, CASP1) (Figure 3D). Moreover, ChIP-seq analysis of IRF2 revealed binding peaks on most of these genes consistent with direct transcriptional control by IRF2 and its importance in regulating IFN responses (Figure 3E). Finally, enforced IRF2 expression in KRAS*-expressing iKAP cell lines mirrored the interferon network gene expression patterns observed in iKAP cells following KRAS* extinction (Figure S3C, see also Figure 2C and Figure S2A). We conclude that IRF2 is a major regulator of KRAS*-mediated IFN network suppression.
IRF2 Suppresses KRAS*-Driven MDSC Migration via the CXCL3/CXCR2 Axis
The role of KRAS* and IRF2 in the accumulation of CD11b+Gr-1+ MDSCs was tested by assessing whether conditioned media from iKAP cells with different expressions of KRAS* or IRF2 could alter MDSC migration in vitro. Decreased MDSC migration was observed with conditioned media from both KRAS* extinction and IRF2 overexpression cultures (Figure 4A). In addition, the knock down of IRF2 in the MC38 CRC cell line (Figure 4B), which is Kras wild-type and has high endogenous IRF2 expression, significantly increased migration of MDSCs toward the condition medium in vitro (Figure 4C) and increased the infiltration of MDSCs in MC38 tumors transplanted in syngeneic C57BL/6J mice (Figure 4D and Figure S4A). Together, these data support the view that suppression of IRF2 is a key mediator of MDSC accumulation in KRAS* CRC.
Figure 4. IRF2 Suppresses KRAS*-Driven MDSC Migration by Targeting CXCL3/CXCR2 Axis.
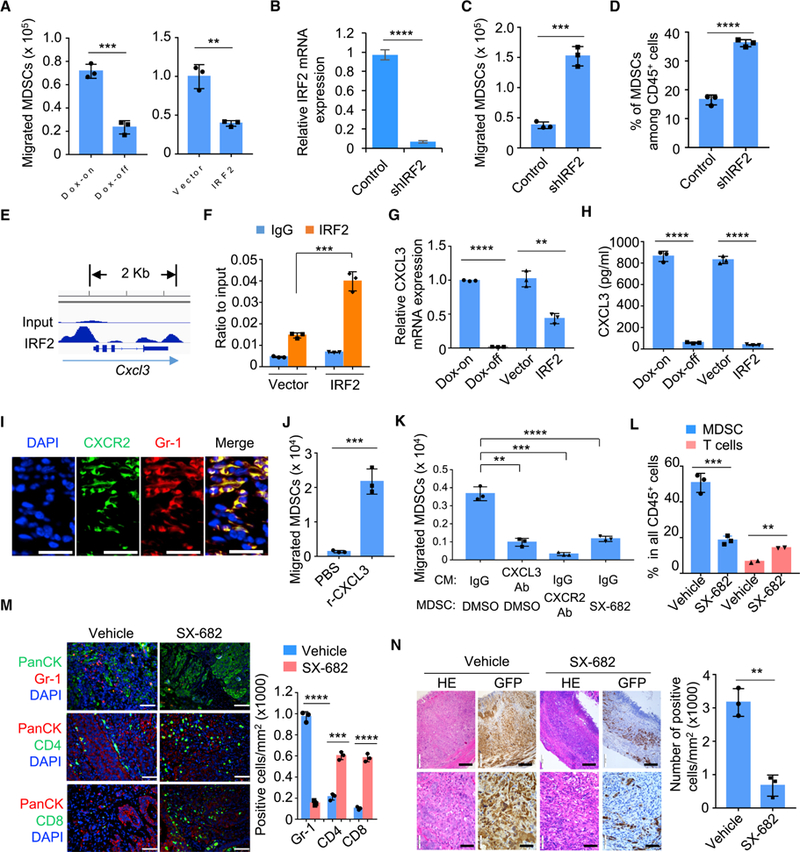
(A) Migration of MDSCs toward conditioned medium from cultured primary iKAP cells (Dox-on vs Dox-off 24 hr), or iKAP cells overexpressing IRF2 compared with vector control, were evaluated using in vitro transwell migration assay in triplicate.
(B) Real-time qPCR measurement of IRF2 expression in MC38 cells using control shRNA or shRNA specific to mouse IRF2 (shIRF2).
(C) Migration of MDSCs toward conditioned medium from MC38 cells (control shRNA vs shIRF2) were analyzed by transwell MDSC migration assays in triplicate.
(D) MDSC infiltration in the MC38 tumors (control shRNA vs shIRF2) were analyzed by CyTOF.
(E) IRF2 binding peaks at the Cxcl3 locus in iKAP cells revealed by ChIP-seq.
(F) ChIP-PCR validation of IRF2 binding to the Cxcl3 promoter.
(G and H) Real-time qPCR (G) and ELISA (H) analysis of CXCL3 in cultured primary iKAP CRC cell lines (Dox-off 24 hr vs Dox-on); or in iKAP cells overexpressing IRF2 or vector control constructs.
(I) Expression and co-localization of CXCR2 and Gr-1 in iKAP CRC tissues by immunofluorescence (IF) staining. Scale bars, 20 μm.
(J) Migration of MDSCs toward basal media supplemented with recombinant CXCL3.
(K) Migration of MDSCs toward conditioned medium (CM) from iKAP tumor cells treated with Vehicle or IgG control, CXCL3-neutralizing antibody, SX-682, or CXCR2-neutralizing antibody.
(L) The effect of SX-682 on MDSC and total T-cell infiltration in iKAP mice, measured by flow cytometry. n = 3 for each cohort.
(M) IF staining and quantification for MDSC (Gr-1), CD4+ T cells (CD4) and CD8+ T cells (CD8) in the presence or absence of SX-682. Scale bars, 50 μm.
(N) The effect of SX-682 on the tumor histopathology in iKAP CRC tumors. Hematoxylin and eosin (HE) staining shows the histology of tumor tissues. IHC against GFP shows tumor cells with KRAS* expression. The right graph shows the quantification of tumor cells (GFP) as analyzed by IHC. n = 3, biological replicates. Scale bars, 100 μm.
In A-D, F-H and J-N, analyses were done in triplicate. Data represent mean ± s.d. from each of three independent experiments. * p <0.05, * * p < 0.01, * * * p < 0.001, **** p < 0.0001. Student’s t-test.
See also Figure S4.
As cytokines play integral roles in tumor immunity including the heterotypic interactions between cancer cells and non-cancer cells in the tumor microenvironment (West et al., 2015), we audited the expression of 114 common cytokines and chemokines (Cameron and Kelvin, 2000) in our system and intersected the expression data with IRF2 ChIP-seq data of those genes. These integrated datasets revealed that Cxcl3 harbors IRF2 binding elements in its promoter with enhanced binding upon IRF2 overexpression (Figures 4E-4F). Real-time qPCR (Figure 4G) and ELISA (Figure 4H) assays showed that CXCL3 expression and secretion were significantly suppressed with enforced IRF2 expression or following KRAS* extinction in iKAP cells. Granulocyte/neutrophil chemokines mainly include ELR+ CXC chemokines CXCL1, CXCL2, CXCL3, CXCL5, CXCL6, CXCL7 (PPBP), as well as IL-8 (CXCL8). These chemokines are ligands for CXCR2 and well known as powerful neutrophil chemoattractants (Griffith et al., 2014; Keeley et al., 2010). The importance of CXCL3 as a key mediator in our model derived from the findings that (i) the expression of CXCL3 is directly suppressed by IRF2 in a KRAS* dependent manner (Figures 4E-4H); (ii) other chemokines are not directly regulated by IRF2 as revealed by our ChIP-seq experiment showing minimal peaks at Cxcl1, Cxcl2, Cxcl5, and Cxcl7 (Ppbp) loci (data not shown); (iii) high CXCL3 expression versus very low expression of CXCL1, CXCL2, and CXCL5 by RNAseq analysis (Figure S4B); and (iv) CXCL6, CXCL7 and CXCL8 expression was not detectable. Moreover, CXCR2, the cognate receptor for CXCL3, is crucial for MDSC migration from bone marrow to tumors through its interaction with tumor-secreted ligands (Katoh et al., 2013). These data point to a potential role of the CXCL3/CXCR2 axis in shaping the immune microenvironment of advanced CRC. Consistent with this possibility, immunofluorescence staining showed that CXCR2 expression was co-localized with Gr-1 in iKAP tumors (Figure 4I and Figure S4C). In addition, the knock down of CXCL3 in the iKAP CRC cell line (Figure S4D) significantly decreased migration of MDSCs toward the condition medium in vitro (Figure S4E). The role of CXCL3/CXCR2 in KRAS*-mediated MDSC recruitment was further supported by increased MDSC migration upon addition of recombinant mouse CXCL3 protein to basic medium (Figure 4J); reciprocally, decreased MDSC migration was observed with the addition of the CXCR2 inhibitor SX-682 (Lu et al., 2017a) or anti-CXCL3 neutralizing antibody to conditioned medium derived from KRAS*-expressing iKAP cultures (Figure 4K). Furthermore, daily SX-682 treatment over a 30-day dosing schedule drastically reduced MDSC and increased T-cell infiltration in KRAS*-expressing iKAP CRC tumors (Figures 4L-4M); this treatment also decreased cancer cells and increased dead cells (Figure 4N and Figure S4F) similar to the response of anti-Gr-1 treatment (Figure S1L). Systemically, SX-682 treatment also reduced MDSCs in the spleen of mice bearing iKAP, but not iAP, CRC (Figures S4G-S4H). Thus, the CXCL3-CXCR2 axis plays a prominent role in the recruitment of MDSCs into the KRAS*-expressing iKAP CRC microenvironment, and inhibition of this axis profoundly impairs tumor growth and progression.
IRF2 Overexpression or CXCR2 Inhibition Increases Sensitivity of KRAS* CRC Cells to anti-PD-1 Therapy
Previous work has established that mutations in interferon signaling are associated with acquired resistance to PD-1 blockade in melanoma (Zaretsky et al., 2016). Given that IRF2 regulates the IFN responses in CRC and IRF2 is deleted in KRAS wild-type CRC or transcriptionally down-regulated in KRAS* CRC, we reasoned that the inherent resistance of CRC to ICB therapy may be due in part to the KRAS* driven suppression of IRF2 and IFN signaling. We thus explored whether overexpression of IRF2 in KRAS* CRC cells would normalize the IFN response. First, we confirmed that enforced expression of IRF2 in iKAP cells had no impact on cell proliferation in vitro or tumor growth in SCID mice, consistent with the hypothesis that the biological impact of IRF2 requires a functional immune system (Figures S5A-S5B). We next utilized the syngeneic MC38 CRC cell line model, which is Kras wild-type and moderately responsive to anti-PD-1 treatment in vivo (Juneja et al., 2017; Ngiow et al., 2015). In this model, a KRASG12D (KRAS*) expression construct, alone or together with an IRF2 expression construct, was stably transduced to generate MC38/KRAS* or MC38/KRAS*/IRF2 cell lines (designated MC38K and MC38KI, respectively) (Figure 5A). Enforced KRAS* expression increased MC38 cell proliferation in vitro, while IRF2 had no effect (Figure S5C). Consistent with the iKAP model, real-time qPCR revealed that MC38K showed suppression of representative IFN response genes, which was restored in the MC38KI cells (Figure 5B). Notably, MC38KI cells exhibited decreased CXCL3 expression (Figure 5B) and MDSC infiltration (Figure 5C and Figure S5D) and tumor growth in C57BL/6J mice (Figure S5E). In anti-PD-1 treatment studies (Figure S5F), MC38K tumors grew slightly faster than MC38 controls, while MC38KI showed significantly slower tumor growth relative to MC38 and MC38K arms (p < 0.05) (Figure 5D and Figure S5G). These tumor growth findings tracked well with the improved survival observed in MC38KI tumor bearing mice, establishing that anti-PD-1 antitumor activity is impaired upon KRAS* expression and restored upon enforced IRF2 expression in these KRAS*-expressing MC38 cells (Figure 5E). Further studies showed that knockdown of IRF2 dampens the sensitivity of MC38 tumors to anti-PD-1 therapy (Figures S5H-S5I), suggesting that IRF2 expression is a key determinant in maintaining the sensitivity to anti-PD-1 in CRC.
Figure 5. Overexpression of IRF2 Increases the Sensitivity of KRAS* CRC Cells to ICB Therapy.
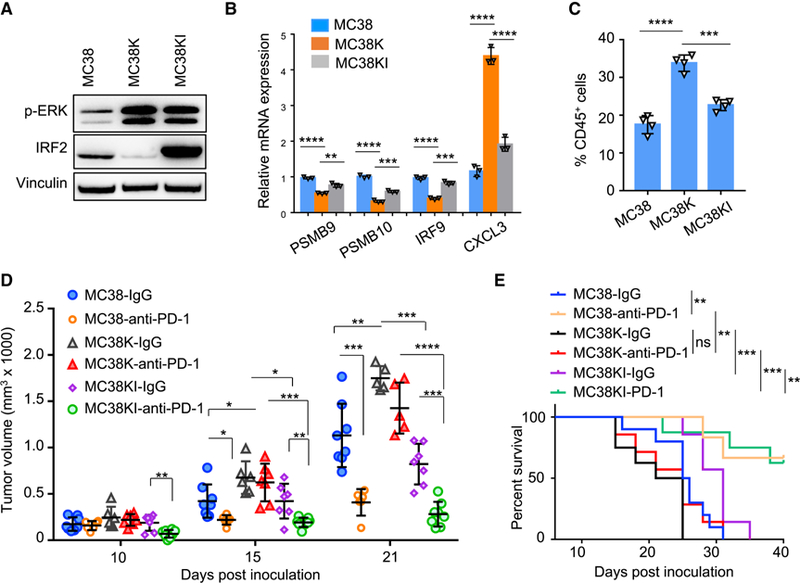
(A) Expression of IRF2 and p-ERK in MC38, MC38K, and MC38KI cells by western blotting.
(B) Real-time qPCR showed expression of representative IFN stimulated genes and CXCL3 gene in the indicated cell lines.
(C) MDSCs (CD45+CD11b+Gr-1+) were examined in MC38, MC38K, and MC38KI tumors, analyzed by Flow cytometry.
(D) Tumor growth of MC38, MC38K, and MC38KI tumors in C57BL/6J mice treated with anti-PD-1 or isotype control.
(E) Survival of C57BL/6J mice with MC38, MC38K, and MC38KI tumors and treated with anti-PD-1 or isotype control. ** p < 0.01, *** p < 0.001, log-rank test. In B-D, data represent mean ± s.d. * p < 0.05; ** p < 0.01; *** p < 0.001; **** p < 0.001. Student’s t-test.
See also Figure S5.
While the above MC38 studies establish a potential role for IRF2 deletion or KRAS*-mediated IRF2 downregulation in de novo resistance to ICB therapy, the MC38 model is a MSI-H model and may not accurately reflect the impact of KRAS*-IRF2 in MSS CRC (Efremova et al., 2018); that said, these MC38 studies gain relevance as only a fraction of MSI-High CRC respond to ICB (Overman et al., 2018). To that end, we assessed the impact of CXCL3-CXCR2 inhibition in the iKAP model (Figure S6A). Consistent with human studies (Le et al., 2015), anti-PD-1 did not extend the survival of the iKAP mice (Figure 6A). The CXCR2 inhibitor SX-682 produced a modest increase in survival, while combined SX-682 and anti-PD-1 treatment significantly extended survival of the iKAP mice. The basis for the meager responses to SX-682 treatment are not known, but it is worth noting that this single agent treatment also enhanced infiltration of Treg (CD4+FOXP3+) cells in iKAP tumors, while SX-682/anti-PD-1 combination therapy significantly increased the CD8+/Treg ratio over either single agent (Figures 6B-6C), a noted feature associated with successful ICB based therapy (Gao et al., 2016). Similar results were observed using the MC38K tumor model (Figures 6D-6E and Figures S6B-S6D). Together, these data reinforce our hypothesis that MDSCs contribute to the de novo resistance of KRAS* CRC to ICB therapy, and that targeting CXCL3/CXCR2 can enhance ICB efficacy by the reduction of MDSCs in the tumor microenvironment.
Figure 6. Targeting CXCR2 Increases the Sensitivity of KRAS* CRC Cells to Anti-PD-1 Therapy.
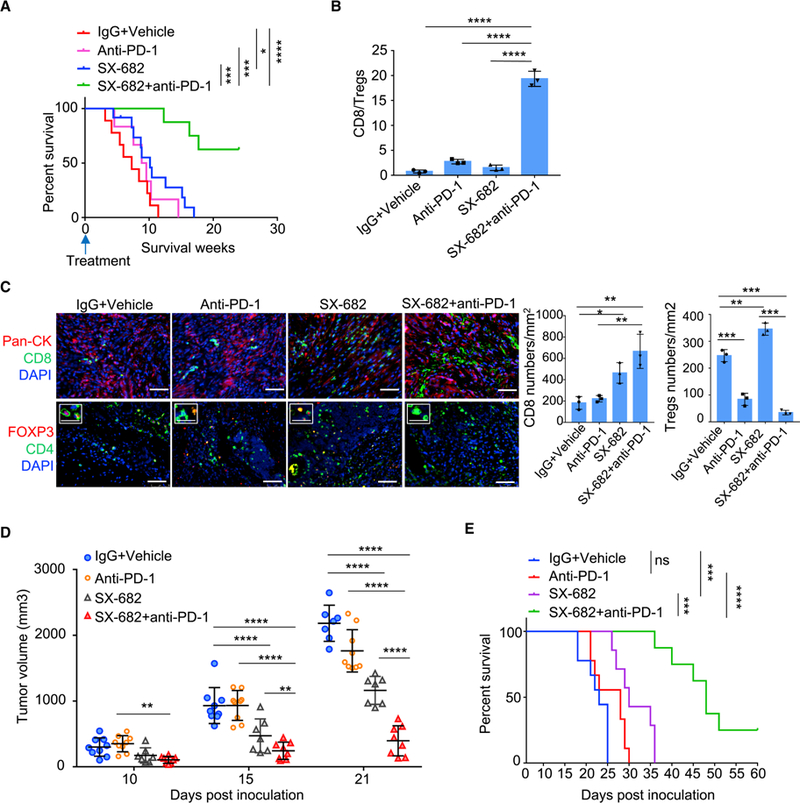
(A) Survival of iKAP mice treated with SX-682 or anti-PD-1 as a single agent, or SX-682 treatment in combination with anti-PD-1. IgG+Vehicle: n = 9. Anti-PD-1: n = 6. SX-682: n = 12. SX682 plus anti-PD-1: n = 8. n means biological replicates. * p < 0.05, *** p < 0.001, **** p < 0.0001, log-rank test.
(B) Ratio of CD8+ T cells to FOXP3+ regulatory T cells in iKAP tumors treated with SX-682 plus anti-PD-1 as compared to those treated with SX-682 or anti-PD-1 monotherapy.
(C) Representative images and quantification of CD8 and Tregs analyzed by IF staining in iKAP CRC tumors. n = 3, biological replicates. Scale bars, 50 μm. The small boxed areas in the bottom row are amplified images of cells with FOXP3 and CD4 staining. Scale bars in the small boxed areas, 25 μm.
(D) Tumor volumes of MC38K in C57BL/6J mice treated with anti-PD-1, SX-682, SX-682 plus anti-PD-1, or isotype control.
(E) Survival of MC38K tumor bearing C57BL/6J mice treated with anti-PD-1 or SX-682 plus anti-PD-1. *** p < 0.001, **** p < 0.0001, log-rank test.
In B-D, data represent mean ± s.d.* p < 0.01; ** p < 0.01; **** p < 0.0001. Student’s t-test.
See also Figure S6.
IRF2 Expression Predicts anti-PD-1 Therapy Responses in CRC
To assess a potential link between KRAS* and MDSC prominence in human CRC, TCGA CRC data were analyzed with an established MDSC signature (Wang et al., 2016), showing a strong positive correlation between high KRAS signaling and high expression of the MDSC signature (Figure S7A). In addition, analyses using Oncomine revealed that CXCL3 expression is positively correlated with KRAS mutation, while negatively correlated with IRF2 expression (Figures S7B-S7D). Furthermore, Gene Set Enrichment Analysis (GSEA) of the TCGA CRC datasets revealed that IFN-γ and IFN-α signatures are the top most suppressed pathways in KRAS* CRC (Figure 7A). Since KRAS mutations are more frequent in MSS CRC tumors than in MSI tumors, GSEA was performed exclusively in MSS CRC patients, also revealing that IFN signatures were among the top pathways that were suppressed in KRAS* CRC patients with MSS disease (Figure 7A). In contrast, the IFN-γ signature was among the top activated pathways in IRF2-high CRC (Figure 7B). To further assess the correlation between IRF2 expression and KRAS mutation status, IHC was performed in tissue microarrays of 42 KRAS wild-type and 40 KRAS mutant human CRC samples, confirming the reciprocal pattern of KRAS mutation and IRF2 expression -- 64% KRAS wild-type samples showed detectable IRF2 expression compared with 30% of KRAS mutant samples (Figure 7C). While these data reinforce the negative regulation of IRF2 expression by oncogenic KRAS, additional study is encouraged to fully define mechanisms other than oncogenic KRAS-mediated suppression of IRF2 (e.g., oncogenic BRAF mutations). Finally, as ICB shows activity in a minority of MSI-H patients, we asked whether IRF2 level might correlate with response to anti-PD-1 therapy. To that end, IRF2 expression was examined in MSI-H CRC biopsy samples from 14 patients prior to PD-1 therapy. In this small cohort, higher IRF2 expression correlated positively with better response to anti-PD-1 therapy (Figure 7D). While intriguing and consistent with the above experimental data, we emphasize that these preliminary human studies will require larger sample sets and prospective analyses.
Figure 7. Clinical Relevance of KRAS* and IRF2 Expression in CRC Patients.
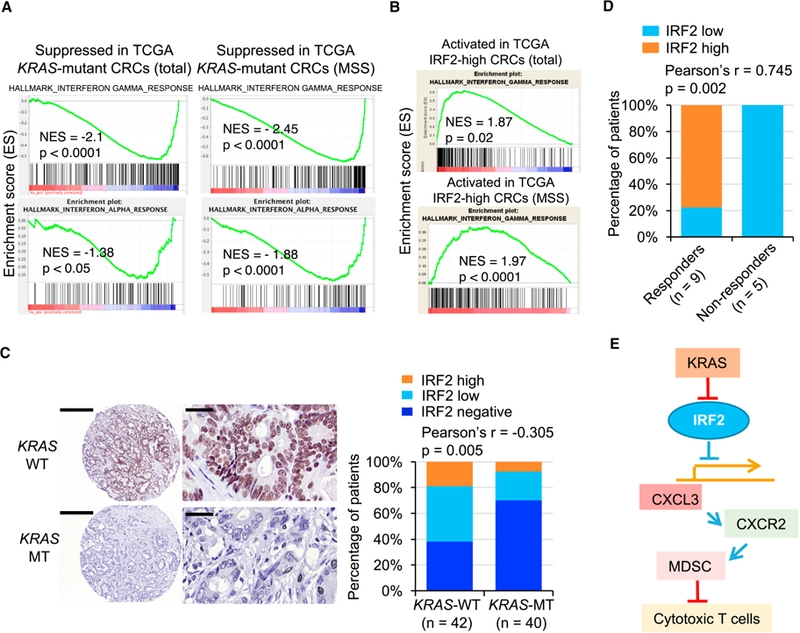
(A) GSEA analysis identified the IFN-γ and IFN-α signatures as the top suppressed pathways in total and MSS KRAS* CRC in TCGA CRC data.
(B) GSEA analysis identified the IFN-γ signature as the top activated pathway in IRF2-high CRC patients (TCGA).
(C) Representative IHC staining for IRF2 in human CRC TMA with wild-type KRAS (n = 42) and mutant KRAS (n = 40). The bar graph shows Pearson Correlation and two-tailed p value. Scale bars, 400 μm (left) and 40 μm (right).
(D) Correlation analysis of IRF2 expression and response to anti-PD-1 therapy in MSI-H CRC (n = 14). We define CR (Complete Response), PR (Partial Response) and SD (Stable Disease) without subsequent PD (Progression Disease) as responders, while PD as non-responders. CR: n = 1; PR: n = 7; SD: n = 1; PD: n = 5. The graph shows Pearson Correlation and two-tailed p value.
(E) Schematic representations of the role of KRAS/IRF2 axis in immune suppression and ICB resistance in CRC.
See also Figure S7.
DISCUSSION
In this study, we establish that an under-appreciated function of oncogenic KRAS in CRC is to drive an immune suppressive program to enable tumor progression. Elucidation of the tumor biology and key KRAS* effectors in KRAS*-CRC enabled a patient responder hypothesis to ICB therapy as well as drug combination strategies to enhance responsiveness to ICB in KRAS* CRC. Specifically, in proof of concept studies, we establish that restoration of IRF2 expression or therapeutic inhibition of MDSC recruitment via targeting CXCL3-CXCR2 signaling increased anti-tumor immune response and sensitivity to ICB therapy for KRAS* CRC (Figure 7E). In addition, analysis of anti-PD-1 responses suggests that IRF2 might serve as a biomarker to predict responders to anti-PD-1 therapy.
While ICB therapy has provided clinical benefit to some patients with mismatch repair-deficient disease, the vast majority of CRC patients do not respond to ICB therapy (Le et al., 2015). Multiple alterations in the cancer cells and tumor microenvironment have been identified as possible reasons for ICB therapy failure, including lack of antigenic mutations, T-cell exclusion, loss of IFN responses, accumulation of immunosuppressive cells, among other mechanisms (Chen and Mellman, 2017; Sharma et al., 2017). The most straightforward mechanism of de novo resistance to ICB is the lack of T-cell infiltration or recognition by T cells due to the absence of tumor specific antigens or the deficiency of antigen-presenting machinery (Marincola et al., 2000). Our expression studies highlight a prominent role of KRAS*-IRF2 in driving multiple ICB resistance mechanisms in CRC via suppression of the antigen processing machinery (i.e., suppressed MHC1 as well as PSMB9, PSMB10 and B2M expression), which correlates with low T-cell infiltration in iKAP tumors similar to that observed in human microsatellite stable CRC. In addition, loss of IRF2 led to suppression of genes involved in host defense-related regulation of immunity (i.e., RTP4, IFITM1, IFI44, PARP14, NMI, SAMD9L) (Dunn et al., 2005), which enables cancer cell escape from T cells, thereby resulting in primary resistance to ICB therapy. Moreover, MDSC is a major driver of an immunosuppressive tumor microenvironment and can contribute to patient resistance to ICB therapy (Davis et al., 2017; Weber et al., 2018). Strategies combining MDSC targeting with immune checkpoint inhibitors have been used in various clinical trials (e.g. NCT03302247). SX-682 is a small-molecule dual-inhibitor of CXCR1/2 that we have shown previously to enhance ICB therapy efficacy in a prostate cancer mouse model (Lu et al., 2017a). Currently, using the combination of ICB and SX-682 to treat melanoma is in a phase 1 clinical trial (NCT03161431). Our findings emphasize that KRAS* can induce an immune-suppressive tumor microenvironment via the IRF2-CXCL3-CXCR2 pathway and MDSCs, pointing to combination therapeutic strategies for advanced CRC.
In the current study, turning KRAS* on and off in iKAP model is associated with modulation of key IFN-α/γ network targets including IRF9 and the IL6-JAK-STAT pathway by suppressing IRF2. IFNs are pleiotropic cytokines with a long history of involvement in the development and treatment of cancer (Parker et al., 2016). IFNs affect tumor cells by inhibiting proliferation and inducing apoptosis, differentiation, migration and cell surface antigen expression. IFNs also activate anti-tumoral immunity by stimulating the innate and adaptive cytotoxic lymphocyte populations and negatively regulating suppressive cell types known to dampen anti-tumoral immunity (Parker et al., 2016). Loss of IFN responses would also be predicted to suppress tumor immune surveillance (Parker et al., 2016). Indeed, mutations impairing IFN signaling were discovered in melanomas with acquired resistance to PD-1 blockade (Zaretsky et al., 2016). Similarly, deletion of IFN-γ pathway genes in tumor cells was identified as a mechanism of resistance to anti-CTLA-4 therapy (Gao et al., 2016). In CRC, loss of IFNAR1 in tumor stroma stimulates CRC development and growth, plays a key role in formation of the immune-privileged niche, and predicts poor prognosis in human CRC patients (Katlinski et al., 2017). It is worth noting that although both IFN-α and IFN-γ signaling are suppressed by the KRAS*/IRF2 axis, none of the IFN-α or IFN-γ cytokines are expressed by cancer cells in CRC, indicating that KRAS mainly regulates the tumor cell intrinsic IFN network in CRC by modulating the transcription of downstream IFN targets via IRF2.
MDSCs are an immature population of myeloid cells and are major regulators of immune responses in cancers (Lu et al., 2011) and have been implicated in promoting angiogenesis, tumor cell invasion, metastases (Yang et al., 2004; Yang et al., 2008). There are two different types of MDSC: polymorphonuclear MDSC (PMN-MDSC) and monocytic MDSC (M-MDSC) (Kumar et al., 2016; Talmadge and Gabrilovich, 2013). Like neutrophils, PMN-MDSC are recruited primarily by angiogenic CXC chemokine family members. As an angiogenic chemokine, CXCL3 was reported to participate in chemotaxis and cell activation of neutrophils (Rainard et al., 2008). In addition to CXCL3, other granulocyte/neutrophil chemokines may also play a supporting role in recruiting PMN-MDSCs into the CRC tumors since they are expressed by human CRC as determined by Oncomine analysis (data not shown). However, CXCL1, CXCL2, CXCL5 are expressed at much lower levels than CXCL3. In addition, CXCL6, CXCL7 and CXCL8 are not detectable in the iKAP tumors. These observations suggest that CXCL3 is a major chemokine in the iKAP model, we cannot exclude a role for other low expressing CXCR2 ligands in attracting MDSCs to the TME. Furthermore, we acknowledge that other genetic events in human CRC may also regulate specific chemokines or a group of chemokines to attract CXCR2-expressing MDSCs. Based on the fact that these factors all signal via CXCR2, targeting CXCR2 could represent one of the most effective strategies to block MDSCs recruitment in human CRC. In addition, it was shown previously that oncogenic KRAS* induces GM-CSF production, which leads to increased MDSC levels in pancreas cancer (Pylayeva-Gupta et al., 2012). However, GM-CSF expression is low in our CRC model and is not a direct target of IRF2 (data not shown), underscoring the context specific regulation of cytokine production in different tumor types. Together, our study emphasizes that KRAS* can serve to systematically reprogram the tumor microenvironment to evade the T-cell responses via the IRF2-CXCL3 pathway and immunosuppressive myeloid cells.
In a human CRC study with approximations to our iKAP model, Masugi et al showed that PD-L1 expression is inversely associated with FOXP3+ Treg cell density in CRC tissues (Masugi et al., 2017). We found that high PD-L1 is associated with KRAS* expression (data not shown), which is consistent with our data that KRAS* is negatively correlated with Tregs. This finding is consistent with a recent study in which oncogenic RAS signaling increases PD-L1 expression (Coelho et al., 2017). Together, our in vivo data strongly support the view that KRAS* suppresses Tregs in mouse tumors and extinguishing KRAS signaling or depleting MDSCs significantly increased Tregs infiltration. We do not understand the basis for this observation, although it suggests that combined targeting both MDSCs and Tregs may improves the efficacy of ICB therapy in CRC.
While MSI-H status is a robust biomarker predictive of response to ICB therapy, only a fraction of MSI-H CRC responds to anti-PD-1 therapy (Overman et al., 2018; Overman et al., 2017). Our data showing that the IRF2 expression levels in MSI-H CRC are positively correlated with their response to anti-PD-1 therapy may serve to further guide application of this therapy. Correspondingly, IRF2 depletion in MSI-H MC38 cells, a line known to respond to ICB (Efremova et al., 2018), results in resistance to ICB. We propose that IRF2 expression may serve as valuable ICB response biomarker in CRC. KRAS mutation status was not correlated with anti-PD-1 therapy efficacy in the limited samples used in the current study, which was consistent with that demonstrated recently (Overman et al., 2018), while our iKAP model primarily is similar to the human CMS4 subtype of CRC that is resistant to ICB. Thus, although KRAS/BRAF status in MSI-H CRC is not a predictor of ICB response, it remains possible that KRAS mutation status in MSS CRC could be a predictor of innate resistance to ICB, mediated by the suppression of IRF2. In summary, our studies suggest the use of combination CXCR2 inhibitor with ICB therapy in patients with advanced CRC who are uniformly failing today’s standard of care (Katoh et al., 2013; Steele et al., 2016).
STAR★METHODS
KEY RESOURCES TABLE
| REAGENT or RESOURCE | SOURCE | IDENTIFIER |
|---|---|---|
| Antibodies | ||
| Rat anti-Ly-6G/Ly-6C (Gr-1) conjugated to 139La (clone RB6–8C5) | BioLegend | Cat#108402 |
| Anti-Ly-6G conjugated to 141Pr (clone 1A8) | DVS-Fluidigm | Cat#3141008B |
| Anti-CD11c conjugated to 142Nd (Polyclonal) | DVS-Fluidigm | Cat#3142003B |
| Anti-TCR β conjugated to 143Nd (H57–597) | DVS-Fluidigm | Cat#3143010B |
| Anti-CD4(Ms) conjugated to 145Nd (RM4–5) | DVS-Fluidigm | Cat#3145002B |
| Anti-CD8a (Ms) conjugated to 146Nd (53–6.7) | DVS-Fluidigm | Cat#3146003B |
| Anti-CD45 (Ms) conjugated to 147Sm (30-F11) | DVS-Fluidigm | Cat#3147003B |
| Anti-CD11b (Ms) conjugated to 148Nd (M1/70) | DVS-Fluidigm | Cat#3148003B |
| Anti-CD3e conjugated to 152Sm (145–2C11) | DVS-Fluidigm | Cat#3152004B |
| Anti-F4/80 conjugated to 159Tb (BM8) | DVS-Fluidigm | Cat#3159009B |
| Anti-Ly-6C conjugated to 162Dy (HK1.4) | DVS-Fluidigm | Cat#3162014B |
| Anti-Arginase-1 conjugated to 166Er (Polyclonal) | DVS-Fluidigm | Cat#3166023B |
| Anti-RORgt conjugated to 168Er (600214) | DVS-Fluidigm | Cat#3168018B |
| Anti-CD206, MMR conjugated to 169Tm (C068C2) | DVS-Fluidigm | Cat#3169021B |
| Anti-CD326 (Ms) conjugated to 174Yb (G8.8) | BioLegend | Cat#118201 |
| Anti-B220, CD45R conjugated to 176Yb (RA3–6B2) | DVS-Fluidigm | Cat#3176002B |
| Anti-CD25 conjugated to 150Nd (3C7) | DVS-Fluidigm | Cat#3150002B |
| Anti-FOXP3 conjugated to 158Gd (FJK-16s) | DVS-Fluidigm | Cat#3158003A |
| Anti-CD62L conjugated to 160Gd (MEL-14) | DVS-Fluidigm | Cat#3160008B |
| Anti-CD44 conjugated to 171Yb (IM7) | DVS-Fluidigm | Cat#3171003B |
| Anti-B220 (BV510, clone RA3–6B2) | BioLegend | Cat#103247 |
| Anti-CD11b (BV605, clone M1/70) | BioLegend | Cat#101237 |
| Anti-Gr-1 (FITC, clone RB6–8C5) | BioLegend | Cat#108405 |
| Ly6G (PE-Cy7, clone 1A8) | BioLegend | Cat#127617 |
| Ly6C (APC, clone HK1.4) | BioLegend | Cat#128016 |
| CD45 (APC-Cy7, clone 30-F11) | BioLegend | Cat#103116 |
| CD3 (PE-Dazzle, clone 17A2) | BioLegend | Cat#100245 |
| CD4 (PE-Cy7, clone GK1.5) | BioLegend | Cat#100422 |
| CD8 (AF700, clone 53–6.7) | BioLegend | Cat#100730 |
| FOXP3 (APC, clone 236A/E7) | eBioscience | Cat#17–4777 |
| InVivoMAb anti-mouse Ly6G/Ly6C (clone RB6–8C5) | BioXcell | Cat#BE0075 |
| InVivoMAb anti-mouse PD-1 (clone RMP1–14) | BioXcell | Cat#BE0146 |
| InVivoMAb rat IgG2a isotype control (clone 2A3) | BioXcell | Cat#BE0089 |
| Rabbit monoclonal anti-IRF2 | Abcam | Cat#ab124744 |
| Rabbit monoclonal anti-GFP | Cell Signaling Technology | Cat#2956 |
| Rabbit monoclonal anti-CD4 | Abcam | Cat#ab183685 |
| Rabbit Polyclonal anti-CD8 | Bioss | Cat#bs-0648R |
| Rat monoclonal anti-FOXP3 | eBioscience | Cat#14–4771-80 |
| Rat monoclonal anti-Gr-1 | BioLegend | Cat#108401 |
| Rabbit monoclonal p-ERK1/2 | Cell Signaling Technology | Cat#4370 |
| Rabbit Polyclonal anti-S100A8 | Proteintech | Cat#15792–1-AP |
| Rabbit Polyclonal anti-S100A9 | Proteintech | Cat#14226–1-AP |
| Rabbit polyclonal anti-CXCR2 | Abcam | Cat#Ab14935 |
| Mouse monoclonal [C-11] anti-Cytokeratin Pan | Abcam | Cat#Ab7753 |
| Alexa Fluor 488 labeled ant-rabbit | Life tech | Cat#A11008 |
| Alexa Fluor 594 labeled anti-rat | Life tech | Cat#A11007 |
| Alexa Fluor 488 labeled ant-mouse | Life tech | Cat#A11001 |
| Alexa Fluor 594 labeled anti-mouse | Life tech | Cat#A21203 |
| Mouse monoclonal anti-Vinculin (clone V284) | Millipore | Cat#05–386 |
| Rabbit Polyclonal anti-IRF2 (Polyclonal) | Bethyl Laboratories | Cat#A303–381A |
| Mouse anti-CXCL3/GRO gamma/CINC-2/DCIP-1 Antibody | R&D Systems | Cat#AF5568 |
| Rat anti-CXCR2 Antibody (Clone # 242216) | R&D Systems | Cat#MAB2164 |
| Rabbit anti-cleaved Caspase-3 | Cell Signaling Technology | Cat#9661S |
| Biological Samples | ||
| Human CRC FFPE tissues | The University of Texas MD Anderson Cancer Center | Protocol PA16–0408 |
| Chemicals, Peptides, and Recombinant Proteins | ||
| Doxycycline | Sigma | Cat#D9891 |
| 4-hydroxytamoxifen (4-OHT, OHTAM) | Sigma | Cat#H7904 |
| CXCR2 inhibitor SX-682 | Syntrix Biosystems, patent US 8969365 B2 (publication date 3 March 2015) | NA |
| Recombinant Mouse CXCL3/DCIP-1 Protein | R&D Systems | Cat#5568-CA-025 |
| CFSE | eBioscience™ | 65–0850-84 |
| Cell-ID Cisplatin | Fluidigm | Cat#201064 |
| Cell-ID Intercalator-Ir | Fluidigm | Cat#201192A |
| Polybrene | Santa Cruz Biotech | Cat#sc-134220 |
| Blasticidin | Thermo Fisher | Cat#A1113903 |
| Critical Commercial Assays | ||
| Mouse CXCL3 specific ELISA kit | Abcam | Cat#ab206310 |
| Mouse MDSC Isolation Kit | Miltenyi Biotec | Cat#130–094-538 |
| CD8a+ T Cell Isolation Kit, mouse | Miltenyi Biotec | Cat#130–104-075 |
| Tumor Dissociation Kit, mouse | Miltenyi Biotec | Cat#130–096-730 |
| NEBNext Ultra DNA Library kit | New England Biolabs | Cat# E7370 |
| Pierce™ BCA Protein Assay Kit | Thermo Fisher | Cat#23225 |
| RNeasy Kit | Qiagen | Cat#74104 |
| Superscript III cDNA Synthesis Kit | Life Technologies | Cat#18080051 |
| Deposited Data | ||
| Raw and analyzed ChIP-seq data | This paper | GSE110175 |
| Raw microarray data | This paper | GSE109579 |
| Experimental Models: Cell Lines | ||
| Mouse colorectal cancer cell line: MC38 | The University of Texas MD Anderson Cancer Center | NA |
| Mouse colorectal cancer cell line: iKAP-1 | This paper | NA |
| Mouse colorectal cancer cell line: iKAP-2 | This paper | NA |
| HEK 293T/17 | ATCC | CRL-11268™ |
| Experimental Models: Organisms/Strains | ||
| Mouse: The iKAP CRC mouse model (Villin-cre-Ert/Apclox/lox/Tp53lox/lox/tet-O-LSL-KrasG12D) | Boutin et al, 2017. | NA |
| Mouse: The iAP CRC mouse model (Villin-cre-Ert/Apclox/lox/Tp53lox/lox) | Boutin et al, 2017. | NA |
| Mouse: NOD scid | The Jackson Laboratory | Cat#001303 |
| Mouse: C57BL/6J | The Jackson Laboratory | Cat#000664 |
| Oligonucleotides | ||
| Mouse IRF2 shRNA: | Sigma | Cat#TRCN0000229 580 |
| Mouse CXCL3 siRNA | Sigma | Cat#SASI_Mm01_00047205 |
| ChIP-PCR Primer Cxcl3-F: CTCTAGGGTATGCCTCTCCATCT | This paper | N/A |
| ChIP-PCR Primer Cxcl3-R: TCTAACGTGTGTTCTCTGGGTT | This paper | N/A |
| Primers for Realtime Q-PCR primers, see Table S4 | This paper | N/A |
| Recombinant DNA | ||
| pLenti6.3/V5-DEST | Chin et al., 2012. | Addgene Plasmid Cat #40125 |
| pLenti6.3-GFP | Hu et al., 2016 | |
| Software and Algorithms | ||
| GraphPad Prism software 7.0 | GraphPad Software | https://www.graphpad.com |
| IBM SPSS Stastistics 20 | IBM | http://www-01.ibm.com/support/docview.wss?uid=swg21509012 |
| Flow Jo_v10 | FlowJo | http://www.flowjo.com/ |
| Cytobank based viSNE | (Chen and Kotecha, 2014) and (Amir el et al., 2013) | https://www.cytobank.org/ |
| Pannoramic Viewer | 3DHISTECH Ltd. | http://www.3dhistech.com/pannoramic_viewer |
| Ingenuity Pathway Analysis | Qiagen | https://www.qiagenbioinformatics.com/products/ingenuity-pathway-analysis/ |
| Integrative Genomics Viewer (IGV) | The Broad Institute of MIT and Harvard | http://software.broadinstitute.org/software/igv/ |
| Other | ||
| FcR Blocking Reagent | Miltenyl Biotec | Cat#130–059-901 |
| Lipofectamine 2000 Transfection Reagent | Thermo Fisher | Cat#11668019 |
| MaxPar Cell Staining Buffer | Fluidigm | Cat#201068 |
| Fixation/Permeabilization Concentrate | eBioscience | Cat#00–5123-43 |
| Fixation/Permeabilization Diluent | eBioscience | Cat#00–5223-56 |
| MaxPar Fix and Perm Buffer | Fluidigm | Cat#201067 |
| UltraPure™ DNase/RNase-Free Distilled Water | Thermo Fisher | Cat#10977023 |
| Antigen Unmarking Solution | Vector Laboratories | Cat#H-3300 |
| Mouse on rodent HRP-polymer | Biocare Medical | Cat#MM620L |
| Rabbit on rodent HRP-polymer | Biocare Medical | Cat#RMR622L |
| Rat on rodent HRP-polymer | Biocare Medical | Cat#RTH630L |
| Ultravision DAB Plus Substrate Detection System | Thermo Fischer Scientific | Cat#TA-125-QHDX |
| DAPI/anti-fade mounting medium | Vector Laboratories | Cat#H-1800–10 |
| Agencourt AMPure beads | Beckman-Coulter | Cat#A63880 |
| RIPA buffer | Boston BioProducts | BP-115–5X |
CONTACT FOR REAGENT AND RESOURCE SHARING
Further information and requests for resources and reagents should be directed to and will be fulfilled by the Lead Contact, Ronald A. DePinho (RDePinho@mdanderson.org).
EXPERIMENTAL MODEL AND SUBJECT DETAILS
Clinical Samples
Tissue microarrays of 42 KRAS wild-type and 40 KRAS mutant human CRC samples (47 males and 35 females; age range, 20–79 years) were obtained from the UT MD Anderson Cancer Center Department of Pathology archive and Institutional Tumor Bank with appropriate written informed consent and used under approval from the Institutional Review Board at MD Anderson. The 14 tumor samples were obtained from 14 patients with metastatic CRC who underwent immune checkpoint blockade therapy at MD Anderson between June 2014 to June 2016. Therapeutic effects were evaluated according to RECIST (Response Evaluation Criteria in Solid Tumors v1.1) (Eisenhauer et al., 2009). All samples utilized for analysis were reviewed by the Department of Pathology to ensure viable tumor was present.
Tumor models and treatments
All animal work performed in this study was approved by The University of Texas MD Anderson Cancer Center’s Institutional Animal Care and Use Committee. Animals were maintained in pathogen-free conditions and cared for in accordance with the International Association for Assessment and Accreditation of Laboratory Animal Care policies and certification. Manipulations were performed under isoflurane anesthesia. The iKAP CRC mouse model (Villin-cre-ERT;Apclox/lox;Trp53lox/lox;tet-O-LSL-KrasG12D) and iAP mouse model (Villin-cre-ERT;Apclox/lox;Trp53lox/lox) were established in our lab and described previously (Boutin et al., 2017). To induce colorectal tumors in iKAP and iAP mice, 4-OHT (1 mg/mL) was applied via enema and followed by Dox chow (200 mg/Kg) at 8 weeks of age. Established spontaneous colon and rectal tumors were observed under colonoscopy using the Storz veterinary endoscope as previously described (Boutin et al., 2017). For collecting of tumor samples from mice with extinction of KRAS*, iKAP mice with 80% tumor occlusion of the lumen were withdrawn from Dox for 7 days and sacrificed. For treatment in iKAP model, iKAP mice with 80% tumor occlusion of the lumen were randomly grouped into two cohorts. Dox chow was replaced with Dox water.
For therapy using iKAP model, female or male mice with 80% tumor occlusion of the lumen were randomized to different groups for further treatment (around 15 weeks of age). Anti-Gr-1 (BE0075, clone RB6–8C5, Bio-XCell), anti-PD-1 monoclonal antibody (BE0146, clone RMP1–14; Bio-XCell) and IgG isotype control (BE0089, clone 2A3; Bio-XCell) were given three times a week for four weeks through intraperitoneal injections at a dosage of 200 μg/injection. SX-682 was orally administrated as medicated chow at 357 mg of SX-682 in every kilogram of feed. Treatment began when tumors reach 80% occlusion as determined by endoscopy. Tumor progression was evaluated weekly by endoscopy. Mice were sacrificed when moribund and tumors will be collected. Survival were analyzed with KM curve.
Female scid mice and female C57BL/6J mice (6 weeks old) were purchased from the Jackson Laboratory. Mice were anesthetized for inoculation with tumor cells. Scid mice were injected in the right flank with iKAP cells overexpressing IRF2 or vector control constructs (8 × 10⁵ cells per mice).
Female C57BL/6J mice (6 weeks old) were injected in the right flank with MC38/pLenti6.3-GFP, MC38/KRAS-G12D (MC38K), and MC38K/IRF2 (MC38KI) cells (8 × 10⁵ cells/mouse) at day 0. Anti-PD-1 monoclonal antibody (BE0146, clone RMP1–14; Bio-XCell) and IgG isotype control (BE0089, clone 2A3; Bio-XCell) were given on days 6, 8, 10, 13, 15, and 17 after tumor inoculation through intraperitoneal injections at a dosage of 200 μg/injection. SX-682 was orally administrated as medicated chow at 357 mg of SX-682 in every kilogram of feed. Tumors were measured twice weekly. Mice were generally sacrificed when tumors became necrotic or their volume reached ~2500 mm3, recorded as death for survival curve.
Cell lines, culture conditions and viral infection
The murine colorectal cell line MC38 was provided by Dr. Patrick Hwu, MD Anderson Cancer Center, and was maintained at 37°C with 5% CO2 in DMEM supplemented with 10% heat-inactivated FBS, penicillin, streptomycin and L-glutamine. The cultured primary iKAP cell lines (iKAP-1 and iKAP-2) were generated as previously described (Boutin et al., 2017) and were cultured in DMEM with 10% FBS and 1 μg/ml Dox. 293T cells were cultured in DMEM with 10% FBS. All cell lines used in this study were tested to confirm that they were free of mycoplasma. For lentiviral transduction, 293T cells were transfected with pLenti6.3 plasmids encoding green fluorescent protein (GFP) or KRASG12D, IRF2 ORFs using Lipofectamine 2000 Transfection Reagent (Thermo Fisher, #11668019). Twenty-four to 48 hr later, supernatants were passed through 0.45 μm nylon filter, mixed with Polybrene (10 mg/ml, Santa Cruz Biotech) and transferred to plated cancer cells. Three days later, cells were selected by Blasticidin (3 μg/ml) for 1 week. Transduction efficiency was verified by western blotting analysis.
METHOD DETAILS
Colony formation assay
Cell proliferation was assayed by colony formation. Five × 103 cells were seeded in each well of 6-well plates and cultured for 5–7 days. Cells were then fixed and stained with 0.5% crystal violet in 25% methanol for 1 hr and counted. These experiments were performed in triplicate, and statistical significance was assessed using Student’s t-test.
Mass cytometry (CyTOF) and Flow Cytometry
CyTOF analysis was performed as described previously (Lu et al., 2017b; Wang et al., 2016). CyTOF staining panels are detailed in Table S1. Surface and intracellular staining cocktail master mixes were prepared prior to each experiment. In brief, CRC tumor single cells were isolated using the Mouse Tumor Dissociation Kit (Miltenyi Biotec, Cat# 130–096-730) following standard protocol. Digested tumors were then mashed through 40 μm filters into RPMI-1640 and were centrifuged at 300 g for 5 min at 4 °C. All single cells were depleted of erythrocytes by hypotonic lysis for 1 min at room temperature. 2 × 10⁶ or fewer cells per tumor were blocked with FcR Blocking Reagent (Miltenyl Biotec, Cat# 130–059-901) for 10 min and incubated with surface antibody mix for 30 min at room temperature. Cells were washed once with PBS and incubated with Cell-ID Cisplatin (Fluidigm, Cat# 201064) at 2.5 μM for 3 min for viability staining. Cells were washed with MaxPar Cell Staining Buffer (Fluidigm, Cat# 201068). For intracellular staining, cells were incubated with FOXP3 Fixation/Permeabilization working solution by diluting Fixation/Permeabilization Concentrate (eBioscience, Cat# 00–5123-43) with Fixation/Permeabilization Diluent (eBioscience, Cat #00–5223-56) for 45 min at room temperature (keep in dark). Cells were washed twice with working solution of Permeabilization Buffer (eBioscience, Cat #00–8333-56). Cells were incubated with intracellular antibody mix for 1h at room temperature and then washed twice with MaxPar Cell Staining Buffer (Fluidigm, Cat #201068). Cells were fixed with MaxPar Fix and Perm Buffer (Fluidigm, Cat #201067) containing Cell-ID Intercalator-Ir (Fluidigm, Cat #201192A) at 0.125 μM and 4 °C overnight to stain the nuclei. Cells were washed twice with MaxPar Cell Staining Buffer (Fluidigm, Cat# 201068) and resuspended in 50 μL clean water (Thermo Fisher, Cat#10977023). Samples were analyzed with a CyTOF instrument (Fluidigm) in the Flow Cytometry and Cellular Imaging Core Facility at MD Anderson Cancer Center. CyTOF data were visualized using a dimensionality reduction method viSNE (Amir el et al., 2013), which was implemented using the Cytobank (Chen and Kotecha, 2014). Percentages of each cell populations were analyzed with FlowJo (Tree Star) and GraphPad Prism 6 software.
For flow cytometry, the single cell samples were stained with Ghost Dye™ Violet 450 for 15 min in dark and then stained with indicated antibodies for 30 min on ice. Antibodies for MDSC: B220 (BV510, clone RA3–6B2, BioLegend, Cat# 103247), CD11b (BV605, clone M1/70, BioLegend, Cat# 101237), Gr-1 (FITC, clone RB6–8C5, BioLegend, Cat# 108405), Ly6G (PE-Cy7, clone 1A8, BioLegend, Cat# 127617), Ly6C (APC, clone HK1.4, BioLegend, Cat# 128016), CD45 (APC-Cy7, clone 30-F11, BioLegend, Cat# 103116). Antibodies for T cells: CD45 (APC-Cy7, clone 30-F11, BioLegend, Cat# 103116), CD3 (PE-Dazzle, clone 17A2, BioLegend, Cat# 100245), CD4 (PE-Cy7, clone GK15, BioLegend, Cat# 100422), CD8 (AF700, clone 53–6.7, BioLegend, Cat# 100730), FOXP3 (APC, clone 236A/E7, eBioscience, Cat# 17–4777). For FOXP3 staining, cells were fixed and permeabilized (eBioscience™ FOXP3/Transcription Factor Staining Buffer Set) and stained with FOXP3. Flow cytometry was performed using standard protocol on LSRFortessa analyzer (Becton Dickinson) and analyzed with FlowJo software (Tree Star).
MDSC isolation and in vitro migration assay
MDSCs were isolated from the spleens of iKAP mice using a Mouse MDSC Isolation Kit (Miltenyi Biotec, Cat# 130–094-538) and plated in RPMI1640 supplemented with 10% FBS and antibiotics. MDSCs (1 × 10⁵ cells/well) were seeded in the top chamber of the transwell (Corning). Conditioned media (CM) from cultured primary iKAP cell lines (Dox-on or Dox-off for 48 hr, iKAP cells overexpressing vector control or IRF2 constructs) were collected and added to the bottom layer of the transwell. After 4 hr incubation, cells that had completely migrated to the bottom chamber were counted. To validate in vitro the CXCL3-CXCR2 axis in the recruitment of MDSCs, MDSCs isolated from the spleen of iKAP mice were treated under the following conditions: (i) DMEM + mouse recombinant CXCL3 protein (R&D, 5568-CA) or PBS control; (ii) iKAP Dox-on CM, (iii) iKAP CM + CXCL3 neutralizing antibody (R&D, AF5568), (iv) iKAP CM + CXCR2 neutralizing antibody (R&D, MAB2164), (v) iKAP CM + CXCR2 inhibitor SX-682 (2 μM). These experiments were performed in triplicate, and statistical significance was assessed using Student’s t-test.
T cell suppression assay
A T cell suppression assay was performed as we previously described (Lu et al., 2017a; Wang et al., 2016) using MACS-sorted MDSCs and CFSE (Invitrogen)-labeled MACS-sorted (Miltenyi Biotec, Cat# 130–104-075) CD8+ T cells in anti-CD3-and anti-CD28-coated 96-well plates at an MDSC/ T cell ratio of 0:1, 1:1, with 5.0 × 10⁵ MDSCs. MDSCs were isolated from CRC tumors generated in iKAP mice. CD8+ T cells were isolated from spleen of wild-type C57BL/6 mice (The Jackson Laboratory, 000664). CFSE intensity was quantified 72 hr later with peaks identified by a BD LSRFortessa Cell Analyzer. CFSE peaks indicated the division times. Division times 0–2 and 3–4 were defined as low proliferation and high proliferation, respectively.
Immunohistochemistry (IHC)
Formalin-fixed paraffin embedded (FFPE) tissue microarrays of 42 KRAS wild-type and 40 KRAS mutant human CRC samples as well as CRC biopsy samples from 14 MSI-H patients prior to PD-1 therapy were cut in serial sections (4 μm). Tumor issues from mouse models were collected and fixed in 10% formalin overnight and embedded in paraffin. FFPE sections were prepared for staining using standard protocols for xylene and alcohol gradient for deparaffination. Antigen retrieval was performed in the pressure cooker (95 °C for 30 min) using Antigen Unmarking Solution (Vector Laboratories, Cat# H-3300) to remove aldehyde links formed during initial fixation of tissues. Slides were incubated with primary antibodies, including anti-IRF2 (Abcam, Cat# ab124744), anti-GFP (Cell Signaling Technology, Cat# 2956), anti-CD4 (Abcam, Cat# ab183685), anti-CD8 (Bioss, Cat# bs-0648R), anti-FOXP3 (eBioscience, Cat# 14–4771-80), anti-Gr-1 (BioLegend, Cat# 108401), anti-p-ERK1/2 (Cell Signaling Technology, Cat# 4370), anti-S100A8 (Proteintech, Cat# 15792–1-AP), anti-S100A9 (Proteintech, Cat# 14226–1-AP) and anti-cleaved Caspase-3 (Cell Signaling Technology, Cat# 9661S). Sections were incubated with mouse on rodent HRP-polymer (Biocare Medical, Cat# MM620L), rabbit on rodent HRP-polymer (Biocare Medical, Cat# RMR622L), or rat on rodent HRP-polymer (Biocare Medical, Cat# RTH630L) for 40 min and then developed with the Ultravision DAB Plus Substrate Detection System (Thermo Fischer Scientific, TA-125-QHDX) for 1–10 min at RT, followed by hematoxylin staining, dehydrated, and coverslipped with Permount. IHC slides were scanned with a Pannoramic Digital Slide Scanner (3DHISTECH) and images were cropped from virtual slides in Pannoramic Viewer. The human tissue sections were reviewed and scored in a blinded manner for staining intensity (0 – 2). High expression of IRF2 corresponded to a staining score of 2, low expression of IRF2 corresponded to staining score 1, whereas negative expression of IRF2 corresponded to staining score 0.
Immunofluorescence
Paraffin-embedded samples were sectioned at 4 μm thickness. Antigen retrieval was performed by a pressure cooker for (95°C for 30 min) in Antigen Unmarking Solution (Vector Laboratories, Cat# H-3300). Sections were then blocked in PBS containing 2% bovine serum albumin for 1 hr at room temperature. For dual immunofluorescence staining, the slides were incubated in the mixture of two primary antibodies overnight at 4 oC. The following primary antibodies were used: rabbit anti-CXCR2 (Abcam, Cat# ab14935), rat anti-Gr-1 (BioLegend, Cat# 108401), mouse anti-Cytokeratin Pan (Abcam, Cat# ab7753), rabbit anti-CD4 (Abcam, Cat# ab183685), rabbit anti-CD8 (Bioss, Cat# bs-0648R), and rat anti-FOXP3 (eBioscience, Cat# 14–4771-80). The slides were washed with cold PBS and incubated with the mixture of two secondary antibodies which are raised in different species for 1 hr at room temperature in dark. The following secondary antibodies were used: Alexa Fluor 488 labeled anti-rabbit (Life Technologies, Cat# A11008), Alexa Fluor 594 labeled anti-rat (Life Technologies, Cat# A11007), Alexa Fluor 488 labeled anti-mouse (Life Technologies, Cat# A11001), and Alexa Fluor 594 labeled anti-mouse (Life Technologies, Cat# A21203). Slides were counter-stained with DAPI/anti-fade mounting medium (Vector Laboratories) and examined by fluorescence microscopy (Leica DFC345 FX).
Western Blot
For western blot analysis, cells or fresh tissues were lysed on ice using RIPA buffer (Boston BioProducts, BP-115–5X) supplemented with protease and phosphatase inhibitors (Roche). Protein extracts were clarified and concentrations were measured with Pierce Protein Assay kit (Thermo Fisher Scientific). Western blot procedure was performed as previously described (Lu et al., 2017b; Zhao et al., 2017). Primary antibodies used included anti-IRF2 (Abcam, Cat# ab124744), anti-phospho-ERK1/2 (Cell Signaling Technology, Cat# 4370), and anti-Vinculin (Millipore, Cat# 05–386).
Knockdown of mouse IRF2 and CXCL3
We screened four hairpins targeting mouse IRF2 and identified one that reduced mRNA and protein levels by > 80%. The hairpins were in the pLKO.1 vector. The following mouse IRF2 shRNA sequence was used: 5’-CCGGCATCAACCAGGAATAGATAAACTCGAGTTTATCTATTCCTGGTTGATGTTTTTG-3’ (Sigma-Aldrich TRCN0000229580). For small interfering RNA (siRNA)-mediated knockdown of mouse CXCL3, cells were transfected with 50 nM of either the targeting or control siRNA (Sigma-Aldrich, SASI_Mm01_00047205) using Lipofectamine 2000 (Invitrogen) for 72 hr.
Chromatin Immunoprecipitation sequencing (ChIP–seq) and ChIP-PCR
ChIP was performed as described (Zhao et al., 2017). Briefly, 1 × 10⁷ cells were cross-linked using 1% paraformaldehyde for 10 min and reactions were quenched by addition of 0.125 M glycine for 5 min at room temperature. Cells were lysed with ChIP lysis buffer (10 mM Tris-HCl [pH 8.0], 1 mM EDTA [pH 8.0], 140 mM NaCl, 1% Triton X-100, 0.2% SDS, 0.1% deoxycholic acid) for 30 min on ice. Chromatin fragmentation was performed using a Diagenode BioruptorPico sonicator (30 s on, 30 s off for 45 cycles) to achieve a DNA shear length of 200 – 500 bp. Solubilized chromatin was then incubated overnight with the appropriate antibody–Dynabead (Life Technologies) mixture (5 μg anti-IRF2 antibody; Bethyl, Cat# A303–381A). Immune complexes were then washed three times with RIPA buffer, once with RIPA-500 (RIPA with 500 mM NaCl), and once with LiCl wash buffer (10 mM Tris-HCl [pH 8.0], 1 mM EDTA [pH 8.0], 250 mM LiCl, 0.5% NP-40, 0.5% deoxycholic acid). Elution and reverse-crosslinking were performed in direct elution buffer (10 mM Tris-Cl [pH 8.0], 5 mM EDTA, 300 mM NaCl, 0.5% SDS) with proteinase K (20 mg/ml) at 65°C overnight. Eluted DNA was purified using Agencourt AMPure beads (Beckman-Coulter, Cat# A63880). Libraries were prepared using NEBNext Ultra DNA Library kit (E7370). Sequencing was performed using an Illumina HiSeq 2500 instrument to generate dataset GSE110175. Reads were aligned to a reference genome (UCSC mm9; Assembly http://hgdownload.cse.ucsc.edu/downloads.html#mouse) using the Burrows–Wheeler Aligner. Reads mapping to more than two genomic loci were ignored. The data were visualized using the Integrative Genomics Viewer (IGV).
For ChIP-qPCR assays, the fold enrichment of ChIPed DNA relative to input DNA at a given genomic site was determined by comparative CT (∆∆ CT) method using Power SYBR Green PCR Master Mix (Applied Biosystems) according to the manufacturer’s protocol. An 18S rRNA genomic region was used for normalization. The following primers were used for qPCR analysis: Cxcl3-F: 5′- CTCTAGGGTATGCCTCTCCATCT-3′ and Cxcl3-R: 5′-TCTAACGTGTGTTCTCTGGGTT −3′.
Real-time quantitative PCR (real-time qPCR) and microarray
RNA was isolated by RNeasy Kit (Qiagen, 74104) and reversed transcribed using a Superscript III cDNA Synthesis Kit (Life Technologies, 18080051). Real-time qPCR was performed using a SYBR-GreenER Kit (Life Technologies, 10656413) by 7500 Fast Real-Time PCR System (Applied Biosystems). Each sample was examined at least in triplicate. PCR product specificity was confirmed by a melting-curve analysis. The relative mRNA expression was calculated by using 2-∆∆Ct method. Indicated primers are listed in Table S4. Microarray analysis was performed on RNA prepared from control and IRF2-overexpressed iKAP cells (biological triplicates for control and IRF2-overexpressed iKAP cells) at The MD Anderson Microarray Core Facility using the GeneChip Human Genome U133 Plus 2.0 Array (Affymetrix) to generate dataset GSE109579. Genes that were differentially expressed between control IRF2-overexpressed iKAP cells were subjected to Ingenuity Pathway Analysis (IPA) and Gene Set Enrichment Analysis (GSEA). The raw data were processed and analyzed by GenePattern using Expression File Creator Module (version 12.3) and GSEA module (v17). The default GSEA basic parameters were used and a Student’s t-test was used as the metric for ranking genes.
ELISA
Cells (2 × 10⁶/100 mm dish) were cultured for 24 hr. Media were removed and replaced with 10 ml serum-free DMEM. Supernatants were collected 24 hr later with any floating cells removed by 0.45 μm filtration. The amount of CXCL3 protein in the supernatant was determined using a mouse CXCL3 specific ELISA kit (Abcam, Cat# ab206310). All experiments were performed according to the manufacturer’s instructions.
Computational Analysis
RNAseq for mouse tumors from the iAP and iKAP models, as well as cultured primary iKAP cells (Dox-on vs Dox-off), were performed previously (SRP097890). The analysis of mutual exclusiveness and gene expression listed in Table S3 were performed as previously described (Zhao et al., 2017). The genetic alteration and gene expression of 220 TCGA CRC cancer samples with copy number alterations and sequencing data were analyzed in cBioPortal (Cerami et al., 2012; Gao et al., 2013) (http://www.cbioportal.org/). The odds ratio score was calculated to indicate mutual exclusiveness between gene A and gene B deletion. The mean values of gene B expression in all 220 samples and that in gene A deleted samples were calculated, and p values were determined by two-tailed Student’s t-test. For TCGA GSEA analysis, the TCGA colorectal adenocarcinoma dataset including mutation, copy number and mRNA are downloaded from Broad GDAC website (http://firebrowse.org/?cohort=COADREAD&download_dialog=true). The mRNA data from the Illumina Genome Analyzer platform in the website was used here (COAD.rnaseqv2 illuminaga_rnaseqv2 unc_edu Level_3 RSEM_genes data.data.txt). There was a total of 147 samples with their mutations, CNAs and mRNA available. Among them, 55 samples had KRAS genomic alterations (mutations and copy number amplifications) and 7 samples contained IRF2 genomic alterations (deep deletions and mutations). The other 85 samples were taken as the KRAS wild-type group. The differential analysis was performed on the KRAS mutated and wild-type groups with edgeR software. Differential expressed genes were subject to pre-rank-based Gene Set Enrichment Analysis (GSEA). The p value and fold-change derived from edgeR were combined to score the ranking of genes [gene ranking score: −1*log (p value) if fold change >1; log (p value) otherwise]. The default GSEA pre-rank-based basic parameters were applied here. Ten samples and nine samples belong to stage III/IV in the 55 KRAS mutant group and 85 wild-type groups, respectively. The same procedures were applied on the two cohorts for the differential expression analysis and GSEA.
For the analysis of correlation between activities of KRAS signaling and expression of MDSC signature, the gene expression data of 433 TCGA Colon (COAD) and Rectum (READ) cancer samples were downloaded from GDC database using R package “TCGAbiolinks (Colaprico et al., 2016)”, which is the normalized RSEM expression. The 433 TCGA colorectal samples were first clustered using GSEA Gene Set “HALLMARK_KRAS_SIGNALING_UP” into KRAS Signaling-High and KRAS Signaling-Low (distance between pairs of samples was measured by Manhattan distance and clustering was then performed using Ward’s method hierarchical clustering). Then supervised clustering was performed using MDSC signatures adapted as previously described (Wang et al., 2016).
The correlations between CXCL3 and IRF2 in human CRC tissues were analyzed using Oncomine. TCGA colorectal cancer dataset, Gaedcke Colorectal dataset and Khambata-Ford Colon dataset were used.
QUANTIFICATION AND STATISTICAL ANALYSIS
For quantification of tumor cell or immune cell density, images of tumor sections with IF or IHC staining were captured by using the digital slide scanner, Pannoramic Viewer (3DHISTECH Ltd). The positive cells were counted. Three fields in each tumor were randomly selected for tumor cell or immune cell density analysis and statistical analysis was performed by using t-test of Graphpad Prism 7.
The two-tailed Pearson correlation between KRAS mutation status and IRF2 expression was calculated using SPSS Statistics software (IBM), and p values were determined by two-tailed Fisher’s exact test. The Student’s t-test assuming two-tailed distributions was used to calculate statistical significance between groups (GraphPad Prism 7). Statistical information including n, mean and statistical significance values are indicated in the text or the figure legends. Error bars indicate standard deviation (s.d.). Animal survival benefit was determined by Kaplan–Meier analysis. Statistical testing was performed with the log-rank test. For IPA, we included all 50 ‘hallmark’ gene sets of the Molecular Signatures Database (MSigDB) as described (Liberzon et al., 2015) as customized pathways. Then lists of downregulated genes in iKAP tumors compared with iAP tumors generated from RNAseq (dataset: SRP097890) or the genes upregulated in the primary cultured iKAP cell lines (Dox-off 24 hr vs Dox-on) generated from RNAseq (dataset: SRP097890) was uploaded for IPA core analysis. The filter threshold of RNAseq data was a fold change > 1.5. p values < 0.05 were considered statistically significant, with * p < 0.05, ** p < 0.001, *** p < 0.0001, unless otherwise indicated in the figure.
DATA AND SOFTWARE AVAILABILITY
The ChIP-seq data and microarray data have been deposited in the NCBI GEO (http://www.ncbi.nlm.nih.gov/geo) under ID code GSE110175 and GSE109579.
Supplementary Material
Highlights.
Oncogenic KRAS promotes an immune suppressive profile in CRC
IRF2 is a key downstream target of oncogenic KRAS mediating immune suppression
IRF2 suppresses MDSC migration and infiltration by targeting the CXCL3-CXCR2 axis
Enforced IRF2 expression or CXCR2 inhibition overcomes anti-PD1 resistance in CRC
Liao et al. show that oncogenic KRAS represses IRF2 expression leading to high expression of CXCL3, which binds CXCR2 on MDSCs to promote their migration into the tumor microenvironment. Enforced IRF2 expression or CXCR2 blockade overcomes resistance of tumors expressing oncogenic KRAS to anti-PD-1 therapy.
Significance.
While ICB therapy shows activity in advanced-stage MSI-H CRC, the majority of CRC patients do not respond, motivating the study of mechanisms and combination regimens with targeted therapies and ICB. In this study, we establish an essential role for KRAS* in modulating immune microenvironment and primary ICB resistance in advanced CRC. In KRAS* CRC, restoration of IRF2 expression or therapeutic inhibition of MDSC recruitment by targeting CXCL3-CXCR2 signaling increased sensitivity to ICB therapy for CRC. This mechanism and its circuitry illuminate an effective therapeutic strategy to improve clinical responses to ICB therapy, a major unmet need in advanced CRC disease.
ACKNOWLEDGMENTS
We thank Zhaohui Xu, Ivonne Ibarra, and Kun Zhao for assistance in maintenance of mouse colonies; and the MD Anderson Sequencing and Microarray Facility (SMF) and the Flow Cytometry and Cellular Imaging Core Facility (Jared Burks, Duncan Mak, and Karen Dwyer). We thank Dr. Xin Lu, Pingna Deng and all members of the DePinho laboratory for helpful discussions and support. This work was supported in part by the NIH R01 CA084628 (to R.A.D.), NIH PO1 CA117969 (to R.A.D.), MD Anderson Colorectal Cancer Moon Shot funds (to S.K. and Y.A.W.), the National Basic Research Program of China (973 program, 2015CB554002, to W.L), and the National Natural Science Foundation of China (81672886, 81773101 and 81872401, to W.L). D.C. is supported by the Triumph postdoctoral program at MD Anderson supported by CPRIT (RP170067).
Footnotes
Publisher's Disclaimer: This is a PDF file of an unedited manuscript that has been accepted for publication. As a service to our customers we are providing this early version of the manuscript. The manuscript will undergo copyediting, typesetting, and review of the resulting proof before it is published in its final citable form. Please note that during the production process errors may be discovered which could affect the content, and all legal disclaimers that apply to the journal pertain.
DECLARATION OF INTERESTS
M.J.O. receives research funding from Merck, Astra-Zeneca and Bristol-Myers Squibb, and is a consultant for Astra-Zeneca, Bristol-Myers Squibb, and Roche. J.A.Z is the President and CEO, and D.Y.M. is the Director of Chemistry and Preclinical Development at Syntrix Pharmaceuticals. RAD is a co-founder, advisor and director of Tvardi Therapeutics.
REFERENCES
- Amir el AD, Davis KL, Tadmor MD, Simonds EF, Levine JH, Bendall SC, Shenfeld DK, Krishnaswamy S, Nolan GP, and Pe’er D (2013). viSNE enables visualization of high dimensional single-cell data and reveals phenotypic heterogeneity of leukemia. Nat Biotechnol 31, 545–552. [DOI] [PMC free article] [PubMed] [Google Scholar]
- Artale S, Sartore-Bianchi A, Veronese SM, Gambi V, Sarnataro CS, Gambacorta M, Lauricella C, and Siena S (2008). Mutations of KRAS and BRAF in primary and matched metastatic sites of colorectal cancer. J Clin Oncol 26, 4217–4219. [DOI] [PubMed] [Google Scholar]
- Benvenuti S, Sartore-Bianchi A, Di Nicolantonio F, Zanon C, Moroni M, Veronese S, Siena S, and Bardelli A (2007). Oncogenic activation of the RAS/RAF signaling pathway impairs the response of metastatic colorectal cancers to anti-epidermal growth factor receptor antibody therapies. Cancer Res 67, 2643–2648. [DOI] [PubMed] [Google Scholar]
- Boutin AT, Liao WT, Wang M, Hwang SS, Karpinets TV, Cheung H, Chu GC, Jiang S, Hu J, Chang K, et al. (2017). Oncogenic Kras drives invasion and maintains metastases in colorectal cancer. Genes Dev 31, 370–382. [DOI] [PMC free article] [PubMed] [Google Scholar]
- Cameron MJ, and Kelvin DJ (2000). Cytokines, chemokines and their receptors (Austin (TX): Landes Bioscience; ). [Google Scholar]
- Cerami E, Gao J, Dogrusoz U, Gross BE, Sumer SO, Aksoy BA, Jacobsen A, Byrne CJ, Heuer ML, Larsson E, et al. (2012). The cBio cancer genomics portal: an open platform for exploring multidimensional cancer genomics data. Cancer Discov 2, 401–404. [DOI] [PMC free article] [PubMed] [Google Scholar]
- Chen DS, and Mellman I (2017). Elements of cancer immunity and the cancer-immune set point. Nature 541, 321–330. [DOI] [PubMed] [Google Scholar]
- Chen TJ, and Kotecha N (2014). Cytobank: providing an analytics platform for community cytometry data analysis and collaboration. Curr Top Microbiol Immunol 377, 127–157. [DOI] [PubMed] [Google Scholar]
- Coelho MA, de Carne Trecesson S, Rana S, Zecchin D, Moore C, Molina-Arcas M, East P, Spencer-Dene B, Nye E, Barnouin K, et al. (2017). Oncogenic RAS Signaling Promotes Tumor Immunoresistance by Stabilizing PD-L1 mRNA. Immunity 47, 1083–1099 e1086. [DOI] [PMC free article] [PubMed] [Google Scholar]
- Colaprico A, Silva TC, Olsen C, Garofano L, Cava C, Garolini D, Sabedot TS, Malta TM, Pagnotta SM, Castiglioni I, et al. (2016). TCGAbiolinks: an R/Bioconductor package for integrative analysis of TCGA data. Nucleic Acids Res 44, e71. [DOI] [PMC free article] [PubMed] [Google Scholar]
- Davis RJ, Moore EC, Clavijo PE, Friedman J, Cash H, Chen Z, Silvin C, Van Waes C, and Allen C (2017). Anti-PD-L1 Efficacy Can Be Enhanced by Inhibition of Myeloid-Derived Suppressor Cells with a Selective Inhibitor of PI3Kdelta/gamma. Cancer Res 77, 2607–2619. [DOI] [PMC free article] [PubMed] [Google Scholar]
- Dienstmann R, Vermeulen L, Guinney J, Kopetz S, Tejpar S, and Tabernero J (2017). Consensus molecular subtypes and the evolution of precision medicine in colorectal cancer. Nat Rev Cancer 17, 79–92. [DOI] [PubMed] [Google Scholar]
- Dunn GP, Bruce AT, Sheehan KC, Shankaran V, Uppaluri R, Bui JD, Diamond MS, Koebel CM, Arthur C, White JM, et al. (2005). A critical function for type I interferons in cancer immunoediting. Nat Immunol 6, 722–729. [DOI] [PubMed] [Google Scholar]
- Efremova M, Rieder D, Klepsch V, Charoentong P, Finotello F, Hackl H, Hermann-Kleiter N, Lower M, Baier G, Krogsdam A, et al. (2018). Targeting immune checkpoints potentiates immunoediting and changes the dynamics of tumor evolution. Nat Commun 9, 32. [DOI] [PMC free article] [PubMed] [Google Scholar]
- Eisenhauer EA, Therasse P, Bogaerts J, Schwartz LH, Sargent D, Ford R, Dancey J, Arbuck S, Gwyther S, Mooney M, et al. (2009). New response evaluation criteria in solid tumours: revised RECIST guideline (version 1.1). Eur J Cancer 45, 228–247. [DOI] [PubMed] [Google Scholar]
- Gao J, Aksoy BA, Dogrusoz U, Dresdner G, Gross B, Sumer SO, Sun Y, Jacobsen A, Sinha R, Larsson E, et al. (2013). Integrative analysis of complex cancer genomics and clinical profiles using the cBioPortal. Sci Signal 6, pl1. [DOI] [PMC free article] [PubMed] [Google Scholar]
- Gao J, Shi LZ, Zhao H, Chen J, Xiong L, He Q, Chen T, Roszik J, Bernatchez C, Woodman SE, et al. (2016). Loss of IFN-gamma Pathway Genes in Tumor Cells as a Mechanism of Resistance to Anti-CTLA-4 Therapy. Cell 167, 397–404 e399. [DOI] [PMC free article] [PubMed] [Google Scholar]
- Griffith JW, Sokol CL, and Luster AD (2014). Chemokines and chemokine receptors: positioning cells for host defense and immunity. Annu Rev Immunol 32, 659–702. [DOI] [PubMed] [Google Scholar]
- Guinney J, Dienstmann R, Wang X, de Reynies A, Schlicker A, Soneson C, Marisa L, Roepman P, Nyamundanda G, Angelino P, et al. (2015). The consensus molecular subtypes of colorectal cancer. Nature medicine 21, 1350–1356. [DOI] [PMC free article] [PubMed] [Google Scholar]
- Harada H, Fujita T, Miyamoto M, Kimura Y, Maruyama M, Furia A, Miyata T, and Taniguchi T (1989). Structurally similar but functionally distinct factors, IRF-1 and IRF-2, bind to the same regulatory elements of IFN and IFN-inducible genes. Cell 58, 729–739. [DOI] [PubMed] [Google Scholar]
- Jemal A, Siegel R, Ward E, Hao Y, Xu J, Murray T, and Thun MJ (2008). Cancer statistics, 2008. CA Cancer J Clin 58, 71–96. [DOI] [PubMed] [Google Scholar]
- Juneja VR, McGuire KA, Manguso RT, LaFleur MW, Collins N, Haining WN, Freeman GJ, and Sharpe AH (2017). PD-L1 on tumor cells is sufficient for immune evasion in immunogenic tumors and inhibits CD8 T cell cytotoxicity. J Exp Med 214, 895–904. [DOI] [PMC free article] [PubMed] [Google Scholar]
- Katlinski KV, Gui J, Katlinskaya YV, Ortiz A, Chakraborty R, Bhattacharya S, Carbone CJ, Beiting DP, Girondo MA, Peck AR, et al. (2017). Inactivation of Interferon Receptor Promotes the Establishment of Immune Privileged Tumor Microenvironment. Cancer cell 31, 194–207. [DOI] [PMC free article] [PubMed] [Google Scholar]
- Katoh H, Wang D, Daikoku T, Sun H, Dey SK, and Dubois RN (2013). CXCR2-expressing myeloid-derived suppressor cells are essential to promote colitis-associated tumorigenesis. Cancer Cell 24, 631–644. [DOI] [PMC free article] [PubMed] [Google Scholar]
- Keeley EC, Mehrad B, and Strieter RM (2010). CXC chemokines in cancer angiogenesis and metastases. Adv Cancer Res 106, 91–111. [DOI] [PMC free article] [PubMed] [Google Scholar]
- Klampfer L, Huang J, Corner G, Mariadason J, Arango D, Sasazuki T, Shirasawa S, and Augenlicht L (2003). Oncogenic Ki-ras inhibits the expression of interferon-responsive genes through inhibition of STAT1 and STAT2 expression. The Journal of biological chemistry 278, 46278–46287. [DOI] [PubMed] [Google Scholar]
- Kumar V, Patel S, Tcyganov E, and Gabrilovich DI (2016). The Nature of Myeloid-Derived Suppressor Cells in the Tumor Microenvironment. Trends Immunol 37, 208–220. [DOI] [PMC free article] [PubMed] [Google Scholar]
- Lal N, Beggs AD, Willcox BE, and Middleton GW (2015). An immunogenomic stratification of colorectal cancer: Implications for development of targeted immunotherapy. Oncoimmunology 4, e976052. [DOI] [PMC free article] [PubMed] [Google Scholar]
- Lal N, White BS, Goussous G, Pickles O, Mason MJ, Beggs AD, Taniere P, Willcox BE, Guinney J, and Middleton GW (2018). KRAS Mutation and Consensus Molecular Subtypes 2 and 3 Are Independently Associated with Reduced Immune Infiltration and Reactivity in Colorectal Cancer. Clin Cancer Res 24, 224–233. [DOI] [PMC free article] [PubMed] [Google Scholar]
- Le DT, Uram JN, Wang H, Bartlett BR, Kemberling H, Eyring AD, Skora AD, Luber BS, Azad NS, Laheru D, et al. (2015). PD-1 Blockade in Tumors with Mismatch-Repair Deficiency. N Engl J Med 372, 2509–2520. [DOI] [PMC free article] [PubMed] [Google Scholar]
- Liberzon A, Birger C, Thorvaldsdottir H, Ghandi M, Mesirov JP, and Tamayo P (2015). The Molecular Signatures Database (MSigDB) hallmark gene set collection. Cell Syst 1, 417–425. [DOI] [PMC free article] [PubMed] [Google Scholar]
- Lu T, Ramakrishnan R, Altiok S, Youn JI, Cheng P, Celis E, Pisarev V, Sherman S, Sporn MB, and Gabrilovich D (2011). Tumor-infiltrating myeloid cells induce tumor cell resistance to cytotoxic T cells in mice. J Clin Invest 121, 4015–4029. [DOI] [PMC free article] [PubMed] [Google Scholar]
- Lu X, Horner JW, Paul E, Shang X, Troncoso P, Deng P, Jiang S, Chang Q, Spring DJ, Sharma P, et al. (2017a). Effective combinatorial immunotherapy for castration-resistant prostate cancer. Nature [DOI] [PMC free article] [PubMed]
- Lu X, Horner JW, Paul E, Shang X, Troncoso P, Deng P, Jiang S, Chang Q, Spring DJ, Sharma P, et al. (2017b). Effective combinatorial immunotherapy for castration-resistant prostate cancer. Nature 543, 728–732. [DOI] [PMC free article] [PubMed] [Google Scholar]
- Marincola FM, Jaffee EM, Hicklin DJ, and Ferrone S (2000). Escape of human solid tumors from T-cell recognition: molecular mechanisms and functional significance. Adv Immunol 74, 181–273. [DOI] [PubMed] [Google Scholar]
- Marvel D, and Gabrilovich DI (2015). Myeloid-derived suppressor cells in the tumor microenvironment: expect the unexpected. J Clin Invest 125, 3356–3364. [DOI] [PMC free article] [PubMed] [Google Scholar]
- Masugi Y, Nishihara R, Yang J, Mima K, da Silva A, Shi Y, Inamura K, Cao Y, Song M, Nowak JA, et al. (2017). Tumour CD274 (PD-L1) expression and T cells in colorectal cancer. Gut 66, 1463–1473. [DOI] [PMC free article] [PubMed] [Google Scholar]
- Ngiow SF, Young A, Jacquelot N, Yamazaki T, Enot D, Zitvogel L, and Smyth MJ (2015). A Threshold Level of Intratumor CD8+ T-cell PD1 Expression Dictates Therapeutic Response to Anti-PD1. Cancer Res 75, 3800–3811. [DOI] [PubMed] [Google Scholar]
- Overman MJ, Lonardi S, Wong KYM, Lenz HJ, Gelsomino F, Aglietta M, Morse MA, Van Cutsem E, McDermott R, Hill A, et al. (2018). Durable Clinical Benefit With Nivolumab Plus Ipilimumab in DNA Mismatch Repair-Deficient/Microsatellite Instability-High Metastatic Colorectal Cancer. J Clin Oncol 36, 773–779. [DOI] [PubMed] [Google Scholar]
- Overman MJ, McDermott R, Leach JL, Lonardi S, Lenz HJ, Morse MA, Desai J, Hill A, Axelson M, Moss RA, et al. (2017). Nivolumab in patients with metastatic DNA mismatch repair-deficient or microsatellite instability-high colorectal cancer (CheckMate 142): an open-label, multicentre, phase 2 study. Lancet Oncol 18, 1182–1191. [DOI] [PMC free article] [PubMed] [Google Scholar]
- Parker BS, Rautela J, and Hertzog PJ (2016). Antitumour actions of interferons: implications for cancer therapy. Nature reviews Cancer 16, 131–144. [DOI] [PubMed] [Google Scholar]
- Pereira AA, Rego JF, Morris V, Overman MJ, Eng C, Garrett CR, Boutin AT, Ferrarotto R, Lee M, Jiang ZQ, et al. (2015). Association between KRAS mutation and lung metastasis in advanced colorectal cancer. Br J Cancer 112, 424–428. [DOI] [PMC free article] [PubMed] [Google Scholar]
- Pylayeva-Gupta Y, Lee KE, Hajdu CH, Miller G, and Bar-Sagi D (2012). Oncogenic Kras-induced GM-CSF production promotes the development of pancreatic neoplasia. Cancer Cell 21, 836–847. [DOI] [PMC free article] [PubMed] [Google Scholar]
- Rainard P, Riollet C, Berthon P, Cunha P, Fromageau A, Rossignol C, and Gilbert FB (2008). The chemokine CXCL3 is responsible for the constitutive chemotactic activity of bovine milk for neutrophils. Mol Immunol 45, 4020–4027. [DOI] [PubMed] [Google Scholar]
- Rinehart J, Adjei AA, Lorusso PM, Waterhouse D, Hecht JR, Natale RB, Hamid O, Varterasian M, Asbury P, Kaldjian EP, et al. (2004). Multicenter phase II study of the oral MEK inhibitor, CI-1040, in patients with advanced non-small-cell lung, breast, colon, and pancreatic cancer. J Clin Oncol 22, 4456–4462. [DOI] [PubMed] [Google Scholar]
- Robert C, Schachter J, Long GV, Arance A, Grob JJ, Mortier L, Daud A, Carlino MS, McNeil C, Lotem M, et al. (2015). Pembrolizumab versus Ipilimumab in Advanced Melanoma. N Engl J Med 372, 2521–2532. [DOI] [PubMed] [Google Scholar]
- Sharma P, Hu-Lieskovan S, Wargo JA, and Ribas A (2017). Primary, Adaptive, and Acquired Resistance to Cancer Immunotherapy. Cell 168, 707–723. [DOI] [PMC free article] [PubMed] [Google Scholar]
- Siegel RL, Miller KD, Fedewa SA, Ahnen DJ, Meester RGS, Barzi A, and Jemal A (2017). Colorectal cancer statistics, 2017. CA Cancer J Clin 67, 177–193. [DOI] [PubMed] [Google Scholar]
- Steele CW, Karim SA, Leach JDG, Bailey P, Upstill-Goddard R, Rishi L, Foth M, Bryson S, McDaid K, Wilson Z, et al. (2016). CXCR2 Inhibition Profoundly Suppresses Metastases and Augments Immunotherapy in Pancreatic Ductal Adenocarcinoma. Cancer Cell 29, 832–845. [DOI] [PMC free article] [PubMed] [Google Scholar]
- Talmadge JE, and Gabrilovich DI (2013). History of myeloid-derived suppressor cells. Nat Rev Cancer 13, 739–752. [DOI] [PMC free article] [PubMed] [Google Scholar]
- Tanaka N, Kawakami T, and Taniguchi T (1993). Recognition DNA sequences of interferon regulatory factor 1 (IRF-1) and IRF-2, regulators of cell growth and the interferon system. Mol Cell Biol 13, 4531–4538. [DOI] [PMC free article] [PubMed] [Google Scholar]
- Topalian SL, Hodi FS, Brahmer JR, Gettinger SN, Smith DC, McDermott DF, Powderly JD, Carvajal RD, Sosman JA, Atkins MB, et al. (2012). Safety, activity, and immune correlates of anti-PD-1 antibody in cancer. N Engl J Med 366, 2443–2454. [DOI] [PMC free article] [PubMed] [Google Scholar]
- Vakiani E, Janakiraman M, Shen R, Sinha R, Zeng Z, Shia J, Cercek A, Kemeny N, D’Angelica M, Viale A, et al. (2012). Comparative genomic analysis of primary versus metastatic colorectal carcinomas. J Clin Oncol 30, 2956–2962. [DOI] [PMC free article] [PubMed] [Google Scholar]
- Wang G, Lu X, Dey P, Deng P, Wu CC, Jiang S, Fang Z, Zhao K, Konaparthi R, Hua S, et al. (2016). Targeting YAP-Dependent MDSC Infiltration Impairs Tumor Progression. Cancer discovery 6, 80–95. [DOI] [PMC free article] [PubMed] [Google Scholar]
- Weber R, Fleming V, Hu X, Nagibin V, Groth C, Altevogt P, Utikal J, and Umansky V (2018). Myeloid-Derived Suppressor Cells Hinder the Anti-Cancer Activity of Immune Checkpoint Inhibitors. Front Immunol 9, 1310. [DOI] [PMC free article] [PubMed] [Google Scholar]
- West NR, McCuaig S, Franchini F, and Powrie F (2015). Emerging cytokine networks in colorectal cancer. Nat Rev Immunol 15, 615–629. [DOI] [PubMed] [Google Scholar]
- Wood LD, Parsons DW, Jones S, Lin J, Sjoblom T, Leary RJ, Shen D, Boca SM, Barber T, Ptak J, et al. (2007). The genomic landscapes of human breast and colorectal cancers. Science 318, 1108–1113. [DOI] [PubMed] [Google Scholar]
- Yang L, DeBusk LM, Fukuda K, Fingleton B, Green-Jarvis B, Shyr Y, Matrisian LM, Carbone DP, and Lin PC (2004). Expansion of myeloid immune suppressor Gr+CD11b+ cells in tumor-bearing host directly promotes tumor angiogenesis. Cancer Cell 6, 409–421. [DOI] [PubMed] [Google Scholar]
- Yang L, Huang J, Ren X, Gorska AE, Chytil A, Aakre M, Carbone DP, Matrisian LM, Richmond A, Lin PC, et al. (2008). Abrogation of TGF beta signaling in mammary carcinomas recruits Gr-1+CD11b+ myeloid cells that promote metastasis. Cancer Cell 13, 23–35. [DOI] [PMC free article] [PubMed] [Google Scholar]
- Zaretsky JM, Garcia-Diaz A, Shin DS, Escuin-Ordinas H, Hugo W, Hu-Lieskovan S, Torrejon DY, Abril-Rodriguez G, Sandoval S, Barthly L, et al. (2016). Mutations Associated with Acquired Resistance to PD-1 Blockade in Melanoma. The New England journal of medicine 375, 819–829. [DOI] [PMC free article] [PubMed] [Google Scholar]
- Zhao D, Lu X, Wang G, Lan Z, Liao W, Li J, Liang X, Chen JR, Shah S, Shang X, et al. (2017). Synthetic essentiality of chromatin remodelling factor CHD1 in PTEN-deficient cancer. Nature 542, 484–488. [DOI] [PMC free article] [PubMed] [Google Scholar]
- Zhao F, Hoechst B, Duffy A, Gamrekelashvili J, Fioravanti S, Manns MP, Greten TF, and Korangy F (2012). S100A9 a new marker for monocytic human myeloid-derived suppressor cells. Immunology 136, 176–183. [DOI] [PMC free article] [PubMed] [Google Scholar]
Associated Data
This section collects any data citations, data availability statements, or supplementary materials included in this article.
Supplementary Materials
Data Availability Statement
The ChIP-seq data and microarray data have been deposited in the NCBI GEO (http://www.ncbi.nlm.nih.gov/geo) under ID code GSE110175 and GSE109579.