

Abstract
For oligonucleotide therapeutics, chemical modifications of the sugar-phosphate backbone are frequently used to confer drug-like properties. Because 2′-deoxy-2′-fluoro (2′-F) nucleotides are not known to occur naturally, their safety profile was assessed when used in revusiran and ALN-TTRSC02, two short interfering RNAs (siRNAs), of the same sequence but different chemical modification pattern and metabolic stability, conjugated to an N-acetylgalactosamine (GalNAc) ligand for targeted delivery to hepatocytes. Exposure to 2′-F-monomer metabolites was low and transient in rats and humans. In vitro, 2′-F-nucleoside 5′-triphosphates were neither inhibitors nor preferred substrates for human polymerases, and no obligate or non-obligate chain termination was observed. Modest effects on cell viability and mitochondrial DNA were observed in vitro in a subset of cell types at high concentrations of 2′-F-nucleosides, typically not attained in vivo. No apparent functional impact on mitochondria and no significant accumulation of 2′-F-monomers were observed after weekly administration of two GalNAc–siRNA conjugates in rats for ∼2 years. Taken together, the results support the conclusion that 2′-F nucleotides can be safely applied for the design of metabolically stabilized therapeutic GalNAc–siRNAs with favorable potency and prolonged duration of activity allowing for low dose and infrequent dosing.
INTRODUCTION
RNA interference (RNAi) therapeutics are emerging as an important class of human medicines due to their ability to harness a natural cellular mechanism that can potentially regulate the expression of any RNA transcript (1). The first RNAi therapeutic recently entered commercial stage after gaining regulatory approval (2), and several others are currently in late stage clinical development (3–5).
The successful translation of this promising concept into a therapeutic reality has been fundamentally enabled by the development of technologies for safe and efficient delivery of siRNAs to the target cells. Thus far, two platforms for targeted delivery of RNAi therapeutics to the liver, lipid nanoparticles and N-acetylgalactosamine (GalNAc) conjugates, have achieved clinical proof-of-concept. For the latter, a trivalent GalNAc ligand covalently linked to an siRNA mediates targeted delivery to hepatocytes via the asialoglycoprotein receptor (ASGPR) (6). This approach, however, critically depends on protecting the siRNA with chemical modifications against a wide variety of extra- and intracellular nucleases encountered en route from the subcutaneous site of administration to the cytosol of hepatocytes in the liver. In fact, the in vivo potency and duration of activity of GalNAc–siRNA conjugates largely depends on design features, which enhance their ability to withstand extra- and intracellular nucleases, thereby improving their metabolic stability, while maintaining the ability to functionally load the siRNA into the RNA-induced silencing complex (RISC) (7).
Commonly used chemical modifications of siRNAs include modifications of the phosphodiester backbone and/or of the 2′ position of the ribose sugar of nucleotides, such as 2′-deoxy-2′-fluoro (2′-F) and 2′-O-methyl (2′-OMe) (8). The 2′-F-modification, which combines minimal steric bulk at the 2′-position with a 3′-endo (N-type) sugar pucker, constitutes an excellent RNA mimic that tends to preserve structural and functional compatibility with RISC, especially when incorporated into siRNAs at nucleotide positions, which are more sensitive to sterically demanding 2′-modifications (9,10).
When siRNAs are metabolized intracellularly by endo- and exonucleases to yield shorter fragments, individual modified nucleosides and/or nucleotides could possibly be generated and become part of the endogenous nucleoside and nucleotide pools within a cell. The extent and rate at which this may occur largely depends on the metabolic resistance of the siRNA toward nuclease degradation. Our first generation GalNAc–siRNAs with ‘Standard Template Chemistry’ (STC) contained two terminal phosphorothioate (PS) linkages and were fully modified with 2′-OMe and 2′-F (e.g. revusiran, Supplementary Table S1). To further increase metabolic stability, our GalNAc–siRNAs currently in clinical development utilize the ‘Enhanced Stabilization Chemistry’ (ESC) design featuring four additional terminal PS linkages and, generally, a higher 2′-OMe content. These changes in siRNA chemistry provide substantially improved metabolic stability, potency and duration of activity (e.g. ALN-TTRSC02/vutrisiran) (7,9), which allows for significantly lower doses to be administered infrequently (monthly or less frequent) and reduces total drug exposure required to obtain the desired pharmacodynamic effect.
Similar to nucleoside/nucleotide-based anticancer and antiviral therapeutics, nucleoside/nucleotide metabolites of siRNAs can be subject to intracellular 5′-phosphorylation by kinases, thus generating 5′-nucleoside monophosphates (NMPs), 5′-nucleoside diphosphates (NDPs) and 5′-nucleoside triphosphates (NTPs). The latter species represents the active form that may interact with cellular DNA and RNA polymerases, mimicking the action of natural NTPs. Mitochondrial toxicity, which can manifest as hepatic failure, lactic acidosis, pancreatitis, neuropathy and/or myopathy, is a common safety risk of nucleoside and nucleotide analog drugs, including viral reverse-transcriptase inhibitors and viral DNA or RNA polymerase inhibitors (11–13). Such analogs, in their NTP forms, may interfere with both the nuclear and the mitochondrial polymerases, but may preferentially affect mitochondrial replication since it occurs in all phases of the cell cycle and mitochondria become the main consumer of endogenous NTPs in post-mitotic cells (14). Moreover, mitochondrial polymerases have lower selectivity and lower exonuclease proofreading capabilities compared to nuclear polymerases (15,16).
Here, the in vivo fate of 2′-F-monomer metabolites of revusiran (STC) and ALN-TTRSC02 (ESC) and their potential effects on cellular and molecular processes were assessed. These investigations included: characterization of 2′-F-monomer metabolite disposition in rats and humans; the effects of 2′-F-NTPs on polymerases; the effects of 2′-F-nucleosides on cell viability and cellular mitochondrial DNA in vitro; and the effects on mitochondrial structure and function in a 2-year rat carcinogenicity study with two STC GalNAc–siRNAs, revusiran and its rodent surrogate sequence siTTR-3.
MATERIALS AND METHODS
Care and use of laboratory animals
All studies were conducted using protocols consistent with local, state and federal regulations, as applicable, and approved by the Institutional Animal Care and Use Committees (IACUCs) at Alnylam Pharmaceuticals or Covance Laboratories (Madison WI), as applicable.
Test and control articles
GalNAc–siRNA conjugates were synthesized as previously described by Nair et al. (6) and are listed in Supplementary Table S1. Fialuridine (FIAU) was obtained from Moravek (Cat# M-251). Sofosbuvir (SOF) was obtained from Carbosynth (Cat# FS45410). 2′,3′-Dideoxycytidine (ddC) was obtained from Sigma-Aldrich (Cat# D5782). Native and 2′-F-nucleosides were obtained from Carbosynth. Native and 2′-F-NMPs were obtained from NuBlocks, LLC. Native and 2′-F-NTPs were obtained from NuBlocks, LLC and TriLink Biotechnologies.
In vitro metabolism of 2′-F-monomers
2′-F-nucleosides and NMPs (100 μM stock solution in water) were incubated at a final concentration of 10 μM with human liver S9 (1 mg/ml; H0605.S9/Lot. 1110439, Sekisui XenoTech, Kansas City, KS) supplemented with 3.3 mM magnesium chloride in 0.1 M potassium phosphate, pH 7.4, at 37°C for 1 h. The reaction mixtures were quenched by extracting with two volumes of acetonitrile (ACN). After centrifugation at 4200 rpm for 30 min at 4°C, the supernatants were dried in a TurboVap® and the pellets were reconstituted with 200 μl of 5 mM ammonium acetate in reverse osmosis water. Ten microliters of the reconstituted solution was analyzed by liquid chromatography-mass spectrometry/mass spectrometry (LC-MS/MS) on a Vanquish UHPLC system (Thermo Fisher Scientific, San Jose, CA) and Q Exactive™ mass spectrometer (Thermo Scientific, San Jose, CA). The analytes were separated by Luna Omega Polar C18 column (3 μm, 150 × 2.1 mm, Phenomenex). The flow rate was 0.15 ml/min, and the run time per sample was 32 min. The gradient started with 4% buffer B (5 mM ammonium acetate, pH 5.6 in 80/20 ACN/water) and progressed to 30% buffer B in buffer A (5 mM ammonium acetate, pH 5.6 in water) over 26 min.
In vivo exposure to 2′-F-monomers generated from GalNAc–siRNAs
Rat liver, kidney, heart, plasma, urine and bile samples were collected at multiple time points (tissues: 1, 2, 4, 8, 24, 48, 96 and 168 h; plasma: 0.25, 0.5, 1, 2, 4, 8, 24, 48, 96 and 168 h; urine and bile: 0–6, 6–24, 24–48, 48–72, 72–96, 96–120, 120–144 and 144–168 h) after administration of a single 30 mg/kg subcutaneous dose of revusiran or ALN-TTRSC02 to male and female Sprague Dawley rats. For the 2-year rat carcinogenicity study, liver and heart were collected ∼24 h after the last dose at the interim sacrifice on Week 81. Flash-frozen tissue samples and control (untreated) tissues were ground to powders and weighed. A phosphatase treatment step prior to sample analysis was implemented to quantify total 2′-F-monomer pool, including nucleosides, NMPs, NDPs and NTPs. A portion of the control tissue matrix was spiked with 2′-F-NTPs (Set K-1011, TriLink Biotechnologies) to generate quality control (QC) samples and standard curves ranging from 5 to 300 μM. The samples (including standards and QCs) were precipitated by ACN/water (70/30, v/v). The supernatant was dried down, reconstituted in dephosphorylation buffer (50 mM ammonium acetate, 1 mM MgCl2, pH 8.0) and dephosphorylated with calf intestinal alkaline phosphatase (Cat# P7923-10KU, Sigma-Aldrich) at 37°C for 1 h. The dephosphorylated solution was extracted by Hyper-Carb SPE (Cat# 60302-608, Thermo Fisher Scientific) and reconstituted in 200 μl buffer A (5 mM ammonium acetate in water, pH 5.6). A volume of 5 μl of the reconstituted solution was analyzed by LC-MS/MS on a Dionex Ultiate 3000 UHPLC system (Thermo Fisher Scientific, San Jose, CA). 2′-F-nucleosides were analyzed using a TSQ Quantiva™ mass spectrometer (Thermo Fisher Scientific, San Jose, CA) set for selective reaction monitoring (SRM) mode with negative ionization. The 2′-F-nucleosides were separated by Luna Omega polar C18 column (3 μm, 100 Å, 150 × 2.1 mm, Phenomenex). The flow rate was 0.2 ml/min, and the run time per sample was 16.5 min. The gradient started with 5% buffer B (5 mM ammonium acetate, pH 5.6 in 80/20 ACN/water) and progressed to 11% buffer B in buffer A (5 mM ammonium acetate, pH 5.6 in water) over 10 min.
Human plasma (50 μl) and urine (50 μl) samples collected from Phase 1 studies ALN-TTRSC-001 and ALN-TTRSC02-001 were extracted with ACN/water (70/30, v/v), dephosphorylated and extracted by Hyper-Carb SPE as described above.
Quantitation of endogenous nucleosides and nucleotides
A portion of control (untreated) pulverized rat liver was spiked with 13C- and 15N-labeled ribo- or deoxyribonucleoside triphosphates (Sigma-Aldrich) to generate QC samples and standard curves ranging from 0.03125 to 20 μM. The samples (including standards and QCs) were precipitated by ACN/water (70/30, v/v). A phosphatase treatment step prior to sample analysis was implemented to quantify total endogenous monomer pool, including nucleosides, NMPs, NDPs and NTPs. The dried down supernatants were reconstituted in dephosphorylation buffer and dephosphorylated with calf intestinal alkaline phosphatase at 37°C for 1 h. The dephosphorylated solution was precipitated by ACN/water (70/30, v/v) and reconstituted in 150 μl buffer A (5 mM ammonium acetate in water, pH 5.6). A volume of 5 μl of the reconstituted solution was analyzed by LC-MS/MS on a Vanquish UHPLC system (Thermo Fisher Scientific, San Jose, CA). The 13C- and 15N-labeled ribo- or deoxyribonucleoside triphosphate standard curves and QC samples and endogenous ribo- and deoxyribonucleosides were analyzed using a Q Exactive™ mass spectrometer (Thermo Fisher Scientific, San Jose, CA) set for Parallel Reaction Monitoring (PRM) mode with positive ionization. The analytes were separated by Luna Omega Polar C18 column (3 μm, 150 × 2.1 mm, Phenomenex). The flow rate was 0.25 ml/min, and the run time per sample was 14 min. The gradient started with 4% buffer B (5 mM ammonium acetate, pH 5.6 in 80/20 ACN/water) and progressed to 24% buffer B in buffer A (5 mM ammonium acetate, pH 5.6 in water) over 6 min.
DNA polymerase inhibition assays
Human DNA polymerase inhibition assays were performed by Southern Research Institute (Frederick, MD). DNA polymerase α (Pol-α) and DNA polymerase β (Pol-β) were obtained from ChimeRx, and DNA polymerase γ (Pol-γ) was obtained from BPS Bioscience. Pol-α reaction buffer contained 60 mM Tris–HCl, pH 8.0, 5 mM magnesium acetate, 1 mM dithiothreitol (DTT), 0.1 mM spermine and 0.3 mg/ml bovine serum albumin (BSA). Pol-β reaction buffer contained 25 mM Tris–HCl, pH 8.8, 100 mM KCl, 1 mM MgCl2, 1 mM DTT and 0.1 mg/ml BSA. Pol-γ reaction buffer contained 25 mM Tris–HCl, pH 8.0, 100 mM KCl, 10 mM MgCl2, 1 mM DTT and 1 mg/ml BSA. The 25 μl reaction mixture contained buffer, 25 μM each of dATP, dCTP and dGTP, 25 nM TTP, 1 μCi of 3H‐TTP, 160 nM template/primer (1:1), Pol-α, -β or -γ, and serially diluted 2′-F-NTPs (0–200 μM) or fialuridine triphosphate (FIAU-TP) (0–25 μM). The reaction mixture was incubated at 37°C for 1 h and stopped by addition of 25 μl of 20% trichloroacetic acid (TCA) to a final concentration of 10%. The synthesized DNA was precipitated at 4°C for 40 min, washed twice with 10% TCA, once with 70% isopropanol, then counted using a Microbeta instrument. The reduction in incorporated radioactivity represents the potency of compound inhibition. Positive controls were aphidicolin in the Pol-α assay, and 2′,3′-dideoxy NTPs (ddNTPs) in Pol-β and -γ assays.
Mitochondrial polymerase incorporation assays
Purified exonuclease activity-deficient human mitochondrial DNA polymerase γ (Pol-γ exo-mutant) was obtained from the lab of Prof. William Copeland (National Institute of Environmental Health Science, NIEHS, NC, USA). Human mitochondrial RNA polymerase (POLRMT) was purchased from Indigo Biosciences (Cat# MV100-40). Fluorophore-labeled DNA and RNA primers were synthesized at Alnylam Pharmaceuticals; DNA templates were obtained from IDT (primer and template sequences can be found in Supplementary Tables S2 and S3).
Reaction conditions for the Pol-γ incorporation assays were as follows: DNA template (100 nM), 14-mer 5′-fluorophore (Atto-425) labeled DNA primer (100 nM), Pol-γ (exo-mutant) (40 Units), substrate (1 mM dNTP or 2′-F-NTP, or otherwise as indicated), reaction buffer (20 mM Tris–HCl, pH 8.0, 2 mM β-mercaptoethanol, 0.1 mg/ml BSA, 10 mM MgCl2), 37°C for 30 min. Reactions were quenched by the addition of 25 mM ethylenediaminetetraacetic acid (EDTA). FIAU-TP was evaluated in the Pol-γ assay to highlight the relative kinetic differences as compared to 2′-F-NTPs, as previously described (17,18). For the competition assay with mixtures of dNTP and 2′-F-NTP, the single-nucleotide incorporation assays were performed by mixing the corresponding dNTP and 2′-F-NTP in various ratios: 100:1, 10:1, 1:1, 1:10 and 1:100, using the reaction conditions described above. For the 1:1 mixture, concentrations of both the dNTP and 2′-F-NTP were 1 mM. For the 100:1 and 1:100 mixtures, the concentrations of dNTP and 2′-F-NTP were 1 mM:10 μM and 10 μM:1 mM, respectively. The reaction mixtures were diluted with water to 1 nM primer and analyzed by FLD-IEX-HPLC (λexcitation: 436 nm, λemission: 485 nm) using a DNAPac200 4 × 250 mm column. Buffer A: 20 mM sodium phosphate, 10% ACN, pH 11; buffer B: 20 mM sodium phosphate, 10% ACN, 1 M NaBr, pH 11. The flow rate was 1 ml/min and the gradient was 25–40% buffer B in 16 min.
Reaction conditions for the POLRMT incorporation assays were as follows: DNA template (200 nM), 12-mer 5′-fluorophore (Atto-425) labeled RNA primer (25 nM), POLRMT (300 nM), substrate (1 mM NTP or 2′-F-NTP, or otherwise as indicated), reaction buffer (20 mM Tris–HCl, pH 7.5, 10 mM MgCl2, 10 mM DTT, 0.05% Tween-20), 37°C for 30 min. Reactions were quenched by the addition of 25 mM EDTA. For the competition assay with mixtures of NTP and 2′-F-NTP, the single-nucleotide incorporation assays were performed by mixing the corresponding NTP and 2′-F-NTP in various ratios: 100:1, 10:1, 1:1, 1:10 and 1:100, using the reaction conditions described above. For the 1:1 mixture, concentrations of both the NTP and 2′-F-NTP were 1 mM. For the 100:1 and 1:100 mixtures, the concentrations of NTP and 2′-F-NTP were 1 mM:10 μM and 10 μM:1 mM, respectively. The reaction mixtures were diluted with water to 1 nM primer and analyzed by FLD-IEX-HPLC (λexcitation: 436 nm, λemission: 485 nm) using a DNAPac200 4 × 250 mm column. Buffer A: 20 mM sodium phosphate, 10% ACN, pH 11; buffer B: 20 mM sodium phosphate, 10% ACN, 1 M NaBr, pH 11. The flow was 1 ml/min and the gradient was 31–45% buffer B in 16 min for the A, G and U incorporations, and 35–40% buffer B in 16 min for the C incorporations.
Non-obligate chain termination assay
23-mer DNA primer (5′-d[TTGATATTAAAAGAGACAAATTT]-3′) and 50-mer DNA template (5′-d[GCGAAGCTTAGGAGGTAAAAAAAAATGAAATTTGTCTCTTTTAATATCAA]-3′) were synthesized by IDT. The 23-mer DNA primer was radiolabeled using γ-32P ATP (PerkinElmer) and hybridized to the 50-mer. DNA chain elongation reactions (10 μl) were set up as described previously (19) with the following exception: 10 units of Pol-γ (exo- mutant) were used for each reaction. All reactions were run for 10 min at 37°C. Reactions were stopped by adding 10 μl of 2× RNA Loading Dye (New England BioLabs) and were heated at 100°C for 5 min. Samples were then separated on a 12% urea polyacrylamide gel and quantified on a phosphorimager (Typhoon FLA 7000, GE).
Cytotoxicity and mitochondrial DNA quantification
Cell line, media and seeding density information can be found in Supplementary Table S4. HepG2, SkMC, Caki-1, Molt-4, COLO 205 and SNB-78 cells were grown in either glucose- or galactose-containing medium for 1 week, followed by seeding into 96-well plates for monomer treatment. iCell cardiomyocytes were seeded directly onto gelatin-coated 96-well plates as per manufacturer’s instructions and grown for 5 days prior to monomer treatment. Monomers prepared in 1:1 ethanol:water were dosed at concentrations up to 250 μM with every media change on days 0, 3, 7 and 10 for a total of four doses. The final ethanol concentration was 2.5% for the 250 μM dose, and 1% for all the other doses. On day 11, cytotoxicity was assessed by a sulforhodamine B-based assay (Cat#TOX6, Sigma-Aldrich) according to manufacturer’s instructions.
DNA was extracted using Quick-DNA 96 Plus kit (Cat# D4070 and D40701, Zymo Research) following the manufacturer’s protocol for biological fluids and cells. The concentration of the eluted DNA was measured using NanoDrop (Thermo Fisher Scientific) and normalized to 5 ng/μl in nuclease-free water. To quantify mitochondrial DNA, quantitative polymerase chain reaction (qPCR) reactions were performed by combining Light Cycler Master-mix (Cat# 20446020, Roche) and a TaqMan probe specific for Cytochrome Oxidase I (Hs02596864_g1, Thermo Fisher Scientific). To quantify nuclear DNA, a TaqMan probe specific for Succinate Dehydrogenase (Hs05450579_g1, Thermo Fisher Scientific) was used. These reactions were performed in 384-well qPCR plates on a Roche Light-Cycler 480 II.
In vitro exposure to 2′-F-monomers
Two to four million cells (HepG2, SkMC, Caki-1, Molt-4, COLO 205, SNB-78, iCell cardiomyocytes grown in the glucose media as described above and in Supplementary Table S4) were incubated with 2′-F-nucleosides (10 or 250 μM) for 24 h and washed three times with 1× phosphate-buffered saline. Cell pellets were re-suspended on ice in 200 μl of dephosphorylation buffer (50 mM ammonium acetate, 1 mM MgCl2, pH 8.0), sonicated, and lysed with five freeze/thaw cycles in 37°C water bath and liquid nitrogen. Dephosphorylation and quantification of 2′-F-and endogenous monomers were performed as described above for the in vivo samples.
Mitochondrial function and structure evaluation in a rat carcinogenicity study
In a 2-year rat carcinogenicity study, male and female Sprague Dawley rats received once-weekly subcutaneous doses of revusiran at 10, 30 or 100 mg/kg, or a pharmacologically active rodent surrogate siTTR-3 at 30 mg/kg for the duration of the study. Females received 88 doses while males received 97 doses. To evaluate the potential effect of chronic STC GalNAc–siRNA administration on mitochondrial function, blood was collected from 10 animals/sex/group at the terminal necropsy (week 88 in females and 97 in males) and placed into tubes containing sodium fluoride/potassium oxalate. Samples were centrifuged within 30 min of collection at ∼2500 × g for ∼10 min at 2–8°C. Plasma l-lactate was measured using an automated serum chemistry analyzer (Roche/Hitachi MODULAR P). Ultrastructural morphology was evaluated using transmission electron microscopy (TEM) at the terminal sacrifice. Specimens of heart (left ventricle), liver, skeletal muscle (soleus muscle), sural nerve and dorsal root ganglia (lumbar; L4-L6) were collected from three animals/sex/group. Tissues were placed in half-strength Karnovsky’s solution and refrigerated at 2–8°C. Fixed tissues (up to six blocks of each tissue) from each animal were embedded in epoxy resin, sectioned, and slides were prepared and stained with toluidine blue. Based on review of the toluidine blue sections, a minimum of one block from each tissue was trimmed for ultrathin sections (∼50–70 nm), placed onto grids, and stained with lead citrate and uranyl acetate for image capture and ultrastructural examination. Groups of cells (i.e. hepatocytes or myocytes) from a region of interest (i.e. centrilobular and portal regions) were examined at increasing magnifications.
RESULTS
Metabolism of 2′-F-monomers in vitro
Following the delivery of 2′-F-containing GalNAc–siRNAs to hepatocytes, 2′-F-monomers (both nucleosides and NMPs) can be generated as a result of exo- and endonuclease cleavage activity. To help identify all potential nucleoside/nucleotide-based 2′-F-metabolites for in vivo monitoring, 2′-F-nucleosides and 2′-F-NMPs were incubated with human liver S9 extract. Consistent with reported results describing metabolism of the corresponding endogenous nucleosides (20), 2′-F-guanosine (2′-F-G) and 2′-F-uridine (2′-F-U) were stable whereas 2′-F-adenosine (2′-F-A) and 2′-F-cytidine (2′-F-C) were rapidly deaminated to 2′-F-inosine (2′-F-I) and 2′-F-U, respectively (Figure 1A and B). These deamination events were also detected when 2′-F-nucleosides were incubated with HepG2 cells (Supplementary Figure S1A).
Figure 1.

2′-F-monomer metabolism in vitro. Ion chromatograms extracted from LC-MS/MS data obtained after incubation of 2′-F-nucleosides (A and B) or 2′-F-NMPs (C and D) in human liver S9 at 37°C for 1 h. (A) Almost complete conversion of 2′-F-A to 2′-F-I. The observed masses were 270.0996 (−0.4 ppm) and 271.0837 (0 ppm), respectively. (B) Almost complete conversion of 2′-F-C to 2′-F-U. The observed masses were 246.0883 (−0.8 ppm) and 247.0726 (0.4 ppm), respectively. (C) No apparent conversion of 2′-F-AMP to 2′-F-IMP. Approximately 50% loss of 2′-F-AMP was most likely due to dephosphorylation to 2′-F-A followed by deamination to 2′-F-I. (D) No apparent conversion of 2′-F-CMP to 2′-F-UMP. Approximately 20% loss of 2′-F-CMP was most likely due to dephosphorylation to 2′-F-C followed by deamination to 2′-F-U.
Incubation of 2′-F-NMPs yielded no deaminated 2′-F-NMP species. The only metabolites were the corresponding dephosphorylated 2′-F-nucleosides and deaminated nucleosides arising from 2′-F-A and 2′-F-C (Figure 1C and D). Based on these findings, assays were developed to quantify 2′-F-A, -U, -G, -C and -I in liver, kidney, heart, plasma, urine and bile samples following GalNAc–siRNA administration.
Rat exposure to 2′-F-monomers generated from revusiran (STC) and ALN-TTRSC02 (ESC)
To characterize 2′-F-monomer generation and distribution in the rat, revusiran (STC GalNAc–siRNA, containing 22 2′-F-modifications and two PS linkages) and ALN-TTRSC02 (ESC GalNAc–siRNA of the same sequence as revusiran, containing nine 2′-F-modifications and six PS linkages) (Supplementary Table S1) were administered subcutaneously to rats at a single suprapharmacological dose of 30 mg/kg. After phosphatase treatment to collapse all phosphorylated species to the nucleoside level, 2′-F-monomer concentrations were assessed in liver, kidney, heart, plasma, urine and bile by liquid chromatography/tandem mass spectrometry (LC-MS/MS) (Table 1, Figure 2A and B).
Table 1.
Pharmacokinetic parameters of 2′-F-monomers liberated from STC (revusiran) or ESC (ALN-TTRSC02) GalNAc–siRNAs after a single subcutaneous dose of 30 mg/kg to rats
| 2′-F-A | 2′-F-G | 2′-F-I | 2′-F-C | 2′-F-U | |||||||
|---|---|---|---|---|---|---|---|---|---|---|---|
| STC | ESC | STC | ESC | STC | ESC | STC | ESC | STC | ESC | ||
| C max (μM) | Liver | 12.8 | 3.2 | 10.8 | 1.7 | 11.8 | 1.4 | 2.3 | <1* | 7.6 | <1* |
| Kidney | <0.5* | <0.5* | 2.6 | <0.5* | 3 | 0.2 | 2.6 | <0.5* | 4 | 0.5 | |
| Heart | <0.5** | <0.5* | <0.5* | <0.5* | NM | NM | 3.2 | <0.5* | 4.3 | <0.7* | |
| Plasma | <0.03* | <0.03* | <0.03* | <0.03* | 0.03 | 0.004 | 1.9 | 0.04 | 2.6 | 0.3 | |
| AUClast (μM h) | Liver | 942 | 345 | 722 | 138 | 833 | 170 | 38.4 | NR | 424 | NR |
| Kidney | NR | NR | 150 | NR | 141 | 15.1 | 114 | NR | 260 | NR | |
| Heart | NR | NR | NR | NR | NM | NM | 101 | NR | 270 | NR | |
| Plasma | NR | NR | NR | NR | 1.9 | NR | 91 | 3.6 | 170 | 6.4 | |
| t max (h) | Liver | 36 | 48 | 36 | 48 | 36 | 96 | 16 | NR | 24 | NR |
| Kidney | NR | NR | 16 | NR | 24 | 60 | 16 | NR | 24 | 168 | |
| Heart | NR | NR | NR | NR | NM | NM | 8 | NR | 28 | NR | |
| Plasma | NR | NR | NR | NR | 16 | 72 | 8 | 24 | 16 | 48 | |
| t 1/2 (h) | Liver | NR | NR | NR | NR | 23.7 | NR | NR | NR | NR | NR |
| Kidney | NR | NR | 46.9 | NR | 34 | NR | 38.3 | NR | NR | NR | |
| Heart | NR | NR | NR | NR | NM | NM | NR | NR | NR | NR | |
| Plasma | NR | NR | NR | NR | NR | NR | 22.9 | NR | 31.7 | NR | |
| μg | Urine | 0.12 | <0.003* | 1.3 | <0.003* | 41.5 | 5.2 | 96 | 5.4 | 209 | 7.8 |
| Bile | 0.51 | <0.0004* | 0.042 | <0.0004* | 1.6 | 0.6 | 0.56 | <0.0004* | 5.8 | <0.001* | |
| % dose | Urine | 0.015 | <0.0005* | 0.45 | <0.002* | 5.1# | 0.97 | 13 | 2.2 | 21 | 3.2 |
| Bile | 0.064 | <0.00007* | 0.014 | <0.0003* | 0.20# | 0.11 | 0.08 | <0.0002* | 0.58 | <0.0004* | |
* = Values below the lower limit of quantification (LLOQ); # = assuming full conversion of 2′-F-A to 2′-F-I; AUClast = area under the concentration versus time curve from time of dosing to last measurable concentration; Cmax = maximum observed concentration; NM = not measured; NR = not reportable (not enough time points after tmax for the calculation); tmax = time to reach maximum observed concentration; t = elimination half-life. Bile and urine were collected over a period of 168 h. All data represent an average of three male and three female rats.
Figure 2.

Generation of 2′-F-monomers from revusiran (STC) and ALN-TTRSC02 (ESC) GalNAc–siRNAs in the rat. Time-concentration profiles in liver, kidney, heart and plasma of 2′-F-monomers generated from revusiran (blue) or ALN-TTRSC02 (red) GalNAc–siRNAs after a single subcutaneous dose of 30 mg/kg to rats (average of 3 animals/group). (A) 2′-F-pyrimidines. (B) 2′-F-purines. (C) Liver concentrations of endogenous ribonucleotides (top) and deoxyribonucleosides (bottom) relative to 2′-F-monomer liver Cmax after a single subcutaneous dose of 30 mg/kg of revusiran or ALN-TTRSC02 to rats. All concentrations represent the total nucleotide pool quantified by LC-MS/MS following dephosphorylation to nucleoside forms. Group means are shown; error bars represent the standard deviation; N = 3 animals per group for the 2′-F-monomer measurement; N = 22 animals per group for the endogenous monomer measurement.
For revusiran, 2′-F-purines were detected with a maximum observed concentration (Cmax) range 10.8–12.8 μM in liver and <0.5–3 μM in kidney, with corresponding time to reach maximum concentration (tmax) values of ∼36 and 16–24 h, respectively, but were not found in plasma or heart. These results suggest that 2′-F- purines that are generated locally in the two tissues with the highest GalNAc–siRNA uptake (liver >> kidney) are predominantly present in their phosphorylated forms, which minimizes their efflux and broader distribution (Supplementary Figure S1A and S1B). 2′-F-purines were eliminated from the liver and the kidney with a half-life ( ) of ∼20–50 h.
In contrast to 2′-F-purines, 2′-F-pyrimidines generated from revusiran were found in plasma and heart, in addition to liver and kidney, with a Cmax range 1.9–7.6 μM, tmax range 8–24 h and  range ∼22–40 h. The wider distribution of 2′-F-pyrimidines suggests that these products tend to exist as unphosphorylated nucleosides that can freely diffuse throughout the body (Supplementary Figure S1A).
Renal excretion was the major route of elimination for 2′-F-monomers generated from revusiran (up to 209 μg, or 21% of the total dose of 2′-F-monomers), although a small fraction was also eliminated in bile (up to 5.8 μg, or 0.58% of the total dose of 2′-F-monomers) over the course of 7 days. Thus, after a suprapharmacological dose of revusiran to rats, 2′-F-monomers are generated at low micromolar levels and are not expected to accumulate with weekly (or less frequent) dosing due to a half-life of 1 to 2 days. Indeed, there was no evidence of marked 2′-F-monomer accumulation in the liver or heart when revusiran was dosed to rats at 30 mg/kg weekly for 81 weeks (Supplementary Figure S2A and S2B).
Consistent with higher metabolic stability and lower 2′-F-content, exposure to generated 2′-F-monomers was reduced with ALN-TTRSC02 administered subcutaneously to rats at a suprapharmacological dose of 30 mg/kg (Table 1, Figure 2A and B). 2′-F-purines were only detectable in the liver, with a 4-8-fold lower Cmax (1.4–3.2 μM) and longer tmax (48–96 h) compared to revusiran. 2′-F-pyrimidines were largely undetectable across all the tested matrices. Therefore, exposure to released 2′-F-purines and the systemic exposure to 2′-F-pyrimidines is transient and minimized with the ESC design.
Next, to assess a potential impact of generated 2′-F-monomers on endogenous monomer pools, the levels of native ribo- and deoxyribonucleotides were determined in rat liver, the tissue with highest measured 2′-F-monomer Cmax after administration of revusiran and ALN-TTRSC02 (Figure 2C). The endogenous values were consistent with published reports (20). Following revusiran administration at 30 mg/kg, the ratios of generated 2′-F-monomers at Cmax to endogenous ribonucleotides ranged from 1:16 (for G) to 1:285 (for I). The ratios to endogenous deoxyribonucleotides ranged from 1:1.5 (for A) to 1:28 (for C). Following ALN-TTRSC02 administration at 30 mg/kg, these ratios were reduced, ranging from 1:102 (for G) to greater than 1:1016 (for U). The ratios to endogenous deoxyribonucleotides ranged from 1:6 (for A) to greater than 1:64 (for C). Therefore, even at suprapharmacological doses of revusiran or ALN-TTRSC02, the concentrations of 2′-F-monomers generated in rat liver did not exceed levels of corresponding endogenous ribo- and deoxyribonucleotide pools.
Human exposure to 2′-F-monomers generated from revusiran (STC) and ALN-TTRSC02 (ESC)
After dosing revusiran at 7.5 mg/kg daily for 5 days to healthy volunteers, only 2′-F-U and 2′-F-I were detectable in plasma, reaching steady state at concentrations around 4.1 and 0.11 μM, respectively (Figure 3A). The fact that 2′-F-U and 2′-F-I approached steady state within 5 days after daily dosing also suggests that plasma half-life of these monomers is <1 day. Detection of 2′-F-U and 2′-F-I in human plasma and urine likely reflects their poor phosphorylation efficiency and thus higher efflux from the liver (Supplementary Figure S1A). Based on the approximate rat 2′-F-U liver to plasma ratio of 3 and approximate ratios of 2′-F-U to the other 2′-F-monomers in rat liver, the projected Cmax range for 2′-F-monomers in human liver is ∼3–20 μM after five daily doses of revusiran. Detection of 2′-F-C in rat but not human plasma could be explained by more efficient conversion to 2′-F-U by cytidine deaminase, which is reported to have higher activity in human liver compared to rodents (21,22).
Figure 3.
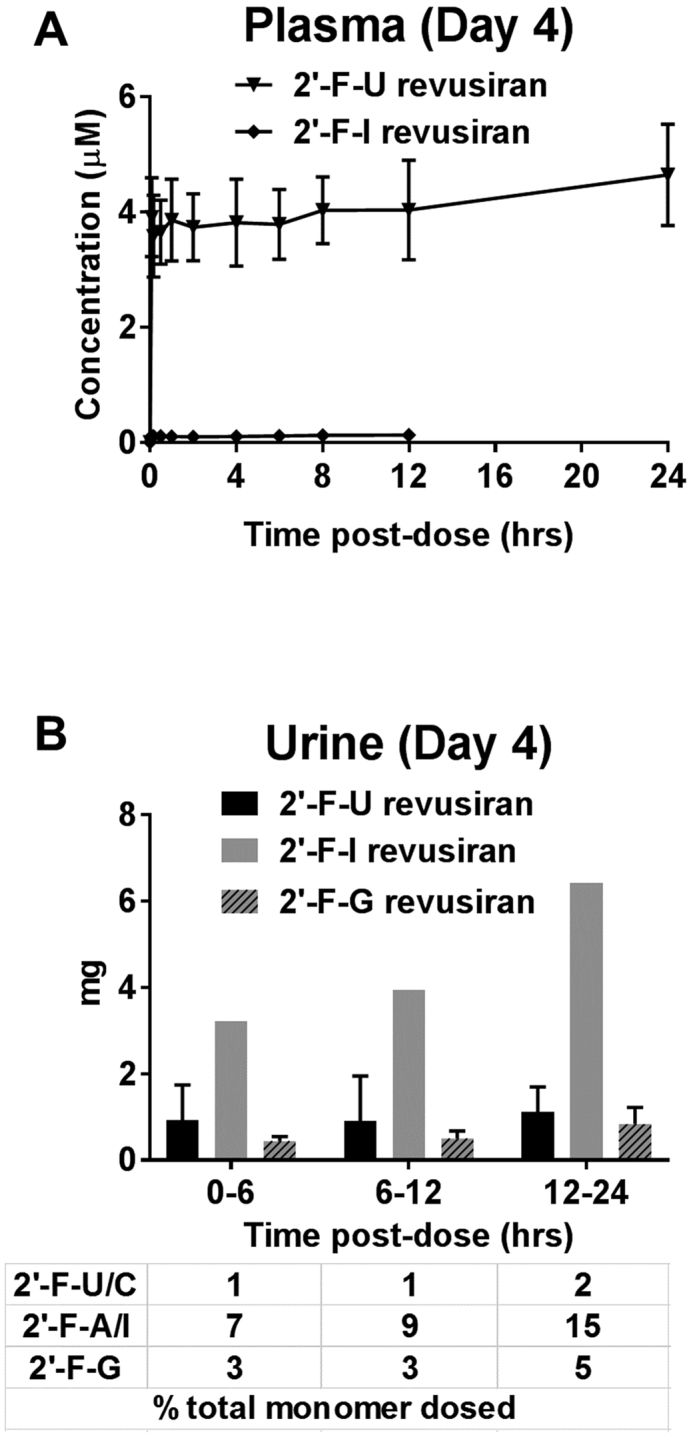
Generation of 2′-F-monomers from revusiran (STC) and ALN-TTRSC02 (ESC) in humans. (A) Plasma time–concentration profiles of 2′-F-monomers generated from revusiran after five daily doses at 7.5 mg/kg, or ALN-TTRSC02 after a single dose at 50 mg (∼0.83 mg/kg), to healthy volunteers. All five 2′-F-monomers were measured. Only 2′-F-U and 2′-F-I were detected in revusiran samples. No 2′-F-monomers were detected in ALN-TTRSC02 samples. (B) Renal excretion of 2′-F-monomers generated from revusiran after five daily doses at 7.5 mg/kg, or ALN-TTRSC02 after a single dose at 50 mg (∼0.83 mg/kg), to healthy volunteers. All five 2′-F-monomers were measured. Only 2′-F-U, 2′-F-G and 2′-F-I were detected in revusiran samples. No 2′-F-monomers were detected in ALN-TTRSC02 samples. All concentrations represent the total nucleotide pool quantified by LC-MS/MS following dephosphorylation to nucleoside forms. Group means are shown; error bars represent the standard deviation; N = 6 subjects per group.
After five daily doses of revusiran, 2′-F-U, 2′-F-I and 2′-F-G were detectable in urine on Day 4 and appeared to have reached steady state (Figure 3B). The amounts of 2′-F-monomers in urine represented only a small percentage (1–15%) of the total dose of 2′-F-monomers, suggesting that revusiran was eliminated renally mainly in the form of oligomers.
Given the greater metabolic stability of the ESC design and based on the available human data, the annualized pharmacologically relevant dose to achieve similar pharmacodynamic activity is ∼280 times lower for ALN-TTRSC02 compared to revusiran. After a single 50 mg dose of ALN-TTRSC02 to healthy volunteers (corresponding to ∼0.83 mg/kg), no 2′-F-monomers were detectable in plasma or urine. Based on the lower limit of quantitation of 1 ng/ml (corresponding to ∼0.004 μM), this indicates >1000-fold and >27-fold lower 2′-F-U and 2′-F-I exposure, respectively, compared to revusiran dosed at 7.5 mg/kg daily for 5 days. Therefore, at therapeutically relevant dose levels, the extent of 2′-F-monomer generation from ALN-TTRSC02 is minimized due to its enhanced metabolic stability and lower 2′-F-content.
Polymerase inhibition and incorporation
To evaluate the potential inhibitory effects of 2′-F-monomers on human cellular polymerases, increasing concentrations of each of the four 2′-F-NTPs (0–200 μM) were incubated with template/primer pairs, recombinant human nuclear DNA polymerases (Pol-α and -β) or human mitochondrial DNA polymerase (Pol-γ), and the four endogenous dNTPs spiked with a radiolabeled dTTP. The synthesized DNA was precipitated, washed and counted by liquid scintillation. The concentration resulting in 50% inhibition (IC50) and the concentration resulting in 90% inhibition (IC90) values for the positive controls (ddNTPs and Aphidicolin) and FIAU-TP, a 2′-arabinofluoro-2′-deoxypyrimidine analog for which clinical development for hepatitis B was discontinued due to mitochondrial toxicity through interactions with mitochondrial Pol-γ (15,23,24), were in the range of 0.06 to <3.13 μM, and 0.65 to 16.5 μM, respectively (Table 2). In contrast, both IC50 and IC90 values for 2′-F-NTPs were generally >200 μM. In this assay, the 200 μM concentration represents a 4:1 excess relative to native dNTPs. As described above, this concentration and ratio is not achieved in vivo even at suprapharmacological doses of revusiran or ALN-TTRSC02 (Table 1 and Figure 2C). Similar to 2′-F-NTPs, the IC50 values for the triphosphate form of Sofosbuvir (Sovaldi®), an approved anti-HCV nucleoside analog with good human safety profile, were also reported to be >200 μM (25).
Table 2.
Half-maximal inhibitory concentrations (IC50) of 2′-F-monomers in the human DNA polymerase activity assays
| Pol-α | Pol-β | Pol-γ | ||||
|---|---|---|---|---|---|---|
| Test article | IC50 (μM) | IC90 (μM) | IC50 (μM) | IC90 (μM) | IC50 (μM) | IC90 (μM) |
| 2′-F-ATP | >200 | >200 | 175 | >200 | >200 | >200 |
| 2′-F-CTP | >200 | >200 | >200 | >200 | >200 | >200 |
| 2′-F-GTP | >200 | >200 | >200 | >200 | >200 | >200 |
| 2′-F-UTP | >200 | >200 | 91.6 | >200 | >200 | >200 |
| 2′-F-ITP | >200 | >200 | >200 | >200 | >200 | >200 |
| FIAU-TP | 0.27 | 13.7 | 0.37 | 5.56 | 1.04 | 13.4 |
| Positive control | Aphidicolin | ddNTP | ddNTP | |||
| <3.13 | 16.5 | 0.06 | 0.65 | 0.35 | 8.65 | |
ddNTP: dideoxy nucleoside 5′ triphosphates; FIAU-TP: fialuridine triphosphate; IC50: concentration resulting in 50% inhibition; IC90: concentration resulting in 90% inhibition. The DNA polymerase assays were performed using dATP, dCTP and dGTP, dTTP, 3H-dTTP, template/primer, human DNA polymerase, and increasing concentrations of 2′-F-NTPs or FIAU-TP. After an incubation period of 1 h, the radioactivity in the precipitated DNA was counted. The potency of polymerase inhibition was determined by the reduction of radioactivity. Aphidicolin was used as a positive control compound in Pol-α assay, and ddNTPs were used as positive controls in Pol-β and -γ assays. The IC50 and IC90 values were derived from triplicate measurements at each tested concentration (0, 6.25, 12.5, 25, 50, 100, 200 μM for 2′-F-ATP, 2′-F-CTP, 2′-F-GTP; 0, 6.25, 12.5, 25, 50, 100, 200, 400, 800 μM for 2′-F-UTP; 0, 0.79, 1.57, 3.13, 6.25, 12.5, 25, 50, 100, 200, 400, 800 μM for FIAU-TP).
We next evaluated the potential for 2′-F-NTPs to be incorporated into nascent mitochondrial DNA or RNA using a novel in vitro primer extension assay for the two polymerases present in human mitochondria, Pol-γ and POLRMT. In these assays, 5′-fluorescently labeled primer/template pairs were designed for +1 base-pair nucleotide addition, and primer extension was assessed by fluorescence detection ion-exchange high-performance liquid chromatography following the addition of NTPs. In isolation, all 2′-F-NTPs were incorporated by both DNA and RNA mitochondrial polymerases (Tables 3 and 4;Supplementary Figure S3 and S4), consistent with previously published reports (17,26,27). The columns labeled ‘native only’ represent the percent extension with endogenous NTPs, and the remaining columns represent different ratios of native to modified NTPs as indicated. All four endogenous (d)NTPs were incorporated to a much greater extent, resulting in mixtures of multiple incorporation products, including mismatch incorporations. In the presence of endogenous (d)NTPs, minor incorporation of 2′-F-NTPs was observed only when the 2′-F-modified nucleotide was present at a 100-fold excess to the endogenous NTP and a 10- to 100-fold excess to the endogenous dNTP for POLRMT and Pol-γ, respectively; moreover, the endogenous (d)NTP-incorporated product was always the major product of the reaction for both polymerases.
Table 3.
Incorporation of 2′-F-monomers in the Pol-γ primer extension assay
| Pol-γ | ||||||
|---|---|---|---|---|---|---|
| Native:F Ratio | Native onlya | 1:1 | 1:10 | 1:100 | F only | |
| 2′-F-ATP | % Native product | 95.9a | 96.3a | 97.1a | 79.8b | NA |
| % 2′-F product | NA | ND | ND | 17.6b | 94.2a | |
| 2′-F-GTP | % Native product | 89.2a | 85.0a | 88.9a | 56.0b | NA |
| % 2′-F product | NA | ND | ND | 23.7b | 73.9a | |
| 2′-F-CTP | % Native product | 97.3a | 96.2a | 90.6b | 64.5b | NA |
| % 2′-F product | NA | ND | 4.4b | 30.9b | 94.0a | |
| 2′-F-UTP | % Native product | 83.3a | 83.8a | 90.0b | 80.1b | NA |
| % 2′-F product | NA | ND | 2.9b | 7.6b | 87.3a | |
| FIAU-TP | % Native product | 98.3a | 91.7b | 51.7b | 11.0b | NA |
| % 2′-F product | NA | 4.5b | 44.0b | 82.7b | 94.4a | |
aCalculated as 100% minus the % area of the remaining primer based on the integration of the FLD signal at λex = 436 nm and λem = 485 nm.
bCalculated from the integration of each corresponding peak. The remaining % (to 100%, not shown) corresponds to the % area of the remaining primer.
Integration was automatically performed using the Agilent OpenLab CDS ChemStation Software. Only peaks of interest were selected for integrations. Data are a representative example of experiments independently performed at least two times with similar results. Representative plots can be found in the Supplementary Data. NA = not applicable (NTP not present in reaction); ND = not detected (integration peak area <1.0%).
Table 4.
Incorporation of 2′-F-monomers in the POLRMT primer extension assay
| POLRMT | ||||||
|---|---|---|---|---|---|---|
| Native:F Ratio | Native onlya | 1:1 | 1:10 | 1:100 | F only | |
| 2′-F-ATP | % Native product | 69.2a | 67.8a | 63.5a | 51.4a | NA |
| % 2′-F product | NA | ND | ND | ND | 42.6a | |
| 2′-F-GTP | % Native product | 95.0a | 96.4a | 83.4a | 69.2b | NA |
| % 2′-F product | NA | ND | ND | 8.9b | 78.9a | |
| 2′-F-CTP | % Native product | 48.8a | 39.3a | 43.7a | 37.0b | NA |
| % 2′-F product | NA | ND | ND | 9.1b | 58.7a | |
| 2′-F-UTP | % Native product | 40.8a | 32a | 45.3a | 35.6a | NA |
| % 2′-F product | NA | ND | ND | ND | 31.8a | |
| FIAU-TP | % Native product | 34.6a | 25.1a | 25.4a | 24.10b | NA |
| % 2′-F product | NA | ND | ND | 1.1b | 21.0a | |
aCalculated as 100% minus the % area of the remaining primer based on the integration of the FLD signal at λex = 436 nm and λem = 485 nm.
bCalculated from the integration of each corresponding peak. The remaining % (to 100%, not shown) corresponds to the % area of the remaining primer.
Integration was automatically performed using the Agilent OpenLab CDS ChemStation Software. Only peaks of interest were selected for integrations. Data are a representative example of experiments independently performed at least two times with similar results. Representative plots can be found in the Supplementary Data. NA = not applicable (NTP not present in reaction). ND = not detected (integration peak area <1.0%).
The results were significantly different when FIAU-TP was used in the same Pol-γ competition experiment against dTTP (Table 3 and Supplementary Figure S3C). In this case, incorporation of FIAU-TP was detected even at the 1:1 ratio, with the FIAU incorporation product becoming the major incorporation product at the 10:1 ratio and the only incorporation product at the 100:1 excess ratio. The notion that FIAU-TP is a viable substrate for Pol-γ, even in the presence of dTTP, is consistent with its previously described mechanisms of toxicity (18). Furthermore, the large difference between FIAU-TP and 2′-F-NTP incorporation efficiency into nascent DNA is consistent with previously reported studies in rats and woodchucks where 2′-F-pyrimidines were administered daily by intravenous injection up to 500 mg/kg/day for 90 days with no apparent FIAU-like adverse effects and 10–20-fold lower incorporation rate into rat liver DNA (17,24,28).
Obligate and non-obligate chain termination
We also evaluated the potential for 2′-F-NTPs to behave as chain terminators during elongation, using a variation of the primer extension assay described above. Here, 5′-fluorescently labeled DNA and RNA primers were synthesized bearing the 2′-F-monomers at the terminal 3′ position to test whether a theoretical incorporation of a 2′-F-monomer affects elongation and/or causes chain termination of mitochondrial polymerization reactions using natural nucleotides and Pol-γ or POLRMT, respectively. When compared to the 3′-unmodified primers, the primers containing the 2′-F-modified nucleotides at their 3′-end did not show any inhibition or arrest of the nascent DNA or RNA synthesis, both for the +1 and +3 nucleotide incorporations. Thus, these analogs, once incorporated, support further chain elongation and do not appear to act as chain terminators. A representative example of a 2′-F-A primer, efficiently extended by +1 or +3 dGTP incorporations by Pol-γ is depicted in Figure 4A. These results are consistent with negative results for 2′-F-NTPs in the polymerase inhibition assays (Table 2).
Figure 4.

Assessment of the obligate and non-obligate chain termination potential of 2′-F-monomers. (A) Chain elongation by human mitochondrial DNA Pol-γ from a 2′-F-A-modified primer. Ion exchange high-performance liquid chromatography (HPLC) traces are represented as a function of retention time of elution (min, X-axis) and fluorescence absorbance (fluorescence units, Y-axis). All product peaks are compared to the retention time of the primer peak. Fluorescence absorbance scale is automatically normalized to the height of the major product. Labels indicate the identity of polymerase incorporation products. Representative traces of duplicate experiments are shown. (B) Non-obligate chain termination with 2′-F-UTP or FIAU-TP by Pol-γ. An end-labeled 23-mer probe was hybridized to a 50-mer probe and incubated with Pol-γ at 37°C for 10 min along with varying concentrations and combinations of dTTP, 2′-F-UTP and FIAU-TP (in the presence of native dCTP, dATP and dGTP). The solid line on the left represents the hybridized portion of the 23/50-mer duplex, while the nucleotides indicated above represent the elongation template sequence for Pol-γ. The arrow indicates the start of the nine-adenosine run in the elongation template. Purified, end-labeled 50-mer and 23-mer probes were run together as standards in lanes 1 and 17.
Further, we assessed the ability of 2′-F-UTP to act as a non-obligate chain terminator for Pol-γ, as has been reported for FIAU-TP (19). Different concentrations of 2′-F-UTP and FIAU-TP (0.01–1 μM) were tested alone or in the presence of different concentrations of dTTP in a primer-template extension assay in which the 24-mer primer must be extended past an initial stretch of nine adjacent adenosines in the DNA template to create a 50-mer fully extended product (Figure 4B). In the presence of the four native deoxynucleotides, Pol-γ was able to copy the DNA template yielding products between 24 and 50 nucleotides in length depending on dTTP concentration (0.01–1 μM) with a strong band of full-length product clearly visible at 1 μM dTTP (lanes 2–4). In the presence of native dTTP (1 μM), 2′-F-UTP (at 0.01, 0.1 or 1 μM) had essentially no impact on chain elongation (lanes 8–10), whereas FIAU-TP (lanes 5–7) caused a reduction in full-length product and an increase in shorter products at the highest concentration (1 μM, lane 7). Substitution of 2′-F-UTP (1 μM) for dTTP in the elongation assay led to a weak smear of elongated species with very little full-length product (lane 14), consistent with our observation that 2′-F-UTP is not an ideal substrate for Pol-γ. However, complete replacement of dTTP with FIAU-TP at 1 μM restricted elongation products to 31 nucleotides in length (lane 11), consistent with the previously observed chain elongation defect of consecutively incorporated FIAU-TP analogs (19). Note that the incorporation of FIAU-TP leads to faster migrating oligonucleotide products (lanes 7 and 11–13), as has been previously described (19). In competition with dTTP, FIAU-TP (1 μM) continued to strongly impair elongation when present at 100-fold or 10-fold excess over dTTP (compare lanes 11, 12 and 3). In contrast, the presence of dTTP reduced the elongation defect observed at a 10-fold excess of 2′-F-UTP relative to native dTTP (lane 16 versus lane 3).
Cell-based assays
Finally, a panel of human cell lines derived from mitochondria-rich tissues (liver, muscle, kidney, heart, blood, intestine, brain and heart) was used to evaluate the effects of 2′-F-nucleoside exposure on cell viability and mitochondrial DNA. Two strategies were employed to increase the sensitivity to potential mitochondrial effects. First, in parallel to glucose-containing media, cells were cultured in glucose-free galactose media to shift the ATP production mechanism from glycolysis to oxidative phosphorylation (29). Second, the assays were performed after long-term exposure (four doses over 11 days), because any impact on mitochondria is typically delayed due to initial abundance of mitochondria and mitochondrial DNA. The highest tested concentration of 250 μM was ∼20-fold higher than the highest measured 2′-F-monomer Cmax for revusiran in rat, and ∼12-fold higher than the highest projected 2′-F-monomer Cmax for revusiran in human. For ALN-TTRSC02, these margins were 80- and >20 000-fold, respectively. Unphosphorylated nucleosides were used to maximize intracellular uptake. ddC was used as a positive control and sofosbuvir (Sovaldi®) (25,30) was used as a negative control.
Cytotoxicity was assessed by measuring the total biomass (protein) using the sulforhodamine B-based assay on day 11 (Table 5). Most cell types (liver, muscle, kidney, blood and intestine) did not show differential sensitivity to 2′-F-monomer exposure in glucose versus galactose media, indicating that any effects on cell viability are unlikely due to mitochondrial toxicity. Only the neuronal cell line SNB-78 showed increased cytotoxicity in the galactose media for a subset of monomers, with half-maximal cytotoxic concentration (CC50) values for 2′-F-A, 2′-F-G, 2′-F-C and sofosbuvir decreasing by 2–10-fold compared to glucose media (to the lowest value of 12 μM), indicating a potential contribution of mitochondrial toxicity to the observed reduction in cell viability. Across the cell lines, 2′-F-G and 2′-F-C tended to be more cytotoxic than 2′-F-A, 2′-F-I and sofosbuvir. No significant cytotoxicity was observed with 2′-F-U in any cell line.
Table 5.
Half-maximal cytotoxic concentrations (CC50) of 2′-F-monomers in cell-based assays
| CC50 (μM) | ||||||||
|---|---|---|---|---|---|---|---|---|
| Media | 2′-F-A | 2′-F-G | 2′-F-C | 2′-F-U | 2′-F-I | SOF | ddC | |
| HepG2 (liver) | Glucose | 110 | 115 | >250 | >250 | >250 | 114 | >20 |
| Galactose | 108 | 112 | >250 | >250 | >250 | 97 | >20 | |
| SkMC (muscle) | Glucose | 114 | 127 | >250 | >250 | >250 | >250 | >20 |
| Galactose | >250 | 110 | >250 | >250 | >250 | >250 | >20 | |
| Caki-1 (kidney) | Glucose | 69 | 32 | 51 | >250 | 55 | >250 | >20 |
| Galactose | 43 | 30 | >250 | >250 | 29 | >250 | >20 | |
| Molt-4 (blood) | Glucose | 81 | 15 | 7.7 | >250 | >250 | >250 | 8.7 |
| Galactose | 111 | 12 | 4.5 | >250 | >250 | >250 | >20 | |
| COLO 205 (intestine) | Glucose | 121 | 19 | 40 | >250 | 114 | 155 | >20 |
| Galactose | 107 | 22 | 47 | >250 | 109 | 123 | >20 | |
| SNB-78 (CNS) | Glucose | 108 | 35 | >250 | >250 | >250 | >250 | >20 |
| Galactose | 51 | 12 | 26 | >250 | >250 | 120 | >20 | |
| iCell cardiomyocytes (heart) | Galactose | >250 | >250 | >250 | >250 | >250 | >250 | >250 |
2′-F-nucleosides, ddC and sofosbuvir (SOF) were added to cells grown in either glucose- or galactose-containing media on days 0, 3, 7 and 10. Cytotoxicity was assessed on day 11 using the sulforhodamine B assay to measure total biomass (total protein). CC50 values were derived using XLfit from triplicate measurements at each tested concentration (0, 016, 0.8, 4, 20, 100, 250 μM for 2′-F-nucleosides and SOF; 0, 0.0064, 0.032, 0.16, 0.8, 4, 20 μM for ddC).
There was a wide range of sensitivity to 2′-F-nucleosides across the tested cell lines. Liver, muscle and heart cells were least sensitive to 2′-F-nucleoside exposure, with CC50 values generally >100 μM. Kidney, blood, intestinal and neuronal cells showed intermediate sensitivity, with the majority of CC50 values >10 μM. The sensitivity of each cell type appeared to be directly related to the 2′-F-monomer uptake efficiency. When intracellular exposures to 2′-F-monomers were assessed relative to endogenous ribonucleotides (Supplementary Figure S5), cell types with more efficient 2′-F-monomer uptake (e.g. Molt-4) were more sensitive compared to cell lines with less efficient uptake (e.g. HepG2).
Next, potential effects of 2′-F-nucleosides on mitochondrial DNA abundance were evaluated by assessing DNA levels of mitochondrial genome-encoded Cytochrome C Oxidase I (MT-CO1) and nuclear genome-encoded Succinate Dehydrogenase Complex Flavoprotein Subunit A (SDHA) by quantitative PCR on day 11 (Supplementary Figure S6). Only nucleoside doses that resulted in a minimal impact on cell viability (<10% reduction) were considered for this analysis to avoid potential confounding effects downstream of cell death. As expected, the known chain terminator ddC caused dose-dependent reductions in mitochondrial DNA synthesis across all cell lines, generally resulting in 70–80% reduction at ≤4 μM. 2′-F-pyrimidines had no impact on mitochondrial DNA in any cell line, and 2′-F-purines had no impact in the blood and intestinal cell lines. Modest reductions in mitochondrial DNA were observed with 2′-F-purines in liver, muscle, kidney and heart cells: ∼20–30% decrease at 4 μM, and ∼40–60% decrease at ≥20 μM. There was no correlation between differential sensitivity to mitochondrial DNA reductions and the intracellular 2′-F-monomer concentration across the tested cell lines (Supplementary Figure S5).
Assessment of mitochondrial effects in a rat carcinogenicity study with two STC GalNAc–siRNAs
In a 2-year rat carcinogenicity study, revusiran and the STC rodent surrogate sequence siTTR-3 were administered weekly at 10, 30 and 100 mg/kg or at 30 mg/kg, respectively, by subcutaneous injection to male and female Sprague Dawley rats. No treatment-related effects on carcinogenicity or on the overall survivability were observed in male or female rats compared to the control group (Sutherland et al., manuscript in preparation). No statistically significant differences were observed in plasma lactate concentrations, a measure of mitochondrial toxicity, in males or females given either revusiran or siTTR-3 compared to the control group (Figure 5A). Furthermore, there were no treatment-related ultrastructural findings seen in the dorsal root ganglia, heart or sural nerve.
Figure 5.

Effects on mitochondrial function and structure in a rat carcinogenicity study with two STC GalNAc–siRNAs. Male and female Sprague Dawley rats were dosed subcutaneously once weekly with revusiran at 10, 30 or 100 mg/kg or siTTR-3 (rodent TTR) at 30 mg/kg for the duration of the study. (A) Plasma lactate at the terminal necropsy (day 675 for males and day 612 for females). Each data point represents an individual animal; males (N = 10) and females (N = 10) were pooled. There were no statistically significant differences between groups (P > 0.05). Levene’s test was done to test for equality of variances between groups. Levene’s test was not significant (P > 0.05) and therefore ANOVA was conducted on the untransformed data. The group effect of the ANOVA was significant (P ≤ 0.05) and therefore Dunnett’s t-test was used for pairwise comparisons between each revusiran- and siTTR-3-treated and control group. Group comparisons (revusiran and siTTR-3 groups versus saline group) were evaluated at the 5.0%, two-tailed probability level. (B) Left panel: portal hepatocytes from one control female; right panel: portal hepatocytes from one female administered 100 mg/kg revusiran. Note the increased lipid vacuoles and numerous elongated and/or ring-shaped or cup-shaped mitochondria in the hepatocytes of the treated animal compared with control. Both images are of 2650× magnification. (C) Left panel: mitochondria from centrilobular hepatocyte of one control female; right panel: mitochondria from centrilobular hepatocyte of one male administered 100 mg/kg revusiran. The mitochondrial cristae are similar in both animals. Both images are of 53 000× magnification.
In the liver, treatment-related ultrastructural findings were seen in animals given either revusiran at ≥10 mg/kg or siTTR-3 at 30 mg/kg. These ultrastructural findings included an increased incidence and/or severity of lipid vacuoles in the hepatocytes, lysosomes with lipofuscin, and elongated and ring-shaped/cup-shaped mitochondrial profiles and enlarged mitochondria in both portal and centrilobular hepatocytes (Figure 5B). These treatment-related mitochondrial findings were also noted in skeletal myocytes (soleus muscle) of some revusiran- and siTTR-3-treated animals. Enlargement of mitochondria was the only ultrastructural finding not seen in some control animals, whereas lipid vacuoles, lysosomes with lipofuscin and elongated mitochondria were occasionally observed in the hepatocytes of control animals, suggesting the incidence of these findings was not solely related to chronic administration of revusiran or siTTR-3.
Finally, although these ultrastructural changes in mitochondria morphology were a consistent feature in hepatocytes, and to a lesser degree in skeletal myocytes, there was no evidence of mitophagy, mitochondrial degeneration/necrosis, changes in cristae morphology or other indicators of overt mitochondrial toxicity in the hepatocytes or skeletal myocytes in animals given either revusiran or siTTR-3 (Figure 5C).
DISCUSSION
We have systematically studied the potential for 2′-F-monomer generation from revusiran and ALN-TTRSC02, two GalNAc-siRNA conjugates with the same sequence but different chemical modification patterns and metabolic stabilities. Our investigations in rats and humans have demonstrated that 2′-F-nucleosides/nucleotides are generated from revusiran maximally at low micromolar levels. These species do not significantly accumulate in plasma or tissues with weekly (or less frequent) dosing due to their estimated short half-life of ∼1–2 days. As a consequence of the improved stability and lower dose requirements, 2′-F-monomer generation is considerably minimized in both rats and humans with ALN-TTRSC02, an ESC version of revusiran, such that they are not detected in plasma or urine at pharmacological doses in humans and in plasma and most tissues at suprapharmacological doses in rats. At Alnylam, the ESC design has fully replaced the first generation STC design (7,9) and is used in all GalNAc–siRNAs currently in clinical development.
After a single subcutaneous dose of 30 mg/kg revusiran to rats, only 2′-F-pyrimidines but not 2′-F-purines re-distributed systemically at low concentrations. Detectable 2′-F-purine concentrations were largely limited to the liver and the kidney; however, no lactic acidosis, liver failure or nephrotoxicity has been observed with GalNAc–siRNAs in non-clinical or clinical studies to date (31), consistent with low 2′-F-monomer exposures and large margins based on the in vitro safety evaluation. Importantly, 2′-F-pyrimidines have been already extensively de-risked in prior long-term studies in woodchuck and rat (28), where no evidence of mitochondrial toxicity was observed. Another 2′-F-nucleoside-based drug, Sofosbuvir (Sovaldi®), a prodrug of 2′-fluoro-2′-C-methyluridine-5′-monophosphate, is widely used for the treatment of chronic hepatitis C and has an excellent safety record (25,30). FIAU, which has been associated with severe toxicity in clinical studies and in woodchucks (18,23,24), carries a 2′-F modification but in the arabino (up) configuration as well as a 5-iodo modification on the uracil base; it is thus quite structurally distinct from Sofosbuvir and the 2′-F-nucleosides present in siRNA conjugates.
Previous work reported by Richardson et al. (17) examined the ability of human mitochondrial Pol-γ to incorporate 2′-F-NTPs into DNA templates in the absence of endogenous dNTPs, demonstrating that the polymerase was able to individually incorporate all 2′-F-NTPs (and FIAU-TP); however, with significantly decreased Vmax/Km values (strongly reduced enzyme affinity for the 2′-F-NTP substrates). Conversely, affinity of FIAU-TP was found to be similar to that of endogenous dNTPs with much higher ‘misincorporation frequency’ of 125% relative to the natural dTTP compared to 2′-F-NTPs with misincorporation frequencies ranging between 0.5% (2′-F-UTP) and 16% (2′-F-GTP). Our study links these previously published data on ‘misincorporation frequency’ of individual 2′-F-NTPs by human Pol-γ with additional results using ‘competition’ experiments with endogenous dNTPs and 2′-F-NTPs. We rationalized that this may better reflect intracellular conditions of 2′-F-ribonucleotide metabolites competing with endogenous dNTPs following administration of GalNAc–siRNA conjugates. Under these conditions, high excess of 2′-F-NTPs (10- to 100-fold excess over dNTPs) was required for detectable incorporation. Based on the quantitation of 2′-F-monomers generated in rat and human from revusiran or ALN-TTRSC02, this is unlikely to occur in vivo. These data are consistent with previously reported low (relative to FIAU) incorporation rates into liver DNA after direct intravenous administration of 2′-F-C and 2′-F-U up to 500 mg/kg/day for 90 days in rats and up to 7.5 mg/kg/day for 90 days in woodchucks (28,32). However, the potential differences in pharmacokinetic properties between intravenously administered 2′-F-nucleosides and 2′-F-nucleosides generated from GalNAc–siRNAs in hepatocytes may limit the conclusions one can draw from those earlier studies.
Recently, Saleh et al. (26) reported that at high ratios to endogenous ribonucleosides (≥1:5), 2′-F-monomers can be incorporated into RNA and DNA in vitro in TK6 human lymphoblastoid cells, reducing RNA and DNA synthesis rates. Such high ratios ratio to endogenous ribonucleosides are unlikely to occur in vivo, particularly for ESC conjugates. Even at a 30 mg/kg dose of ALN-TTRSC02, the highest ratio detected was 1:102. Furthermore, incorporation rates in rapidly dividing cells in vitro may be exaggerated compared to post-mitotic tissues in vivo.
In summary, our in vitro studies demonstrate that (i) 2′-F-NTPs are weak inhibitors and poor substrates for DNA and RNA mitochondrial polymerases relative to the endogenous (d)NTPs, (ii) do not readily act as chain terminators and (iii) are efficiently out-competed by native nucleotides in the elongation reactions. Hence, while we cannot exclude this possibility, their potential for incorporation into nascent cellular DNA or RNA in the presence of endogenous (d)NTPs appears to be low, even at suprapharmacological doses. In human liver, kidney, heart, muscle, intestine, blood and neuronal cell models, cytotoxic effects were cell-line-dependent, largely unrelated to mitochondrial toxicity, and observed at ratios to endogenous monomers that are not observed in vivo after administration of revusiran or ALN-TTRSC02. Nevertheless, the mechanism(s) and in vivo relevance of the modest mtDNA decreases observed in a subset of cell lines with 2′-F-nuclesides in vitro need to be investigated further.
Mitochondrial toxicities, such as cardiomyopathy, hepatic steatosis, pancreatitis, skeletal myopathy, lactic acidosis and neuropathy (33), have been associated with certain nucleoside analogs. In vivo, the extent of systemic re-distribution of 2′-F-purines appears to be minimal following generation from GalNAc–siRNAs in liver and kidney and, to date, there is no evidence of liver failure or nephropathy in clinical (33) or pre-clinical (34) studies with STC or ESC GalNAc–siRNAs. At completion of the 2-year rat carcinogenicity study where rats were dosed weekly with up to 100 mg/kg of two STC GalNAc–siRNA conjugates containing 22 2′-F-ribonucleotides, treatment-related ultrastructural changes involving mitochondria observed in liver hepatocytes and skeletal myocytes (soleus muscle) were limited to elongated and ring-shaped/cup-shaped mitochondrial profiles and enlarged mitochondria in animals given either ≥10 mg/kg of revusiran or 30 mg/kg of siTTR-3. Similar ultrastructural changes were not observed in the heart, sural nerve or dorsal root ganglia. Of these two ultrastructural findings, enlargement of mitochondria was the only finding not seen in some control animals, whereas elongated mitochondria were occasionally observed in the hepatocytes of control animals, which suggested the incidence of these findings was not solely related to chronic administration of revusiran or siTTR-3. Thus, utilizing ‘a weight of evidence approach’, the ultrastructural mitochondrial changes that were observed in affected hepatocytes and myocytes (i.e., the elongation and enlargement) were not associated with plasma lactate elevations, or with adverse changes such as mitophagy, mitochondrial degeneration/necrosis or alterations in cristae morphology (34).
Furthermore, as described by Gomes et al. (35), mitochondrial elongation occurs during times of limited nutrient availability and serves to spare mitochondria from degradation by macroautophagy and increase cristae to promote cellular viability by optimizing ATP production. Therefore, the structural mitochondrial changes that were observed in this study were considered non-adverse and more consistent with an adaptive response. This conclusion was further supported by the lack of an overall difference in survivability of treated groups compared to controls in this study (Sutherland et al., manuscript in preparation). Consistent with the lack of treatment-related effects on carcinogenesis, all of the 2′-F-modified GalNAc–siRNAs tested to date yielded negative results in both in vitro and in vivo genotoxicity studies up to dose limits set by the International Conference on Harmonisation guidance S2(R1) (31,36).
Finally, the treatment-related increases in lipid vacuoles noted in liver hepatocytes with both, revusiran and siTTR-3, were an expected finding, as hepatocellular vacuolation has been described following sub-chronic administration of GalNAc–siRNAs to rats but not monkeys. It is also observed with GalNAc–siRNAs containing only natural modifications such as 2′-OMe and may be related to miR-122 downregulation in rats (31). The degree of hepatocellular vacuolation was not considered adverse. In this study, the exposure to 2′-F-monomers can be considered to represent a ‘worst case’ scenario due to the low metabolic stability, relatively high 2′-F-content and exposure to 2′-F-monomers, as well as the relatively high and frequent doses of the STC GalNAc–siRNAs revusiran and siTTR-3 compared to the newer ESC designs.
The results of our comprehensive assessment indicate that the overall risk for mitochondrial toxicity or other toxic side effects mediated by 2′-F-monomer metabolites of GalNAc–siRNA conjugates is low. In addition, the potential exposure to 2′-F-monomers has been minimized with the ESC design, due to lower drug exposure required for equivalent pharmacodynamic effects, while limiting metabolite production. Overall these data support the safety of long-term administration of 2′-F-containing GalNAc–siRNA conjugates especially those containing ESC designs, such as ALN-TTRSC02. These results are consistent with our previous work showing that the hepatotoxicity, which is occasionally observed in rodents at supratherapeutic exposures, can be attributed to sequence-dependent, RNAi-mediated off-target effects rather than siRNA chemistry or the perturbation of RNAi pathways (37).
Supplementary Material
ACKNOWLEDGEMENTS
We thank our colleagues, past and present, from Alnylam’s Early Development and Research groups for their support for this work and Dr Saraswathy V. Nochur for critical review of the manuscript.
SUPPLEMENTARY DATA
Supplementary Data are available at NAR Online.
FUNDING
Alnylam Pharmaceuticals. Funding for open access charge: Alnylam Pharmaceuticals.
Conflict of interest statement. All authors are, or have been during the time this work was conducted, employees of Alnylam Pharmaceuticals.
REFERENCES
- 1. Wittrup A., Lieberman J.. Knocking down disease: a progress report on siRNA therapeutics. Nat. Rev. Genet. 2015; 16:543–552. [DOI] [PMC free article] [PubMed] [Google Scholar]
- 2. Adams D., Gonzalez-Duarte A., O’Riordan W.D., Yang C.C., Ueda M., Kristen A.V., Tournev I., Schmidt H.H., Coelho T., Berk J.L. et al.. Patisiran, an RNAi therapeutic, for hereditary transthyretin amyloidosis. N. Engl. J. Med. 2018; 379:11–21. [DOI] [PubMed] [Google Scholar]
- 3. Fitzgerald K., Kallend D., Simon A.. A highly durable RNAi therapeutic inhibitor of PCSK9. N. Engl. J. Med. 2017; 376:e38. [DOI] [PubMed] [Google Scholar]
- 4. Pasi K.J., Rangarajan S., Georgiev P., Mant T., Creagh M.D., Lissitchkov T., Bevan D., Austin S., Hay C.R., Hegemann I. et al.. Targeting of antithrombin in hemophilia A or B with RNAi therapy. N. Engl. J. Med. 2017; 377:819–828. [DOI] [PubMed] [Google Scholar]
- 5. Zimmermann T.S., Karsten V., Chan A., Chiesa J., Boyce M., Bettencourt B.R., Hutabarat R., Nochur S., Vaishnaw A., Gollob J.. Clinical proof of concept for a novel Hepatocyte-Targeting GalNAc-siRNA conjugate. Mol. Ther. 2017; 25:71–78. [DOI] [PMC free article] [PubMed] [Google Scholar]
- 6. Nair J.K., Willoughby J.L., Chan A., Charisse K., Alam M.R., Wang Q., Hoekstra M., Kandasamy P., Kel’in A.V., Milstein S. et al.. Multivalent N-acetylgalactosamine-conjugated siRNA localizes in hepatocytes and elicits robust RNAi-mediated gene silencing. J. Am. Chem. Soc. 2014; 136:16958–16961. [DOI] [PubMed] [Google Scholar]
- 7. Nair J.K., Attarwala H., Sehgal A., Wang Q., Aluri K., Zhang X., Gao M., Liu J., Indrakanti R., Schofield S. et al.. Impact of enhanced metabolic stability on pharmacokinetics and pharmacodynamics of GalNAc-siRNA conjugates. Nucleic Acids Res. 2017; 45:10969–10977. [DOI] [PMC free article] [PubMed] [Google Scholar]
- 8. Lundin K.E., Gissberg O., Smith C.I.. Oligonucleotide therapies: The past and the present. Hum. Gene Ther. 2015; 26:475–485. [DOI] [PMC free article] [PubMed] [Google Scholar]
- 9. Foster D.J., Brown C.R., Shaikh S., Trapp C., Schlegel M.K., Qian K., Sehgal A., Rajeev K.G., Jadhav V., Manoharan M. et al.. Advanced siRNA Designs Further Improve In Vivo Performance of GalNAc-siRNA Conjugates. Mol. Ther. 2018; 26:708–717. [DOI] [PMC free article] [PubMed] [Google Scholar]
- 10. Manoharan M., Akinc A., Pandey R.K., Qin J., Hadwiger P., John M., Mills K., Charisse K., Maier M.A., Nechev L. et al.. Unique gene-silencing and structural properties of 2′-fluoro-modified siRNAs. Angew. Chem. Int. Ed. Engl. 2011; 50:2284–2288. [DOI] [PMC free article] [PubMed] [Google Scholar]
- 11. Fleischer R., Boxwell D., Sherman K.E.. Nucleoside analogues and mitochondrial toxicity. Clin. Infect. Dis. 2004; 38:e79–e80. [DOI] [PubMed] [Google Scholar]
- 12. Lewis W., Day B.J., Copeland W.C.. Mitochondrial toxicity of NRTI antiviral drugs: an integrated cellular perspective. Nat. Rev. Drug Discov. 2003; 2:812–822. [DOI] [PubMed] [Google Scholar]
- 13. Brinkman K., ter Hofstede H.J., Burger D.M., Smeitink J.A., Koopmans P.P.. Adverse effects of reverse transcriptase inhibitors: mitochondrial toxicity as common pathway. AIDS. 1998; 12:1735–1744. [DOI] [PubMed] [Google Scholar]
- 14. Falkenberg M., Larsson N.G., Gustafsson C.M.. DNA replication and transcription in mammalian mitochondria. Annu. Rev. Biochem. 2007; 76:679–699. [DOI] [PubMed] [Google Scholar]
- 15. Johnson A.A., Johnson K.A.. Fidelity of nucleotide incorporation by human mitochondrial DNA polymerase. J. Biol. Chem. 2001; 276:38090–38096. [DOI] [PubMed] [Google Scholar]
- 16. Johnson A.A., Johnson K.A.. Exonuclease proofreading by human mitochondrial DNA polymerase. J. Biol. Chem. 2001; 276:38097–38107. [DOI] [PubMed] [Google Scholar]
- 17. Richardson F.C., Kuchta R.D., Mazurkiewicz A., Richardson K.A.. Polymerization of 2′-fluoro- and 2′-O-methyl-dNTPs by human DNA polymerase alpha, polymerase gamma, and primase. Biochem. Pharmacol. 2000; 59:1045–1052. [DOI] [PubMed] [Google Scholar]
- 18. Johnson A.A., Ray A.S., Hanes J., Suo Z., Colacino J.M., Anderson K.S., Johnson K.A.. Toxicity of antiviral nucleoside analogs and the human mitochondrial DNA polymerase. J. Biol. Chem. 2001; 276:40847–40857. [DOI] [PubMed] [Google Scholar]
- 19. Lewis W., Levine E.S., Griniuviene B., Tankersley K.O., Colacino J.M., Sommadossi J.P., Watanabe K.A., Perrino F.W.. Fialuridine and its metabolites inhibit DNA polymerase gamma at sites of multiple adjacent analog incorporation, decrease mtDNA abundance, and cause mitochondrial structural defects in cultured hepatoblasts. Proc. Natl. Acad. Sci. U.S.A. 1996; 93:3592–3597. [DOI] [PMC free article] [PubMed] [Google Scholar]
- 20. Traut T.W. Physiological concentrations of purines and pyrimidines. Mol. Cell Biochem. 1994; 140:1–22. [DOI] [PubMed] [Google Scholar]
- 21. Camiener G.W., Smith C.G.. Studies of the enzymatic deamination of cytosine arabinoside. I. Enzyme distribution and species specificity. Biochem. Pharmacol. 1965; 14:1405–1416. [DOI] [PubMed] [Google Scholar]
- 22. Veltkamp S.A., Pluim D., van Tellingen O., Beijnen J.H., Schellens J.H.. Extensive metabolism and hepatic accumulation of gemcitabine after multiple oral and intravenous administration in mice. Drug Metab. Dispos. 2008; 36:1606–1615. [DOI] [PubMed] [Google Scholar]
- 23. McKenzie R., Fried M.W., Sallie R., Conjeevaram H., Di Bisceglie A.M., Park Y., Savarese B., Kleiner D., Tsokos M., Luciano C. et al.. Hepatic failure and lactic acidosis due to fialuridine (FIAU), an investigational nucleoside analogue for chronic hepatitis B. N. Engl. J. Med. 1995; 333:1099–1105. [DOI] [PubMed] [Google Scholar]
- 24. Richardson F.C., Engelhardt J.A., Bowsher R.R.. Fialuridine accumulates in DNA of dogs, monkeys, and rats following long-term oral administration. Proc. Natl. Acad. Sci. U.S.A. 1994; 91:12003–12007. [DOI] [PMC free article] [PubMed] [Google Scholar]
- 25. Gilead Sciences, I. Sofosbuvir for treatment of chronic hepatitis C infection - Antiviral Drugs Advisory Committee Meeting Briefing Document. 2013; Foster City: Gilead Sciences, Inc. [Google Scholar]
- 26. Saleh A.F., Bachman M., Priestley C.C., Gooderham N.J., Andersson P., Henry S.P., Edmunds N.J., Fellows M.D.. 2′-O-(2-Methoxyethyl) nucleosides are not phosphorylated or incorporated into the genome of human lymphoblastoid TK6 cells. Toxicol. Sci. 2018; 163:70–78. [DOI] [PubMed] [Google Scholar]
- 27. Arnold J.J., Sharma S.D., Feng J.Y., Ray A.S., Smidansky E.D., Kireeva M.L., Cho A., Perry J., Vela J.E., Park Y. et al.. Sensitivity of mitochondrial transcription and resistance of RNA polymerase II dependent nuclear transcription to antiviral ribonucleosides. PLoS Pathog. 2012; 8:e1003030. [DOI] [PMC free article] [PubMed] [Google Scholar]
- 28. Richardson F.C., Tennant B.C., Meyer D.J., Richardson K.A., Mann P.C., McGinty G.R., Wolf J.L., Zack P.M., Bendele R.A.. An evaluation of the toxicities of 2′-fluorouridine and 2′-fluorocytidine-HCl in F344 rats and woodchucks (Marmota monax). Toxicol. Pathol. 1999; 27:607–617. [DOI] [PubMed] [Google Scholar]
- 29. Swiss R., Will Y.. Assessment of mitochondrial toxicity in HepG2 cells cultured in high-glucose- or galactose-containing media. Curr. Protoc. Toxicol. 2011; 49:2.20.1–2.20.14. [DOI] [PubMed] [Google Scholar]
- 30. D’Ambrosio R., Aghemo A., Colombo M.. Assessing safety and efficacy of sofosbuvir for the treatment of hepatitis C. Expert Opin. Drug Saf. 2015; 14:473–484. [DOI] [PubMed] [Google Scholar]
- 31. Janas M.M., Harbison C.E., Perry V.K., Carito B., Sutherland J.E., Vaishnaw A.K., Keirstead N.D., Warner G.. The nonclinical safety profile of GalNAc-conjugated RNAi therapeutics in subacute studies. Toxicol. Pathol. 2018; 46:735–745. [DOI] [PMC free article] [PubMed] [Google Scholar]
- 32. Richardson F.C., Zhang C., Lehrman S.R., Koc H., Swenberg J.A., Richardson K.A., Bendele R.A.. Quantification of 2′-fluoro-2′-deoxyuridine and 2′-fluoro-2′-deoxycytidine in DNA and RNA isolated from rats and woodchucks using LC/MS/MS. Chem. Res. Toxicol. 2002; 15:922–926. [DOI] [PubMed] [Google Scholar]
- 33. Brinkman K., Smeitink J.A., Romijn J.A., Reiss P.. Mitochondrial toxicity induced by nucleoside-analogue reverse-transcriptase inhibitors is a key factor in the pathogenesis of antiretroviral-therapy-related lipodystrophy. Lancet. 1999; 354:1112–1115. [DOI] [PubMed] [Google Scholar]
- 34. Pandiri A.R., Kerlin R.L., Mann P.C., Everds N.E., Sharma A.K., Myers L.P., Steinbach T.J.. Is it adverse, nonadverse, adaptive, or artifact. Toxicol. Pathol. 2017; 45:238–247. [DOI] [PMC free article] [PubMed] [Google Scholar]
- 35. Gomes L.C., Scorrano L.. Mitochondrial morphology in mitophagy and macroautophagy. Biochim. Biophys. Acta. 2013; 1833:205–212. [DOI] [PubMed] [Google Scholar]
- 36. Janas M.M., Jiang Y., Duncan R.G., Hayes A.N., Liu J., Kasperkovitz P.V., Placke M.E., Barros S.A.. Exposure to siRNA-GalNAc conjugates in systems of the standard test battery for genotoxicity. Nucleic Acid Ther. 2016; 26:363–371. [DOI] [PubMed] [Google Scholar]
- 37. Janas M.M., Schlegel M.K., Harbison C.E., Yilmaz V.O., Jiang Y., Parmar R., Zlatev I., Castoreno A., Xu H., Shulga-Morskaya S. et al.. Selection of GalNAc-conjugated siRNAs with limited off-target-driven rat hepatotoxicity. Nat. Commun. 2018; 9:723. [DOI] [PMC free article] [PubMed] [Google Scholar]
Associated Data
This section collects any data citations, data availability statements, or supplementary materials included in this article.