

Summary
MCAK belongs to the Kin I subfamily of kinesin-related proteins, a unique group of motor proteins that are not motile but instead destabilize microtubules. We show that MCAK is an ATPase that catalytically depolymerizes microtubules by accelerating, 100-fold, the rate of dissociation of tubulin from microtubule ends. MCAK has one high-affinity binding site per protofilament end, which, when occupied, has both the depolymerase and ATPase activities. MCAK targets protofilament ends very rapidly (on-rate 54 µM−1·s−1), perhaps by diffusion along the microtubule lattice, and, once there, removes ~20 tubulin dimers at a rate of 1 s−1. We propose that up to 14 MCAK dimers assemble at the end of a microtubule to form an ATP-hydrolyzing complex that processively depolymerizes the microtubule.
Introduction
The Kin I proteins are an unusual subfamily of kinesin-related proteins (Kim and Endow, 2000; Lawrence et al., 2002): in the presence of ATP they do not move along the surface of MTs (microtubules) like other motor proteins but instead bind to the ends of MTs and depolymerize them (Desai et al., 1999). The Kin I family includes mitotic centromere-associated kinesin (MCAK) from mouse (Noda et al., 1995; Santama et al., 1998), XKCM1 from Xenopus (Walczak et al., 1996), and FKIF from fish (Bost-Usinger et al., 1997). Consistent with the depolymerization activity of Kin I kinesins observed in vitro, depletion or inhibition of XKCM1 increases the size of the mitotic spindle in egg extracts, presumably by increasing the length of the constituent MTs (Walczak et al., 1996; Tournebize et al., 2000). Also, inhibition of MCAK interferes with the poleward movement of chromosomes during anaphase A in CHO cells (Maney et al., 1998); again, this is consistent with MCAK depolymerizing MTs because chromosome movement during anaphase is associated with the shortening of the MTs that connect the chromosome (via the kinetochore at which MCAK is localized) to the pole. The finding that overexpression of MCAK causes loss of MTs in interphase as well as mitotic cells (Maney et al., 1998, 2001), together with the high levels of expression of FKIF2 and mKIF2 in nondividing cells in the retina and the brain, suggests that Kin I kinesins also regulate MT depolymerization outside of mitosis (Kinoshita et al., 2001).
The evidence that Kin I kinesins can depolymerize MTs in vitro is strong. Addition of purified, recombinant proteins to MTs that have been stabilized by taxol or the slowly hydrolyzed GTP analog GMP-CPP causes almost complete loss of polymer in the presence of ATP after 10–30 min (Desai et al., 1999; Maney et al., 2001; Niederstrasser et al., 2002; Moores et al., 2002). Further-more, when MTs are incubated with Kin I kinesins in the presence of the nonhydrolyzable ATP analog AMP-PNP, electron micrographs reveal curled protofilament structures at their ends (GMP-CPP-stabilized MTs; Desai et al., 1999) or in solution (taxol-stabilized MTs; Moores et al., 2002). This again supports a depolymerizing activity because protofilament curls are intermediate structures in the depolymerization pathway (Mandelkow et al., 1991; Muller-Reichert et al., 1998).
In contrast to the evidence for depolymerization activity, the evidence that Kin I kinesins are motors that move along the MT surface is weak. An early report suggested that mKIF2 has directed motility (Noda et al., 1995), but we and others (Desai et al., 1999) have not been able to replicate this finding, and a critical examination of the experimental methods indicates that contamination by kinesin or another plus-end-directed motor cannot be ruled out.
With their unique functional and structural properties, Kin I kinesins may provide a window into the mechanism by which motor proteins in general regulate the depolymerization of MTs (Lombillo et al., 1995; Hunter and Wordeman, 2000). There are many open questions about how Kin I kinesins depolymerize MTs. How does a Kin I kinesin get to the end of a MT? Does it stay at the hamster (Wordeman and Mitchison, 1995), mKIF2 from end of the MT while it removes tubulin dimers—is it processive? Or does it dissociate from the MT end with each tubulin dimer that it removes—is it nonprocessive? How is ATP hydrolysis coupled to the depolymerization reaction? Kin I proteins are classified as kinesins because they share the conserved motor domain that defines this superfamily of proteins. Because the motor domain of conventional kinesin is an ATPase, it is expected that Kin I kinesins are also ATPases. However, the ATPase activity of Kin I kinesins has not been measured, and there are reports that ATP hydrolysis is not necessary for the depolymerization activity (Moores et al., 2002). To address these questions, we have developed assays to quantify simultaneously the depolymerization and ATPase activities of MCAK.
Results
Real-Time Microscopy Assay of MCAK-Mediated Microtubule Disassembly
The depolymerization activity of MCAK was quantified by comparing the rates of depolymerization of individual MTs in the presence and absence of purified MCAK using a microscopy assay. To circumvent the complexity introduced by MT dynamics, the switching of MTs between growing and shrinking phases (Mitchison and Kirschner, 1984), all the MTs used in this study were polymerized in the presence of the slowly hydrolyzed GTP analog GMP-CPP. Such MTs are very stable (Hyman et al., 1992; Caplow et al., 1994), and in the absence of MCAK they depolymerize at a negligible rate.
In the presence of a saturating concentration of MCAK (20 nM), MTs depolymerized at a rate of 0.880 ± 0.015 µm/min (mean ± SE, n = 8) (Figures 1A and 1B). In the absence of MCAK, MTs depolymerized at a rate of only 0.008 ± 0.026 µm/min (mean ± SE, n = 6) in agreement with previous measurements (0.003 to 0.02 µm/min; Hyman et al., 1992; Caplow et al., 1994) and with our turbidity results (0.013 ± 0.006 µm/min, mean ± SE, n = 8; see below). Thus, saturating MCAK accelerates the shrinkage rate of MTs 110-fold. In molecular terms, MCAK accelerates the rate at which tubulin dimers dissociate from the two ends of a MT from 0.23 s−1 to 26 s−1 (GMP-CPP MTs are composed of 14 protofilaments [Table 1] and therefore contain 1750 tubulin dimers per micron). By using the inhomogeneity of the fluorescence intensity along the length of the MT (the “speckles” of Waterman-Storer and Salmon, 1998) as reference points, we confirmed that MTs depolymerized from both ends. The rate of depolymerization at the faster end divided by that at the slower end was 1.56 ± 0.18 (mean ± SD, n = 5).
Figure 1. MCAK-Mediated Depolymerization of GMP-CPP Microtubules Assayed by Fluorescence Microscopy and Turbidity.
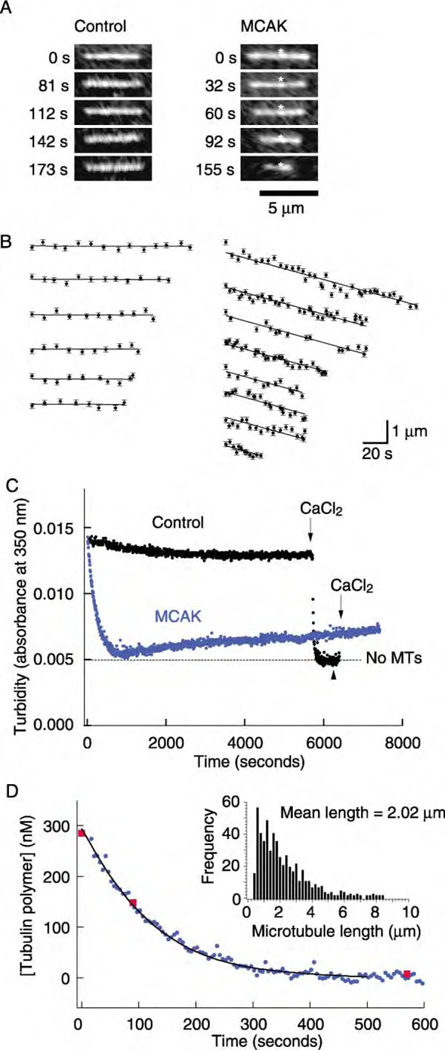
(A) Sequential images of MTs in the absence (left) and presence (right) of 20 nM MCAK and 2 mM ATP. The images of the MT on the right are aligned on a brighter region (asterisk), showing that the MT depolymerized from both ends.
(B) Length versus time traces of MTs depolymerized in the absence or presence of MCAK (20 nM). In the presence of MCAK, MTs depolymerized at a rate of ~1 µm/min.
(C) Turbidity traces show the loss of 300 nM GMP-CPP-tubulin polymer over time in the absence (black) and presence (blue) of 2 nM MCAK. The addition of 5 mM CaCl2 to the control reaction reduced the turbidity to the background level measured in the absence of MTs (dashed line) and caused complete depolymerization as confirmed by the spindown assay done at the time marked by the black arrowhead. The small, slow increase in the turbidity is an artifact, perhaps due to the slow formation of non-MT oligomers.
(D) The amount of tubulin polymer as a function of time. The addition of 4 nM MCAK caused a complete loss of polymer after 500 s (circles). The validity of turbidity as a measure of MT depolymerization was confirmed by the spindown assay (squares). The initial rate of depolymerization and the length distribution of the starting population of MTs (inset) were used to model the loss of polymer over time; the model curve (solid line) represents a MT shrinkage rate of 0.8 µm/min.
Table 1.
Depolymerase Activity of MCAK
| Quantity | Parameter | Value |
|---|---|---|
| Maximum shrinkage rate per MTa | 0.95 ± 0.1 µm/min | |
| Maximum tubulin off rate per MTa | 28 ± 3 s−1 | |
| Protofilaments per MTb | 14.0 ± 0.2 | |
| Maximum MCAKs per protofilament end | N/(14 × 2) | 0.86 ± 0.14 |
| Maximum tubulin off rate per protofilament end | kcat | 1.0 ± 0.2 s−1 |
| Affinity for protofilament end | K | 1.0 ± 0.2 nM |
| Association rate to protofilament end | kon | 54 ± 9 µM−1·s−1 |
| Dissociation rate from protofilament end | koff | 0.054 ± 0.013 s−1 |
MCAK Is a Depolymerase
To measure the kinetic parameters associated with MCAK-mediated depolymerization, we used turbidity, the absorbance at 350 nm, to assay the amount of polymerized tubulin. Because MTs scatter light much more strongly than free tubulin dimers, the turbidity of a solution is expected to be proportional to the amount of polymer and independent of the length of the polymers, provided that their lengths are >> λ/2π = 56 nm (λ is the wavelength of the light) (Berne, 1974). We confirmed that >95% of the MTs used in these experiments were longer than 600 nm before addition of MCAK by sedimenting the MTs and measuring their length distribution using fluorescence microscopy (Figure 1D, inset).
When MCAK was added to a solution containing MTs and ATP, the turbidity decreased approximately exponentially over 10 min (Figure 1C). A control showed that there was little decrease in turbidity in the absence of MCAK (Figure 1C). Addition of CaCl2, which is known to depolymerize MTs (O’Brien et al., 1997; Muller-Reichert et al., 1998), did not lead to a further decrease in turbidity in the MCAK trace, even though it rapidly decreased the turbidity in the control trace (Figure 1C). Finally, a spindown assay confirmed that the total amount of tubulin polymer decreased in proportion to the turbidity signal (Figure 1D). These observations establish the validity of the turbidity assay and allow us to draw an important conclusion: MCAK acts catalytically. A single molecule of MCAK can remove as many as 150 tubulin dimers from the ends of MTs (300 nM polymerized tubulin is depolymerized by 2 nM MCAK). Thus, MCAK is a depolymerase.
MCAK Has a High Affinity for Microtubule Ends
We used the turbidity assay to determine how much MCAK is needed to depolymerize MTs at the maximum rate. When increasing amounts of MCAK were added to a fixed concentration of MTs, the rate of depolymerization increased (Figure 2A), and at MCAK concentrations of ≥ 2 nM, depolymerization was complete within 600 s. To analyze these results, we plotted the initial rate of depolymerization against the MCAK concentration (Figure 2B). The initial rate was used to minimize the contribution from any possible repolymerization of tubulin dimers released during the reaction and also to minimize the effect of the turbidity artifact that occurs after 1000 s (Figure 1C). Because the concentration of MTs was known from the spindown assay, the initial rate of polymer loss could be expressed as the average shrinkage rate of individual MTs.
Figure 2. Kinetics of MCAK-Mediated Microtubule Depolymerization.
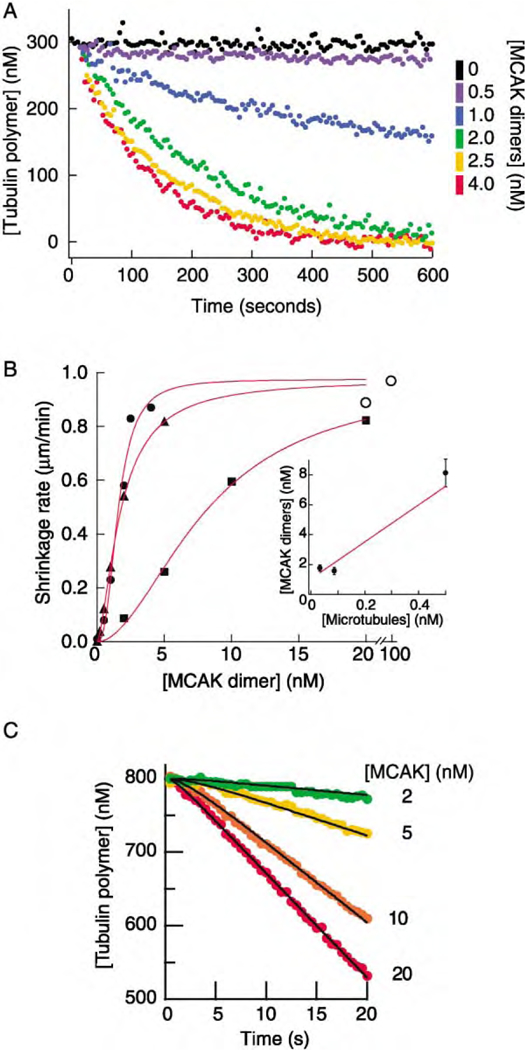
(A) Turbidity traces show the loss of 300 nM GMP-CPP-tubulin polymer (0.086 nM MTs) over time in the presence of various amounts of MCAK.
(B) Initial rates of depolymerization measured by turbidity or light scattering as a function of MCAK concentration at three different MT concentrations (▲, 0.033 nM; ●, 0.086 nM from the data in [A]; and ■, 0.50 nM). The solid curves correspond to the Hill equation where Vmax is the maximum value, KM is the x value at which a half-maximum value is obtained, and n is the Hill coefficient (n = 1.6,▲; 2.6,●; 1.9,■). The open circles (○) correspond to the depolymerization rate measured in the microscopy assay (MT concentration ~0.01 nM). The inset graph shows the MCAK concentration required for a half-maximal depolymerization rate plotted against the MT number concentration. The line is the fit to Equation 2 and corresponds to there being 24 binding sites per MT, K =1 nM.
(C) The initial rate of depolymerization measured by stopped flow. MCAK (at various concentrations) and MTs (800 nM GMP-CPP-tubulin polymer) were rapidly mixed, and the amount of polymer was assayed by the intensity of scattered light. The black curves correspond to the processive model (see the supplemental data at http://www.molecule.org/cgi/content/full/11/2/445/DC1) with parameters kon = 0.05 nM−1·s−1, koff 0.05 s−1, K = 1 nM, k′2 = 1 s−1 with cooperativity (Hill coefficient of 2).
The initial rate of depolymerization depended on the MCAK concentration according to a sigmoidal curve. At low concentrations, the depolymerization rate increased approximately with the square of the MCAK concentration (Hill coefficient = 1.6, 1.9, and 2.6 for the three curves shown in Figure 2B). This indicates that there may be some cooperativity; for example, a few MCAKs per end may be required before any significant depolymerization occurs. At high MCAK concentrations, depolymerization increased to an extrapolated maximum shrinkage rate of 0.95 ± 0.10 µm/min per MT, which corresponds to 28 tubulin dimers per second per MT. This is in close agreement with the depolymerization rate measured in the microscopy assay (Figure 1B).
The data shown in Figure 2A accord with the expectation that MCAK has its depolymerase activity at the ends of MTs, rather than on the lattice. If MCAK acted on the MT lattice then we would expect the depolymerization rate to saturate when the lattice tubulin was saturated, which would require 300 nM MCAK. Instead, depolymerization saturates at 4 nM MCAK. Furthermore, the half-maximal rate of depolymerization occurred at 1.6 ± 0.2 nM MCAK, indicating that MCAK must have a high affinity for MT ends.
MCAK Has One High-Affinity Binding Site per Protofilament End
To estimate the number of MCAK binding sites per MT end and the binding affinity, we considered a model in which MCAK [M] binds to sites at the ends of MTs [P] where they form catalytically active complexes [MP] that remove tubulin dimers [Tb] from the end with a rate constant kcat. We write
| (1) |
kon is the second order on-rate constant for association of MCAK to the binding sites; MCAK could target the site directly from aqueous solution or indirectly via the MT lattice. koff is the off-rate constant for dissociation of MCAK from the binding site; MCAK could leave on its own or in a complex with a tubulin dimer. The constant K corresponds to the concentration of binding sites necessary for half-maximum MCAK binding (and thus half-maximal depolymerase activity). If MCAK were in thermodynamic equilibrium with its binding sites, then kon and koff would correspond to a reversible reaction and K would be the dissociation constant (according to the definition in Smith, 1997). However, the reaction need not be in equilibrium because MCAK could be in a different state when it associates with its binding site than when it dissociates. For example, MCAK could dissociate from the MT in a complex with a tubulin dimer or it could change its nucleotide state after binding to the MT. In what follows, and in the supplemental data at http://www.molecule.org/cgi/content/full/11/2/445/DC1 where the model is solved, we assume only that the association-dissociation reaction is at steady state (i.e., that the fraction of free and bound MCAKs does not change with time).
According to the model, the half-maximal depolymerization rate occurs when the total concentration of MCAK (free and bound) is
| (2) |
(see the supplemental data at http://www.molecule.org/cgi/content/full/11/2/445/DC1). P0 is the total number of binding sites (free and occupied), [Mt] is the MT concentration, and N is the number of MCAK binding sites per MT. This equation makes intuitive sense. If the affinity is very high (K ~ 0), then the half-maximal rate occurs when there is enough MCAK to fill half the sites. Conversely, if the affinity is very low (K >> P0), then the half-maximal depolymerization rate occurs when the MCAK concentration is equal to the constant K.
Depolymerization data were obtained at two other MT concentrations: 0.033 and 0.50 nM (Figure 2B). The half-maximum depolymerization rates occurred at 1.8 ± 0.2 nM and 8.1 ± 0.9 nM MCAK, respectively. Fitting Equation 2 to a plot of the MCAK concentration required for half-maximal depolymerization versus the MT concentration (Figure 2B, inset) gave a correlation coefficient of r = 0.93 when the data were weighted by their uncertainties and yielded K = 1.0 ± 0.2 nM and N = 24 ± 4. The latter number corresponds to 12 ± 2 binding sites per MT end. Because the MTs used in this study have 14 protofilaments, the number of binding sites corresponds to approximately one MCAK per protofilament end (12 ÷ 14). Assuming one MCAK per protofilament end, the maximum catalytic activity of MCAK, kcat, the maximum rate at which one MCAK dimer can remove one tubulin dimer from the end of a MT, is 1 s−1 (= 28 tubulin dimers per MT per second ÷ 28 protofilament ends per MT; Table 1). The low level of cooperativity—as few as two MCAKs at an end are sufficient for depolymerization—indicates that MCAK can probably switch between protofilaments.
From this analysis, we also conclude that the affinity of MCAK for the tubulin dimers in the lattice must be very low. If MCAK had even a modest affinity for the surface of a MT, then the lattice would act as a sink because the tubulin dimers in the lattice outnumber those at the ends ~ 100:1. Thus the dissociation constant for tubulin in the lattice must be ≥ 100 nM (100 × 1 nM).
MCAK Finds Microtubule Ends Very Rapidly
To measure how quickly MCAK targets MT ends, we used a stopped flow apparatus to measure the association rate constant kon. If the total MCAK concentration (M0)is in excess of the binding constant (i.e., K ) and the total concentration of binding sites (P0) then the delay, ∆t, between the addition of MCAK and the attainment of the steady-state depolymerization rate is
| (3) |
(see the supplemental data at http://www.molecule.org/cgi/content/full/11/2/445/DC1). To measure the delay, MCAK and ATP in one syringe were rapidly mixed with MTs in the other, and the depolymerization was monitored by the intensity of light scattered 90° in the mixing chamber. The onset of depolymerization is very rapid, with delays of only a few seconds at the highest MCAK concentration (Figure 2C). The delay was measured by extrapolating back the steady-state depolymerization to where it intercepts the initial polymer concentration. Six measurements of the delay at MCAK concentrations ≥5 nM obtained in three independent experiments gave a second order association rate of MCAK binding to protofilament ends of kon = 54 ± 9 × 10⁶ M−1·s−1 (mean ± SE).
The Catalytic Activity of MCAK Requires ATP Hydrolysis
The experiments described so far were all performed in the presence of ATP. However, the hydrolysis of ATP is not required for MCAK to disassemble GMP-CPP-stabilized MTs. When 315 nM tubulin polymer was mixed with 150 nM MCAK in the presence of 2.5 mM of the nonhydrolyzable ATP analog AMP-PNP, there was 60%disassembly after 10 min and 70% disassembly after 50 min. Given that in the absence of MCAK, GMP-CPP MTs depolymerize <10% after 10 min (Figure 2A), we can positively conclude that MCAK accelerates depolymerization, as opposed to inhibiting polymerization. This confirms the finding of Moores et al. (2002) showing that the motor domain of the Kin I from P. falciparum can disassemble taxol-stabilized MTs in the presence of AMP-PNP.
ATP hydrolysis, however, is necessary for catalytic depolymerization. When 315 nM tubulin polymer was mixed with 25 nM MCAK in the absence of ATP, there was < 10% disassembly after 10 min, as measured by the spindown assay. By contrast, 20 nM MCAK was sufficient to completely depolymerize 800 nM GMP-CPP-tubulin polymer within 1 min in the presence of 2 mM ATP as determined by turbidity assays (data not shown).
MCAK Has a Microtubule-Stimulated ATPase Activity
Given that ATP hydrolysis is necessary for MCAK’s enzyme activity, we measured the rate at which MCAK hydrolyzes ATP to its products ADP and inorganic phosphate (Pi). Following the addition of 2 nM MCAK to 300 nM of GMP-CPP-tubulin polymer in 250 µM ATP, we observed a fast initial rate of Pi release (~6 nM·s−1)of duration ~ 1000 s, followed a slower steady-state rate of Pi release (~0.13 nM·s−1) (Figure 3A). The time course of the initial phase closely matched the time course of depolymerization (Figure 3B); when appropriately scaled, the amount of phosphate released from ATP (large squares) could be superimposed on the amount of tubulin released from MTs. A spindown assay confirmed that depolymerization was >90% complete after 600 s and 99% complete after 3000 s. Because the initial phase depended on there being MTs present, we believe that it corresponds to MT-stimulated ATPase activity. This is further supported by the observation that when the concentration of polymerized tubulin was increased, the ATPase rate also increased (Figure 3C).
Figure 3. ATPase Activity of MCAK.
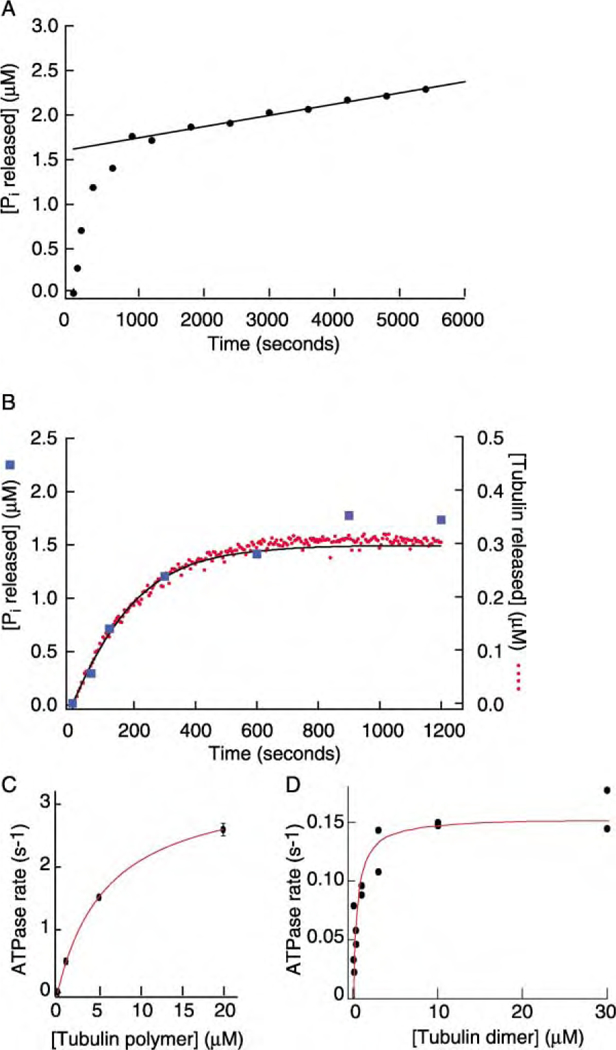
(A) The time course of Pi release from ATP following the addition of 2 nM MCAK to 300 nM GMP-CPP-tubulin polymer. The solid line is a fit to the slower phase of phosphate release and corresponds to 0.06 Pi per second per MCAK. We attribute this slow phase to stimulation of the ATPase by free tubulin.
(B) The initial phase of Pi release (squares, data from A) has the same time course as the release of tubulin dimers from MTs (circles). Both are fit well by a model in which the MTs shrink at a rate of 0.5 µm/min (solid line) appropriate for 2 nM MCAK. Superimposition of the Pi and tubulin curves requires 5 Pi released per tubulin dimer released.
(C) The initial ATPase rate (the initial slope of the Pi release curve divided by the MCAK concentration, 20 nM) as a function of the polymerized tubulin concentration. The solid curve is the Michaelis-Menten equation with a maximum ATPase rate of 3.4 s−1 and a half-maximum rate occurring at 7 µM tubulin.
(D) The ATPase rate of MCAK as a function of unpolymerized GDP-tubulin. The solid curve is the Michaelis-Menten equation with a maximum ATPase rate of 0.15 s−1 and a half-maximum rate occurring at 0.49 µM tubulin.
MCAK Has an ATPase Activity that Is Stimulated by Free Tubulin Dimers
We propose that the second, slower phase of Pi release seen in Figure 3A is due to an ATPase activity stimulated by free tubulin dimers. This is based on the following observations. (1) There are no MTs present during the slow phase, so the ATPase cannot be due to lattice or ends. (2) The slow phase is not due to MCAK’s basal ATPase activity. In the absence of any tubulin, the ATP-ase is 0.014 0.003 s1 per MCAK (mean SE, n 2), too low to account for the slow phase (Figure 3A). (3) In the presence of 300 nM GMP-CPP tubulin (maintained as free dimer by the addition of 5 mM CaCl2) and 25 nM MCAK, the ATPase rate was 0.052 ± 0.004 s−1 per MCAK (mean ± SE, n = 2), similar to the slow phase of the ATPase seen in depolymerization reactions after the loss of 300 nM GMP-CPP polymer was complete (0.06 s−1 per MCAK, Figure 3A). (4) We measured the ATPase rate of MCAK over a wide range of GDP-tubulin concentrations (Figure 3D). The maximum GDP-tubulin-stimulated ATPase rate was 0.15 ± 0.01 s−1 per MCAK, with a half-maximum ATPase at 490 ± 150 nM tubulin. The ATPase at 300 nM GDP-tubulin (0.056 s−1 per MCAK) was similar to that observed during the slow phase (Figure 3A).
These results (Table 2) show that MCAK has an ATPase activity that is stimulated by free tubulin. This is another property that distinguishes Kin I kinesins from other members of the kinesin family. Interestingly, the tubulin-activated ATPase does not depend on whether the tubulin dimer has GDP or GMP-CPP in its active site (compare [3] and [4]).
Table 2.
ATPase Activities of MCAK
| Condition | Maximum ATPase (s−1 per dimer) | KM |
|---|---|---|
| Basal (no tubulin) | 0.014 ± 0.003 | NA |
| Tubulin dimmer | 0.15 ± 0.01 | 490 ± 150 nM |
| MT-stimulateda | 5 ± 1.5 | NA |
| End-stimulatedb | 4 ± 1.5 | 1 ± 0.2 nM |
| Lattice-stimulated | 1 | >100 nM |
Temperature 23 ± 1 °C. NA, not applicable.
The value for the ATPase is based on a stoichiometry of 5 ± 1 ATP hydrolyzed/tubulin dimer released and a maximum rate of tubulin dissociation of 1.0 ± 0.2 s−1.
Subtracting the lattice-stimulated value from the MT-stimulated one. The value for the KM assumes that the same site that stimulates depolymerization also stimulates the ATPase.
MCAK Has an End-Stimulated ATPase Activity
The ATPase activity of MCAK could be stimulated by the MT lattice or it could be stimulated by the MT ends. Or it could be stimulated by both. In order to distinguish between these possibilities, we did two additional sets of experiments.
First, we measured the ATPase rates at various MCAK concentrations but at a fixed tubulin polymer concentration. If the ATPase is stimulated by MT ends, then the specific ATPase activity (ATPase rate per MCAK) should fall when the MCAK concentration exceeds the concentration of end binding sites. If the ATPase is stimulated by the MT lattice, then the specific ATPase activity should increase until the MCAK concentration exceeds the concentration of lattice tubulin.
We found that as the MCAK concentration was in-creased, both the initial and steady-state rates of Pi release increased (Figure 4A). However, the MT-stimulated ATPase rate (the initial rate of Pi release divided by the MCAK concentration) had a maximum of ~3s−1 per MCAK at ~3 nM MCAK and then decreased to ~1 s−1 per MCAK at higher MCAK concentrations (Figure 4B). We interpret the ATPase rate at the higher MCAK concentrations as being due to a small lattice-stimulated ATPase (see below). However, the peak at ~3 nM MCAK cannot be accounted for by a lattice-stimulated ATPase because it occurs at an MCAK concentration that is much less than the concentration of lattice tubulin (300 nM). Instead, we attribute this predominant component of the ATPase to an end-stimulated activity. Because the peak occurs at an MCAK concentration similar to that of protofilament ends (2.4 nM = MT concentration × 14 protofilaments per MT × 2 ends per protofilament), the end-stimulated ATPase is consistent with there being one high-affinity binding site per protofilament end which, when filled with MCAK, has the ATPase activity.
Figure 4. The Predominant ATPase Activity of MCAK Is Stimulated by Microtubule Ends.
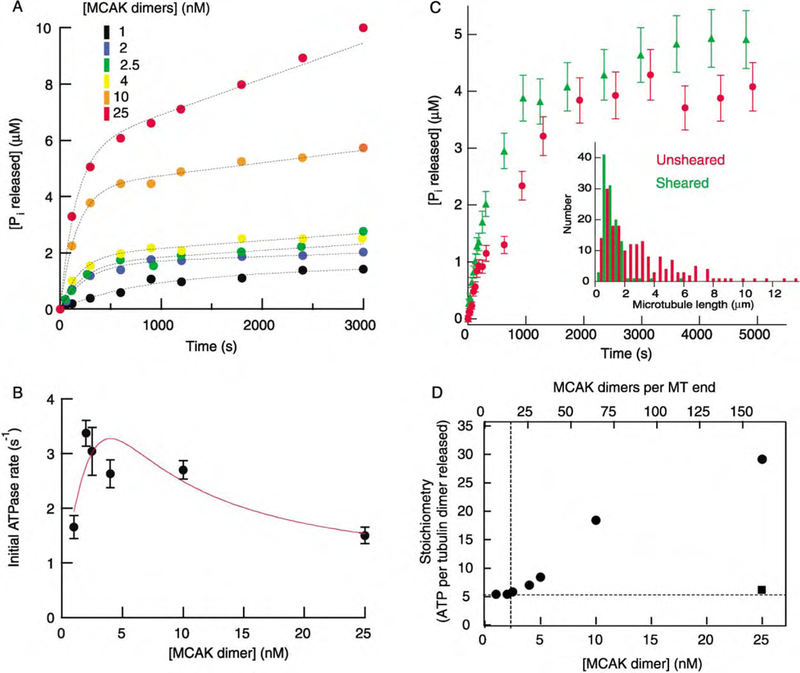
(A) Time course of Pi release in reactions with 300 nM GMP-CPP-tubulin polymer (0.086 nM MTs) at various MCAK concentrations. The curves (dotted lines) correspond to a model in which the Pi rise is due to the sum of a MT-stimulated ATPase (which decays as the MTs depolymerize) and a tubulin-stimulated ATPase (which rises and then plateaus as the tubulin is released).
(B) The initial rate of Pi release as a function of MCAK concentration. The data are fit to a model in which there are 3 nM of high-affinity binding sites (K = 1 nM), which hydrolyze ATP at a rate of 8 s−1, and a low-affinity binding site with a hydrolysis rate of 0.7 s−1. The high-affinity binding has a Hill coefficient of 2, indicating cooperativity.
(C) End-stimulated ATPase activity. A comparison of initial ATPase rates during depolymerization of unsheared (red circles) versus sheared (green triangles) GMP-CPP MTs. Both reactions contained 630 nM tubulin polymer and 2.5 nM MCAK. EM analysis of MT lengths before and after shearing (inset) showed that shearing decreased the average lengths of the MTs from 3.1 to 1.2 µm.
(D) Stoichiometry of ATP hydrolyzed per tubulin dimer released as a function of MCAK concentration. The stoichiometry was a minimum of approximately five when the number of MCAKs per MT end was ≤15 MCAK dimers (dashed lines). Reactions contained 300 nM GMP-CPP-tubulin polymer and were performed in BRB80 supplemented with 75 mM KCl, except for the reaction at 25 nM MCAK (square) which was supplemented with 150 mM KCl.
In the second experiment, we increased the concentration of MT ends, without changing the total concentration of tubulin polymer, by shearing the MT solution. If MCAK has an end-stimulated ATPase, the sheared MTs should lead to a higher ATPase rate than the un-sheared MTs. The result accorded with this expectation (Figure 4C). In the presence of unsheared GMP-CPP MTs, the initial hydrolysis rate was 1.38 ± 0.18 s−1 (mean SE, n 4) per MCAK; after shearing, the initial rate increased to 2.92 ± 0.22 s−1 (mean ± SE, n = 4) per MCAK. Electron microscopy showed that shearing increased the concentration of MT ends approximately 3-fold from 0.22 nM to 0.65 nM (Figure 4C, inset). The ~ 2-fold increase in the ATPase is somewhat larger than expected given the MCAK concentration was 2.5 nM; if K = 1 nM for the high-affinity sites, then a 43% increase is expected. However, we do not consider this as being an important discrepancy because the exact time course of the hydrolysis curve depends on the length distribution of MTs which is different for the unsheared and sheared solutions. Furthermore, shearing may create more ragged ends that contain more MCAK binding sites.
Together, these experiments show that MCAK has an end-stimulated ATPase activity. However, they do not exclude a lattice-stimulated activity.
MCAK Hydrolyzes Multiple ATPs for Each Tubulin Dimer Removed from the Polymer
Surprisingly, we found that MCAK hydrolyzes ~5 ATP for each tubulin dimer that it removes from a GMP-CPP MT. A stoichiometry of five is evident from the scaling in Figure 3B that was necessary to superimpose the Pi and tubulin dimer release curves. It can also be obtained by dividing the initial rate of phosphate release (during which time there is little tubulin released and therefore little dimer-activated ATPase) by the initial rate of tubulin release: 6 nM·s−1 divided by 1.2 nM·s−1 equals 5 ATP hydrolyzed per tubulin dimer released (Figure 3B). The stoichiometry can also be estimated by simply dividing the total number of Pi released (during the depolymerization phase) by the total number of tubulin dimers removed. Because the latter estimate is independent of the MCAK concentration, the stoichiometry is a robust measurement.
The requirement of five ATPs to remove one tubulin dimer was not expected. To make sure that this high stoichiometry was not due to the particular conditions used in Figure 3A, we measured the amount of ATP hydrolyzed during the depolymerization of a fixed amount of GMP-CPP-tubulin polymer over a wide range of MCAK concentrations (Figure 4D). Quantitative spin-downs performed during steady-state hydrolysis confirmed that depolymerization was complete in all reactions (≤5% polymer remaining after 3000 s) except at the lowest MCAK concentration (at 1 nM, 25% of the polymer remained at 3000 s). At the highest concentration of MCAK tested (25 nM), the stoichiometry during the depolymerization phase was 30 ATP hydrolyzed per tubulin dimer removed (Figure 4D). However, at lower MCAK concentrations the stoichiometry remained constant at five (Figure 4D).
The stoichiometry of five is not due to additional rounds of ATP hydrolysis associated with removing GMP-CPP dimers that reassociated with the MTs after their initial removal. When such reassociation was blocked by adding 20 µM GDP, a condition in which polymerization is strongly inhibited because GDP displaces GMP-CPP from the free dimer (Caplow et al., 1994), a high stoichiometry was still observed (data not shown).
Combining the maximum tubulin dimer dissociation rate of 1 s−1 per MCAK with the stoichiometry of five ATPs hydrolyzed per tubulin removed, we deduce a maximum GMP-CPP-MT stimulated ATPase rate of 5 s−1 per MCAK (Table 2). This is similar to the maximum ATPase rate of 3.4 s−1 estimated from the data in Figure 3C. Because the former estimate of the maximum ATPase rate is independent of the MCAK concentration, the agreement with the latter estimate confirms that the MCAK concentration was correctly measured.
Effect of Ionic Strength on the ATPase and Depolymerase Activities of MCAK
In addition to an end-stimulated ATPase activity, MCAK has an additional MT-stimulated ATPase that we attribute to stimulation by the MT lattice. This ATPase is observed when the MCAK concentration is in excess of the concentration of end binding sites (Figures 4A and 4B). When the lattice-stimulated ATPase is high, the stoichiometry is high (>>5) showing that this ATPase is not tightly coupled to depolymerization (Figure 4D). The lattice-stimulated ATPase rate can be estimated from the data in Figures 4A and 4B; at 25 nM MCAK the ATPase rate is 1.5 s−1 and if the component due to the end-stimulated ATPase is subtracted, we obtain a value of1s−1 per MCAK for the lattice-stimulated ATPase.
Adding salt decreased the lattice-stimulated ATPase. In buffer that is optimal for depolymerase activity (BRB80 plus 75 mM KCl), 25 nM MCAK has a large lattice-stimulated ATPase (Figure 4A) and the stoichiometry is equal to 30 (Figure 4D). However, when the salt was increased (BRB80 plus 150 mM KCl), the amplitude of the initial phase of phosphate release decreased to a level that was indistinguishable from the corresponding curve measured at 2.5 nM MCAK. As a consequence, the stoichiometry decreased from 30 to 6 (Figure 4D) indicating that the additional 75 mM KCl almost completely abolished the lattice-stimulated ATPase. Conversely, decreasing the amount of added salt (BRB80 plus 6 mM KCl) increased the lattice-stimulated ATPase even further, and a stoichiometry of 60 was obtained (data not shown). Very high levels of added salt (BRB80 plus 225 mM KCl) inhibited both the ATPase and the rate of depolymerization (data not shown).
Interaction of MCAK with the Microtubule Lattice
The effects of salt suggested that MCAK interacts electrostatically with the MT lattice and that this interaction modulates both the ATPase and depolymerase activities. We therefore looked for a direct interaction of MCAK with the MT lattice in motility assays. We found that MTs bound to MCAK-coated surfaces in the presence of ATP and underwent a small back-and-forth motion without apparent directionality (Figure 5A). The mean-square displacement increased in proportion to time, consistent with the movement being due to a randomly directed process (Figure 5B). This type of motion has been observed for flagellar dynein (Vale et al., 1989) and for the kinesin-related proteins Ncd (Chandra et al., 1993) and KIF1A (Okada and Hirokawa, 1999), and has been called one-dimensional diffusion. It is one-dimensional in the sense that the diffusion coefficient along the axis of the MT (D||) is larger than the diffusion coefficient perpendicular to the axis (D⊥); the MT in Figure 5B had D|| = 7000 nm2 s−1 and D⊥ = 20 nm2 ·s−1. The axial diffusion coefficient corresponds to a step between tubulin dimers every ~5ms (= (8 nm)2 /2D ). Note that if a MT were constrained to diffuse in a plane parallel to a surface the axial diffusion coefficient would only be twice the orthogonal diffusion coefficient (Howard, 2001). The finding that the ratio D||/D⊥ > 2 indicates that MCAK constrains the perpendicular motion more than the parallel motion. One-dimensional diffusion was also seen in the presence of ADP but never in the absence of nucleotides.
Figure 5. MCAK Supports One-Dimensional Diffusion of Microtubules in Microscopy Assays.
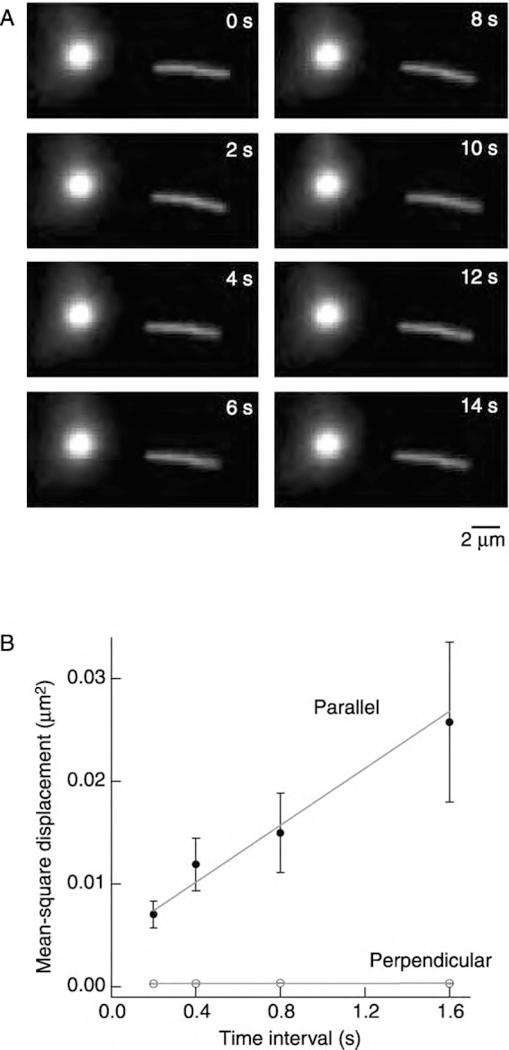
(A) Sequential images of a MT showing back-and-forth movement relative to a fixed spot on the surface (bright circle).
(B) The distances that a MT moved in successive time intervals were squared and averaged to give the mean-square displacement. The measurement was repeated for four different time intervals. Unlabeled MCAK in BRB80 with 1 mM ATP (no added salt).
Discussion
Kin I Kinesins Have One High-Affinity Binding Site per Protofilament End
Earlier work in vitro using fluorescence microscopy showed that Kin I kinesins bind to the ends of MTs in AMP-PNP (Desai et al., 1999; our unpublished data). The present work extends these observations by measuring the affinity and the number of binding sites per MT end in ATP. The saturation of the depolymerization rate indicates that the binding sites are high-affinity ones (K = 1 nM in ATP) and that there are approximately 28 per MT. The ATPase measurements provide additional support for this number of MCAK binding sites per MT; the ATPase rate peaks when there is ~1 MCAK per protofilament end (Figure 4B), and there is a constant ratio of ATPs hydrolyzed per tubulin released provided that the MCAK concentration does not exceed the concentration of protofilament ends (Figure 4D). If the MCAK binding sites are evenly distributed between the two ends of the MTs and between the protofilaments, then there is one binding site at the end of each protofilament. We propose that this site, when filled by MCAK, has both the depolymerase and ATPase activities.
At physiological MCAK concentrations (10–100 nM >> 1 nM; L.W., unpublished data), the binding sites will be occupied, and each MT end is expected to have a complex of 12–14 MCAK dimers at its end (depending on the number of protofilaments). The failure to detect MCAK at the ends of cytoplasmic MTs (Wordeman and Mitchison, 1995) might be explained by the lack of sensitivity of conventional fluorescence microscopy. On the other hand, MCAK has been localized to the spindle poles and the midbodies in mitotic cells (Maney et al., 1998), both of which contain high densities of MT ends.
Evidence that MCAK Is a Processive Enzyme
Knowledge of the on-rate (kon = 0.054 nM−1·s−1 measured by stopped flow) and the affinity (K = 1 nM measured from the half-saturation of the depolymerization rate) allows us to estimate the off-rate, koff, of MCAK from the protofilament end using Equation 1. This yields koff = 0.054 ± 0.013 s−1 (the 95% confidence range is 0.027 to 0.10 s−1, when the errors are propagated multiplicatively). Because the MCAK off-rate is one nineteenth the tubulin dimer off-rate from the protofilament end (1 s−1), we can rule out the possibility that MCAK dissociates from the ends of the MT each time it removes a tubulin dimer. Instead, MCAK removes on average 20 dimers before it dissociates from an end (≥ 10 dimers at the 97.5% confidence level). This implies that MCAK is processive like conventional kinesin (Howard et al., 1989).
Under physiological conditions, MTs can shorten at rates up to 20 μm/min, much faster than the rates reported here. But such rapid shortening is thought to be triggered by loss of a stable cap of GTP-tubulin dimers, which exposes the underlying unstable GDP-tubulin dimers (Mitchison and Kirschner, 1984; Walker et al., 1988). Because MCAK can depolymerize a 1 μm long GMP-CPP MT (analogous to a GTP cap) in 1 min, MCAK’s depolymerase activity is high enough to account for the measured rates of catastrophe in cells (1–2 min−1; Tournebize et al., 2000; Kinoshita et al., 2001). Furthermore, the high association rate of MCAK to protofilament ends (Table 1) ensures that MCAK will reach the cap quickly, within 0.2 to 2 s given the measured on-rate and assuming a cellular MCAK concentration of 10 to 100 nM.
Assuming an off-rate of 0.05 s−1, MCAK is expected to remain bound to the end of a MT during the depolymerization of a GTP cap up to 160 nm in length. The size of the GTP cap is not known; it is no larger than 1 μm (Walker et al., 1991) and could be as small as one layer of GTP-tubulin dimers (Caplow and Shanks, 1996; Drechsel and Kirschner, 1994). A shorter cap will take less time to depolymerize, and if the GTP cap of a dynamic MT is only one or two dimers long, then it is not clear what advantage there is to MCAK being processive because, after uncapping a dynamic MT, MCAK may be released from the end as the MT transits to rapid shortening. However, it is possible that the high-affinity interaction that manifests itself in our experiments as processivity may serve a different function in cells. The attachment of MCAK to the centromere is mediated via nonmotor domains (Maney et al., 1998). Assuming that the binding of MCAK to protofilament ends is mediated by the motor domain, then the point of the multiple, high-affinity interactions between the MCAK complex and the MT end may be to create a link to the kinetochore that is both dynamic and robust; i.e., the connection remains intact even when tubulin dimers dissociate from the end and when the whole structure is under tension (Nicklas, 1988; Coue et al., 1991). One interpretation of the similarity of the MCAK-mediated rate of depolymerization to the rate of chromosome movement during anaphase A (Skibbens et al., 1993) is that the MCAK complex is regulating the MT shortening speed.
Rapid Targeting of MCAK to Microtubule Ends
The targeting of MCAK to the ends of MTs is extraordi-narily rapid. The on-rate to protofilament ends, 54 × 106 M−1·s−1, far exceeds the fastest protein-protein interactions. It is 20 times the on-rate for kinesin to the MT lattice (Hackney, 1995), and it corresponds to an on-rate of 760 × 106 M−1·s−1 for MCAK binding to MT ends, over 100 times the rate at which tubulin dimers bind to MT ends during polymerization (2 to 5 × 10⁶ M−1·s−11, Drechsel et al., 1992; Caplow et al., 1994). This argues strongly against a targeting mechanism based solely on the direct diffusion of MCAK to MT ends. How, then, does MCAK reach the ends so quickly?
One obvious possibility is that MCAK finds the ends of MTs by walking along the lattice. However, our ATPase measurements provide positive evidence against MCAK being a motor protein in the traditional sense. MCAK must move an average distance of 1 m from its initial binding site on the lattice to get to the end of a 2 m long MT. If translocation occurred via directed motility, then MCAK would have to take 125 eight nanometer steps to reach the end of the MT, and if MCAK were like kinesin, which uses one ATP per step (Coy et al., 1999), this would cost 125 ATPs. While at the end, MCAK removes some 20 tubulin dimers before dissociating. If the coupling of hydrolysis to tubulin removal was 1:1, then a further 20 ATP would be consumed. The total cost would be 145 ATPs for 20 tubulin dimers or seven ATPs per tubulin dimer removed. Because the maximum dimer off-rate is 1 s−1, the maximum ATPase rate would be ~7s−1 (assuming that it takes only a few seconds for the MCAK to motor to the end of the MT). This calculation shows that the stoichiometry and the ATP rate are not inconsistent with motor activity. Instead, it is the shearing experiment that provides the strong argument against MCAK being a motor. After shearing, the MTs are shorter and therefore it should take less, not more, ATP for a motor to reach the end. If MCAK were a motor, we would expect a 2.5-fold decrease in the total ATP hydrolyzed when the MTs are reduced in length from 3 to 1 μm; instead, the total Pi released increases (Figure 4C).
MCAK May Target Microtubule Ends by Diffusion along the Microtubule Lattice
We propose that MCAK rapidly targets MT ends by using a two-stage mechanism: first MCAK binds to the MT lattice, and then it diffuses along the lattice before being captured at a protofilament end (Figure 6A). This proposal is based on three lines of evidence. (1) Direct microscopic observations show that MTs undergo one-dimensional diffusion on surfaces coated with MCAK. (2) MCAK has a weak electrostatic interaction with the MT lattice as evidenced by the salt-dependent lattice-stimulated ATPase. (3) Kin I kinesins interact with the glutamate-rich C-terminal region of tubulin known as the E-hook (Moores et al., 2002; Niederstrasser et al., 2002), perhaps via a positively charged domain near the motor domain (Ovechkina et al., 2002). A further argument in favor of a diffusional mechanism is that, because diffusion is not a directed process, it is equally effective in targeting the molecule to either end of the MT. Such a targeting mechanism is analogous to that used by some transcription factors (Berg et al., 1981) and restriction enzymes (Stanford et al., 2000) to find their target sites on DNA, in which case the diffusive interaction occurs via a weak electrostatic interaction between the protein and the filament (Spolar and Record, 1994).
Figure 6. A Model for the Depolymerase Mechanism of Kin I Kinesins.
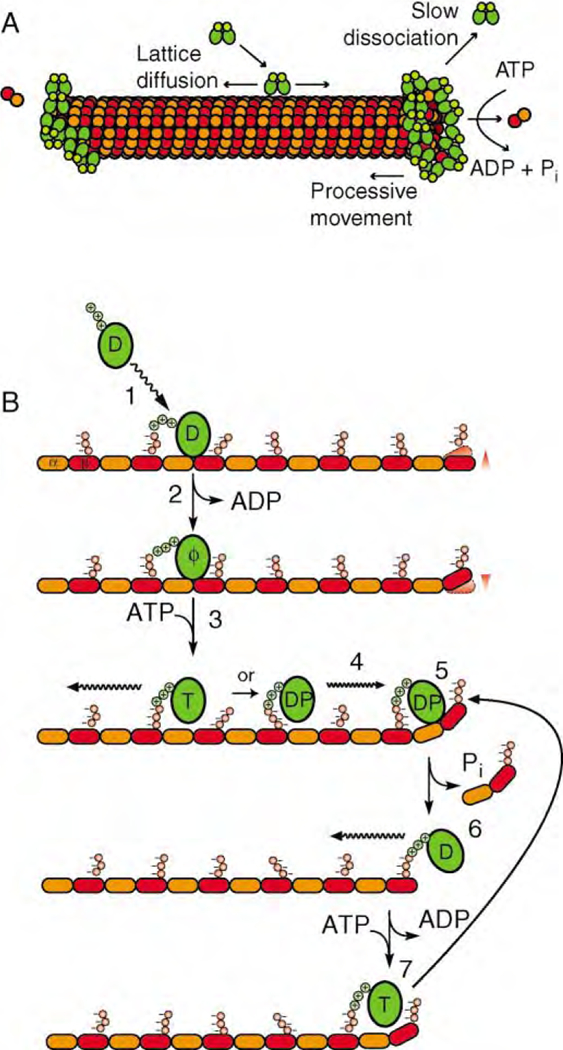
(A) Model for MCAK interaction with the MT lattice and ends.
(B) Postulated crossbridge cycle in which MCAK is represented as a single motor domain and the MT is represented as a single protofilament. MCAK in the ADP state diffuses in solution and binds to the MT lattice (1). Upon binding to the MT, MCAK releases its ADP (2). In the no nucleotide state, MCAK binds tightly to the MT lattice. ATP binding loosens the association of MCAK with the lattice (3), but the motor remains tethered through an electrostatic interaction. MCAK in the ATP or ADP-Pi state diffuses along the surface of the MT (4) until it reaches a terminal tubulin dimer at either the plus or minus end of the MT (5). Unlike tubulin constrained in the lattice, terminal tubulin dimers are likely to undergo thermal fluctuations (arrowheads). When MCAK reaches an end it captures and stabilizes a terminal tubulin dimer in a bent conformation similar to GDP-tubulin. The ADP-Pi state weakens the association of the terminal tubulin dimer to the protofilament end (5), causing tubulin and Pi release (6). ADP-MCAK remains bound to the MT and commences another cycle of hydrolysis and tubulin release (7).
The diffusion coefficient of 7000 nm2 s−1 measured in Figure 5 can quantitatively account for the high on-rate. If MCAK remains weakly bound to the lattice for 1 s during a diffusive encounter with the MT, then it will cover an area of ~2800 nm2 (assuming that MCAK can switch protofilaments), and so will visit ~70 tubulin dimers. This significantly increases the probability of finding a protofilament end. The acceleration of the targeting rate would be even greater if the single-molecule diffusion coefficient is greater than 7000 nm2 ·s−1, which is likely because the MT in Figure 5 was held by several MCAK molecules.
The diffusive movement of MCAK between tubulin dimers on the MT lattice cannot be coupled to ATP hydrolysis. If it were, the ATPase rate would be much higher than observed because, on average, MCAK samples a new tubulin dimer every few milliseconds and this would lead to an ATPase rate of >100 s−1. Instead, the small lattice-activated ATPase rate of 1 s−1 may be linked to the dissociation of MCAK from the lattice which terminates the diffusive encounter.
A corollary of our lattice-diffusion model is that anything that impedes the interaction of MCAK with the MT will decrease the affinity of MCAK for ends and will therefore inhibit MCAK depolymerase activity. This could explain the inhibition of depolymerization by high salt; if salt disrupts the electrostatic interaction between the motor and the lattice, it will reduce the time that MCAK spends in the diffusive stage and therefore lower the rate of end targeting. Likewise, if the E-hook of tubulin is necessary to maintain contact between MCAK and the MT lattice during diffusion, then its removal by proteolysis would inhibit end targeting and lead to inhibition of depolymerization (Moores et al., 2002; Niederstrasser et al., 2002).
Where Is the ATP Hydrolyzed?
Desai et al. (1999) proposed that ATP binds to a Kin I kinesin when it is at the end of the MT but that the actual hydrolysis and completion of the cycle takes place in solution after the Kin I-tubulin dimer complex has dissociated from the MT. However, the following observations indicate that the hydrolysis actually takes place at MT ends. First, MCAK dissociates from the ends of MTs at a rate of 0.05 s−1. Because this is much slower than the maximum end-stimulated ATPase rate of 4 s−1 (Table 2), MCAK hydrolyzes ~80 ATPs while at the end of the MT. By analogy to conventional kinesin, MCAK is chemically processive. And second, the high stoichiometry of five cannot be due to multiple ATP hydrolysis cycles taking place on the release tubulin dimer. If this were the case, we would expect that high concentrations of tubulin should maximally activate the ATPase. But, the maximum tubulin-activated ATPase rate is only 0.15 s−1, much lower than the maximum MT-activated ATPase rate of 5 s−1.
Though we do not agree with the Desai et al. (1999) model, our results are quite consistent with their finding that the Kin I kinesin, XKIF2, forms a stable complex with tubulin dimer in the presence of AMP-PNP (Desai et al., 1999). The fact that MCAK has a tubulin-stimulated ATPase implies that MCAK physically associates with tubulin dimers, and the KM of 0.5 μM tubulin is sufficiently low to account for their observations that were made in 10 μM tubulin. The failure of Desai et al. to detect a complex in the presence of ATP can be reconciled with our results if ATP hydrolysis and dissociation of the Kin I-tubulin complex is rapid (>>0.15 s−1).
A Crossbridge Model for Kin I Kinesins
Our data suggest that MCAK interacts with the MT lattice and ends as shown in Figure 6A. We propose that these interactions are coupled to the ATP hydrolysis cycle according to the model shown in Figure 6B. First, we postulate that Kin I kinesins, like other kinesins, release ADP upon binding to the MT. Though there is no direct evidence for this, it is supported by the observation that MCAK binds uniformly to the MT lattice, and not preferentially at the ends, in the absence of nucleotides (Maney et al., 1998; Wordeman et al., 1999; our unpublished data). If MCAK diffused to ends in the ADP state and released its ADP at ends, then we would expect to see end binding in the absence of nucleotide.
We postulate that diffusion on the lattice occurs either in the ATP state or the ADP-Pi state. The preferential binding of MCAK to MT ends in the presence of AMP-PNP (Desai et al., 1999; our unpublished data) means that Kin I kinesins bind weakly to the MT lattice in the ATP state (in which AMP-PNP traps the enzyme); other-wise, if the ATP state were a strongly bound state, then AMP-PNP-MCAK would uniformly decorate the lattice as is the case for conventional kinesin (Crevel et al., 1996). Weak binding in the ATP state is another feature that distinguishes MCAK from all other kinesins studied so far (Crevel et al., 1996). One possibility is that the electrostatic interaction between the E-hook and positive charges in the neck of the motor domain provides the tether during lattice diffusion (Ovechkina and Worde-man, 2002).
To complete the cycle, we postulate that the dissociation of the terminal tubulin dimer is triggered by either ATP hydrolysis or Pi release. This is consistent with the observation that in the presence of AMP-PNP Kin I kinesins stabilize protofilament peels and rings (Desai et al., 1999; Moores et al., 2002; Niederstrasser et al., 2002) but do not remove individual tubulin dimers from the protofilament. The disassembly observed in AMP-PNP is therefore different from the true depolymerization that is observed in ATP. Thus, in the ATP state, Kin I kinesins bind to the bent conformation of tubulin and form a stable complex. Only after hydrolysis does the terminal tubulin dimer separate from the MT. One possibility is that binding in the ADP-Pi state strains even more the link between the ultimate and penultimate tubulin dimers. After dislodging the terminal tubulin, the Kin I protein remains attached to the MT, perhaps through an electrostatic interaction. Alternatively, the tether could be the second head of a dimer, and Kin I kinesins may operate by a hand-over-hand mechanism analogous to conventional kinesin (Schief and Howard, 2001).
The simplest explanation for the stoichiometry of five ATPs hydrolyzed per GMP-CPP-tubulin removed is that MCAK slips; if it releases Pi before the tubulin dimer has dissociated, then MCAK finds itself still bound to the MT in the ADP state. The ADP would be rapidly released, ATP would bind and be hydrolyzed, and a futile round of hydrolysis would have occurred. In this view, the low efficiency is due to a kinetic partitioning of the cycle; only 20% of the hydrolysis cycles are productive. MCAK is more efficient at removing taxol-bound dimers than GMP-CPP dimmers; the minimum stoichiometry measured for taxol-stabilized MTs was only two (data not shown), as might be expected from the lower stability of taxol-MTs over GMP-CPP MTs. It is even possible that MCAK requires only one ATP to remove a GTP-dimer from the end of a dynamic MT.
Our proposed ATP hydrolysis cycle is meant to serve as a working model that illustrates how a hydrolysis scheme that drives a motor might be turned into one that drives a depolymerase.
Experimental Procedures
Protein Purification
Recombinant 6× histidine-tagged MCAK was expressed in Sf9 cells (Pharmingen, San Diego, CA) and purified on a Ni-NTA-agarose column (Qiagen Inc., Chatsworth, CA) according to Maney et al.(1998). Because MCAK is a dimer (Maney et al., 1998), the concentration refers to dimers and was determined as half the concentration of nucleotide binding sites, which were measured radiometrically (Coy et al., 1999). Bovine brain tubulin was purified to >95% purity (Mickey and Howard, 1995). Aliquots in BRB80 buffer (80 mM potassium PIPES [pH 6.9], 1 mM EGTA, 1 mM MgCl2) were frozen in liquid nitrogen and stored at ‒80°C. Tubulin concentrations, expressed in terms of 110 kDa tubulin heterodimers, were measured by absorbance at 276 nm in 6 M guanidine HCl using an extinction coefficient of 1.03 ml/mg·cm.
Microtubules
For microscopy assays, MTs were assembled in BRB80 plus 1 mM MgGMP-CPP from a mixture of 6 μM rhodamine-labeled tubulin (Hyman et al., 1991) and 18 μM unlabeled tubulin. For turbidity, stopped-flow, and ATPase assays, MTs were prepared by two cycles of assembly in GMP-CPP to deplete the GDP-tubulin dimers in the lattice (Caplow and Shanks, 1996). Because MCAK depolymerase and ATPase activities are sensitive to the concentration of MT ends, it was necessary to freeze the cycled GMP-CPP MTs to prevent end-to-end annealing. Long GMP-CPP MTs for the end-stimulated ATPase assays (Mickey and Howard, 1995) were sheared using a 30 gauge needle. The length distributions were determined by negative stain electron microscopy (Desai et al., 1999).
Microscopy Assays
Depolymerization reactions were performed with 20 nM MCAK in BRB80 buffer supplemented with 2 mM MgATP, 75 mM KCl, 1 mg/ml BSA, 0.8% methylcellulose (to slow diffusion, Uyeda et al., 1990; Hunt et al., 1994), and an oxygen scavenging mix (20 mM D-glucose, 20 μg/ml glucose oxidase, 8 μg/ml catalase, 0.5% βME) at 23 ± 1°C. Purified MCAK was rapidly mixed with rhodamine-labeled GMP-CPP MTs (40 nM tubulin polymer) while vortexing, and then ~120 μl of a 200 μl reaction was loaded into a custom-made thick flowcell followed by immediate observation (≤45 s after mixing). For the diffusion studies, the surfaces of a 10 μl flowcell were coated with MCAK by perfusing in 500 nM MCAK in BRB80 buffer. MTs were images by fluorescence microscopy (Howard et al., 1993). Analysis of the depolymerization rates and mean-square displacement were performed in IGOR Pro (Wavemetrics, Lake Oswego, OR). The diffusion coefficients were calculated according to Hunt and Howard (1993).
Turbidity Assay
Aliquots of cycled GMP-CPP MTs were thawed and diluted to 300 nM tubulin polymer in BRB80 buffer supplemented with 250 μM MgATP, 75 mM KCl, 1 mM DTT, and 200 μg/ml BSA. Prior to the addition of motor, the MT solution was equilibrated to 23 ± 1°C in a quartz cuvette. The turbidity was measured at 5 s intervals using a Hewlett-Packard 8452A spectrophotometer and converted to tubulin polymer concentration using a standard curve.
Spindown Assay
The amount of tubulin polymer was also measured by sedimenting gluteraldehyde-fixed MTs (1% gluteraldehyde in BRB80 for 3 min) onto glass coverslips coated with 10–100 μg/ml poly-L-lysine using the Airfuge EM-90 rotor (28 psi, 8 min, 23°C). Coverslips were post-fixed in methanol, rehydrated, blocked with 20% normal donkey serum, processed for immunofluorescence using DMI α monoclonal anti-tubulin primary antibody (Sigma Chemical Co., St. Louis, MO) and TRITC-conjugated donkey anti-mouse secondary antibody (Jackson ImmunoResearch Laboratories Inc., West Grove, PA), and mounted in Vectashield mounting medium (Vector Laboratories Inc., Burlingame, CA). The MT number concentration was determined from the number of MTs per field and appropriate scaling to account for the magnification, dilution, and the geometry of the EM-90 rotor.
Stopped Flow Assay
Aliquots of GMP-CPP MTs were thawed and diluted to 1.6 μM tubulin polymer in BRB80 buffer plus 1 mM DTT. Purified MCAK was diluted to various concentrations in BRB80 buffer supplemented with 4 mM MgATP, 150 mM KCl, and 1 mM DTT. The MT and MCAK solutions (both at 2× reaction concentration) were rapidly mixed in a stopped flow apparatus (SpectraKinetic Workstation, Applied Photophysics Ltd., Surrey, United Kingdom) maintained at 25.2 ± 0.1°C. The light scattering signal (excitation and emission at 350 nm) scattered at 90° was measured at 0.2–0.5 s intervals. Because MTs break during rapid mixing, we used the maximum initial depolymerization rate measured in the microscopy and turbidity assays (0.95 μm/min) to estimate the MT (and end) concentration.
ATPase Assays
ATPase rates were determined using two different methods to assay Pi release over time. A malachite green assay (Coy et al., 1999) was used for experiments to determine ATPase activity stimulated by variable amounts of either GMP-CPP MTs or GDP-tubulin. A radio-metric assay was used for all other experiments. Three or five micro-liters of the reaction mixture (BRB80 supplemented with 250 μM [γ−32P]ATP [NEN Life Sciences Products Inc., Boston, MA], 75 mM KCl, 1 mM DTT, 100–200 μg/ml BSA, and a variable amount of MCAK or GMP-CPP MT) was quenched in 500 l cold solution containing 1 M hydrochloric acid, 4% perchloric acid, 180 μM Pi, and 10 mM ammonium molybdate. The phosphate concentration was determined by adding 1 ml organic reagent (cyclohexane, isobutyl alcohol, acetone, quench solution, mixed at ratio of 50:50:10:1), vortexing for 50 s, then allowing the phases to separate for 10 min on ice. After phase separation was complete, 63% or 65% of the organic phase containing radiolabeled Pi (complexed with molyb-date) was recovered, mixed with 3 ml scintillation fluid, and read in a Beckman scintillation counter.
Supplementary Material
Acknowledgments
We thank Mr. T. Sapra and Drs. A. Desai, A. Hyman, M. Landolfa, and E. Schäffer for comments on an earlier version of this manuscript. Mr. Sapra assisted with the motility assays. GMP-CPP was kindly provided by Drs. A. Desai and L. Amos. This work was supported by grants to A.W.H. (NIH, T326M07270), M.C. (NIH, GM59231), L.W. (NIH, GM53654A), and J.H. (NIH, AR40593; HFSP; and the Max Planck Society).
References
- Berg OG, Winter RB, and von Hippel PH (1981). Diffusion-driven mechanisms of protein translocation on nucleic acids. 1. Models and theory. Biochemistry 20, 6929–6948. [DOI] [PubMed] [Google Scholar]
- Berne BJ (1974). Interpretation of the light scattering from long rods. J. Mol. Biol 89, 755–758. [DOI] [PubMed] [Google Scholar]
- Bost-Usinger L, Chen RJ, Hillman D, Park H, and Burnside B(1997). Multiple kinesin family members expressed in teleost retina and RPE include a novel C-terminal kinesin. Exp. Eye Res 64, 781–794. [DOI] [PubMed] [Google Scholar]
- Caplow M, and Shanks J (1996). Evidence that a single monolayer tubulin-GTP cap is both necessary and sufficient to stabilize micro-tubules. Mol. Biol. Cell 7, 663–675. [DOI] [PMC free article] [PubMed] [Google Scholar]
- Caplow M, Ruhlen RL, and Shanks J (1994). The free energy for hydrolysis of a microtubule-bound nucleotide triphosphate is near zero: all of the free energy for hydrolysis is stored in the microtubule lattice. J. Cell Biol 127, 779–788. [DOI] [PMC free article] [PubMed] [Google Scholar]
- Chandra R, Endow SA, and Salmon ED (1993). An N-terminal truncation of the ncd motor protein supports diffusional movement of microtubules in motility assays. J. Cell Sci 104, 899–906. [DOI] [PubMed] [Google Scholar]
- Coue M, Lombillo VA, and McIntosh JR (1991). Microtubule depolymerization promotes particle and chromosome movement in vitro. J. Cell Biol 112, 1165–1175. [DOI] [PMC free article] [PubMed] [Google Scholar]
- Coy DL, Wagenbach M, and Howard J (1999). Kinesin takes one 8-nm step for each ATP that it hydrolyzes. J. Biol. Chem 274, 3667–3671. [DOI] [PubMed] [Google Scholar]
- Crevel IM, Lockhart A, and Cross RA (1996). Weak and strong states of kinesin and ncd. J. Mol. Biol 257, 66–76. [DOI] [PubMed] [Google Scholar]
- Desai A, Verma S, Mitchison TJ, and Walczak CE (1999). Kin I kinesins are microtubule-destabilizing enzymes. Cell 96, 69–78. [DOI] [PubMed] [Google Scholar]
- Drechsel DN, and Kirschner MW (1994). The minimum GTP cap required to stabilize microtubules. Curr. Biol 4, 1053–1061. [DOI] [PubMed] [Google Scholar]
- Drechsel DN, Hyman AA, Cobb MH, and Kirschner MW(1992). Modulation of the dynamic instability of tubulin assembly by the microtubule-associated protein tau. Mol. Biol. Cell 3, 1141–1154. [DOI] [PMC free article] [PubMed] [Google Scholar]
- Hackney DD (1995). Highly processive microtubule-stimulated ATP hydrolysis by dimeric kinesin head domains. Nature 377, 448–450. [DOI] [PubMed] [Google Scholar]
- Howard J (2001). Mechanics of Motor Proteins and the Cytoskeleton (Sunderland, MA: Sinauer Associates; ). [Google Scholar]
- Howard J, Hudspeth AJ, and Vale RD (1989). Movement of microtubules by single kinesin molecules. Nature 342, 154–158. [DOI] [PubMed] [Google Scholar]
- Howard J, Hunt AJ, and Baek S (1993). Assay of microtubule movement driven by single kinesin molecules. Methods Cell Biol 39, 137–147. [DOI] [PubMed] [Google Scholar]
- Hunt AJ, and Howard J (1993). Kinesin swivels to permit microtubule movement in any direction. Proc. Natl. Acad. Sci. USA 90, 11653–11657. [DOI] [PMC free article] [PubMed] [Google Scholar]
- Hunt AJ, Gittes F, and Howard J (1994). The force exerted by a single kinesin molecule against a viscous load. Biophys. J 67, 766–781. [DOI] [PMC free article] [PubMed] [Google Scholar]
- Hunter AW, and Wordeman L (2000). How motor proteins influence microtubule polymerization dynamics. J. Cell Sci 113, 4379–4389. [DOI] [PubMed] [Google Scholar]
- Hyman A, Drechsel D, Kellogg D, Salser S, Sawin K, Steffen P, Wordeman L, and Mitchison T (1991). Preparation of modified tubulins. Methods Enzymol 196, 478–485. [DOI] [PubMed] [Google Scholar]
- Hyman AA, Salser S, Drechsel DN, Unwin N, and Mitchison TJ (1992). Role of GTP hydrolysis in microtubule dynamics: information from a slowly hydrolyzable analogue, GMPCPP. Mol. Biol. Cell 3, 1155–1167. [DOI] [PMC free article] [PubMed] [Google Scholar]
- Hyman AA, Chretien D, Arnal I, and Wade RH (1995). Structural changes accompanying GTP hydrolysis in microtubules: information from a slowly hydrolyzable analogue guanylyl-(alpha,beta)-methylene-diphosphonate. J. Cell Biol 128, 117–125. [DOI] [PMC free article] [PubMed] [Google Scholar]
- Kim AJ, and Endow SA (2000). A kinesin family tree. J. Cell Sci 113, 3681–3682. [DOI] [PubMed] [Google Scholar]
- Kinoshita K, Arnal I, Desai A, Drechsel DN, and Hyman AA(2001). Reconstitution of physiological microtubule dynamics using purified components. Science 294, 1340–1343. [DOI] [PubMed] [Google Scholar]
- Lawrence CJ, Malmberg RL, Muszynski MG, and Dawe RK(2002). Maximum likelihood methods reveal conservation of function among closely related kinesin families. J. Mol. Evol 54, 42–53. [DOI] [PubMed] [Google Scholar]
- Lombillo VA, Stewart RJ, and McIntosh JR (1995). Minus-end-directed motion of kinesin-coated microspheres driven by microtubule depolymerization. Nature 373, 161–164. [DOI] [PubMed] [Google Scholar]
- Mandelkow EM, Mandelkow E, and Milligan RA (1991). Microtubule dynamics and microtubule caps: a time-resolved cryo-electron microscopy study. J. Cell Biol 114, 977–991. [DOI] [PMC free article] [PubMed] [Google Scholar]
- Maney T, Hunter AW, Wagenbach M, and Wordeman L (1998). Mitotic centromere-associated kinesin is important for anaphase chromosome segregation. J. Cell Biol 142, 787–801. [DOI] [PMC free article] [PubMed] [Google Scholar]
- Maney T, Wagenbach M, and Wordeman L (2001). Molecular dissection of the microtubule depolymerizing activity of mitotic centromere-associated kinesin. J. Biol. Chem 276, 34753–34758. [DOI] [PubMed] [Google Scholar]
- Mickey B, and Howard J (1995). Rigidity of microtubules is in-creased by stabilizing agents. J. Cell Biol 130, 909–917. [DOI] [PMC free article] [PubMed] [Google Scholar]
- Mitchison T, and Kirschner M (1984). Dynamic instability of microtubule growth. Nature 312, 237–242. [DOI] [PubMed] [Google Scholar]
- Moores CA, Yu M, Guo J, Beraud C, Sakowicz R, and Milligan RA (2002). A mechanism for microtubule depolymerization by KinI kinesins. Mol. Cell 9, 903–909. [DOI] [PubMed] [Google Scholar]
- Muller-Reichert T, Chretien D, Severin F, and Hyman AA (1998). Structural changes at microtubule ends accompanying GTP hydrolysis: information from a slowly hydrolyzable analogue of GTP, guanylyl (alpha,beta)methylenediphosphonate. Proc. Natl. Acad. Sci. USA 95, 3661–3666. [DOI] [PMC free article] [PubMed] [Google Scholar]
- Nicklas RB (1988). The forces that move chromosomes in mitosis. Annu. Rev. Biophys. Biophys. Chem 17, 431–449. [DOI] [PubMed] [Google Scholar]
- Niederstrasser H, Salehi-Had H, Gan EC, Walczak C, and No-gales E (2002). XKCM1 acts on a single protofilament and requires the C terminus of tubulin. J. Mol. Biol 316, 817–828. [DOI] [PubMed] [Google Scholar]
- Noda Y, Sato-Yoshitake R, Kondo S, Nangaku M, and Hirokawa N (1995). KIF2 is a new microtubule-based anterograde motor that transports membranous organelles distinct from those carried by kinesin heavy chain or KIF3A/B. J. Cell Biol 129, 157–167. [DOI] [PMC free article] [PubMed] [Google Scholar]
- O’Brien ET, Salmon ED, and Erickson HP (1997). How calcium causes microtubule depolymerization. Cell Motil. Cytoskeleton 36, 125–135. [DOI] [PubMed] [Google Scholar]
- Okada Y, and Hirokawa N (1999). A processive single-headed motor: kinesin superfamily protein KIF1A. Science 283, 1152–1157. [DOI] [PubMed] [Google Scholar]
- Ovechkina Y, Wagenbach M, and Wordeman L (2002). K-loop insertion restores microtubule depolymerizing activity of a “neck-less” MCAK mutant. J. Cell Biol 159, 557–562. [DOI] [PMC free article] [PubMed] [Google Scholar]
- Santama N, Krijnse-Locker J, Griffiths G, Noda Y, Hirokawa N, and Dotti CG (1998). KIF2beta, a new kinesin superfamily protein in non-neuronal cells, is associated with lysosomes and may be implicated in their centrifugal translocation. EMBO J 17, 5855–5867. [DOI] [PMC free article] [PubMed] [Google Scholar]
- Schief WR, and Howard J (2001). Conformational changes during kinesin motility. Curr. Opin. Cell Biol 13, 19–28. [DOI] [PubMed] [Google Scholar]
- Skibbens RV, Skeen VP, and Salmon ED (1993). Directional instability of kinetochore motility during chromosome congression and segregation in mitotic newt lung cells: a push-pull mechanism. J. Cell Biol 122, 859–875. [DOI] [PMC free article] [PubMed] [Google Scholar]
- Smith AD (1997). Oxford Dictionary of Biochemistry and Molecular Biology (Oxford: Oxford University Press; ). [Google Scholar]
- Spolar RS, and Record MT Jr. (1994). Coupling of local folding to site-specific binding of proteins to DNA. Science 263, 777–784. [DOI] [PubMed] [Google Scholar]
- Stanford NP, Szczelkun MD, Marko JF, and Halford SE(2000). One-and three-dimensional pathways for proteins to reach specific DNA sites. EMBO J 19, 6546–6557. [DOI] [PMC free article] [PubMed] [Google Scholar]
- Tournebize R, Popov A, Kinoshita K, Ashford AJ, Rybina S, Pozniakovsky A, Mayer TU, Walczak CE, Karsenti E, and Hy-man AA (2000). Control of microtubule dynamics by the antagonistic activities of XMAP215 and XKCM1 in Xenopus egg extracts. Nat. Cell Biol 2, 13–19. [DOI] [PubMed] [Google Scholar]
- Uyeda TQ, Kron SJ, and Spudich JA (1990). Myosin step size. Estimation from slow sliding movement of actin over low densities of heavy meromyosin. J. Mol. Biol 214, 699–710. [DOI] [PubMed] [Google Scholar]
- Vale RD, Soll DR, and Gibbons IR (1989). One-dimensional diffusion of microtubules bound to flagellar dynein. Cell 59, 915–925. [DOI] [PubMed] [Google Scholar]
- Walczak CE, Mitchison TJ, and Desai A (1996). XKCM1: a Xeno-pus kinesin-related protein that regulates microtubule dynamics during mitotic spindle assembly. Cell 84, 37–47. [DOI] [PubMed] [Google Scholar]
- Walker RA, O’Brien ET, Pryer NK, Soboeiro MF, Voter WA, Erickson HP, and Salmon ED (1988). Dynamic instability of individual microtubules analyzed by video light microscopy: rate constants and transition frequencies. J. Cell Biol 107, 1437–1448. [DOI] [PMC free article] [PubMed] [Google Scholar]
- Walker RA, Pryer NK, and Salmon ED (1991). Dilution of individual microtubules observed in real time in vitro: evidence that cap size is small and independent of elongation rate. J. Cell Biol 114, 73–81. [DOI] [PMC free article] [PubMed] [Google Scholar]
- Waterman-Storer CM, and Salmon ED (1998). How microtubules get fluorescent speckles. Biophys. J 75, 2059–2069. [DOI] [PMC free article] [PubMed] [Google Scholar]
- Wordeman L, and Mitchison TJ (1995). Identification and partial characterization of mitotic centromere-associated kinesin, a kinesin-related protein that associates with centromeres during mitosis. J. Cell Biol 128, 95–104. [DOI] [PMC free article] [PubMed] [Google Scholar]
- Wordeman L, Wagenbach M, and Maney T (1999). Mutations in the ATP-binding domain affect the subcellular distribution of mitotic centromere-associated kinesin (MCAK). Cell Biol. Int 23, 275–286. [DOI] [PubMed] [Google Scholar]
Associated Data
This section collects any data citations, data availability statements, or supplementary materials included in this article.