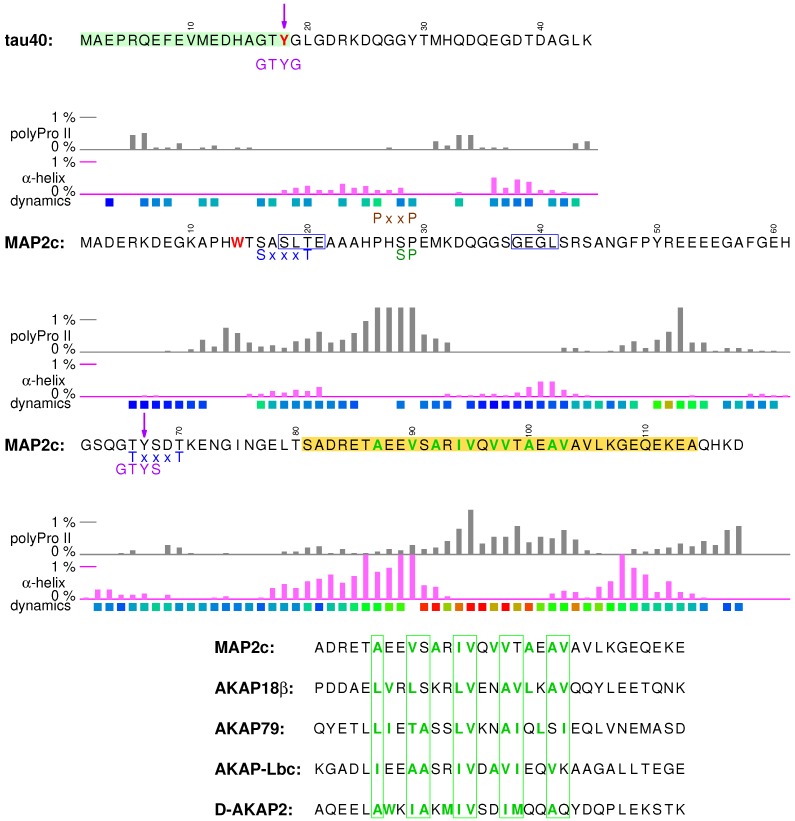
Figure 3.
N-terminal sequences of human tau40 and rat MAP2c. The pale green and yellow boxes indicate the region of tau interacting with membranes and the region of MAP2c interacting with the regulatory RII subunit of PKA, respectively. Highly conserved residues are shown in red. Hydrophobic residues in the region interacting with the regulatory RII subunit of PKA are shown in green. Phosphorylated tyrosines are marked with purple arrows. Minimal SH3 interaction motifs (PxxP) are shown in brown above the sequences. Recognition motifs of proline-directed kinases (green) and GSK3 (blue), and Fyn phosphorylation motifs (purple) are shown below the sequences. Populations of continuous stretches of seven amino acids in the -helical and polyproline II conformations in the ensembles of structures selected by the ASTEROIDS analyses based on measured NMR chemical shifts [31,57] are shown as pink and gray bars placed in the middle of the stretches, respectively. Residues forming -turns are shown in blue frames. Dynamics of individual amino acids, measured as transverse NMR relaxation rate, is described by colors of the boxes below the secondary structure symbols (blue corresponding to flexible residues with the relaxation rate of 2 s or lower, red corresponding to the most ordered residues with the relaxation rate of 10 s or higher). The presented values are the relaxation rates measured at 700 MHz and 5 C for tau40 [38] and values recalculated from relaxation rates measured at 950 MHz and 27 C for MAP2c [57] in order to account for the magnetic field difference. No temperature correction was applied because relaxation rates of IDPs cannot be easily recalculated for a different temperature. Alignment with the sequences of well-ordered AKAPs is shown under the region interacting with the regulatory RII subunit of PKA (preferred positions of hydrophobic residues in the amphiphilic binding -helices are shown in green frames).

