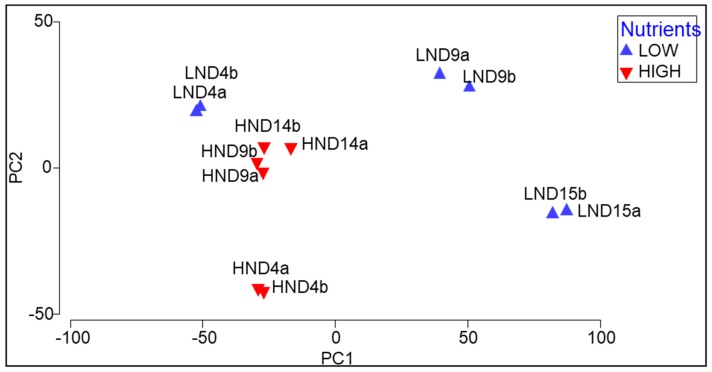
Figure 5.
Principal component analyses (PCAs) of samples at different time points (Day = D) of Chlorella sp. grown in batch cultures (n = 2; a, b) containing LN or HN media based on the polar lipid species profiles (legends inset). PC1 and PC2 explain 73.3 and 17.3% of variation, respectively (cumulative 90.6% of variation explained by the model).

