Figure 1.
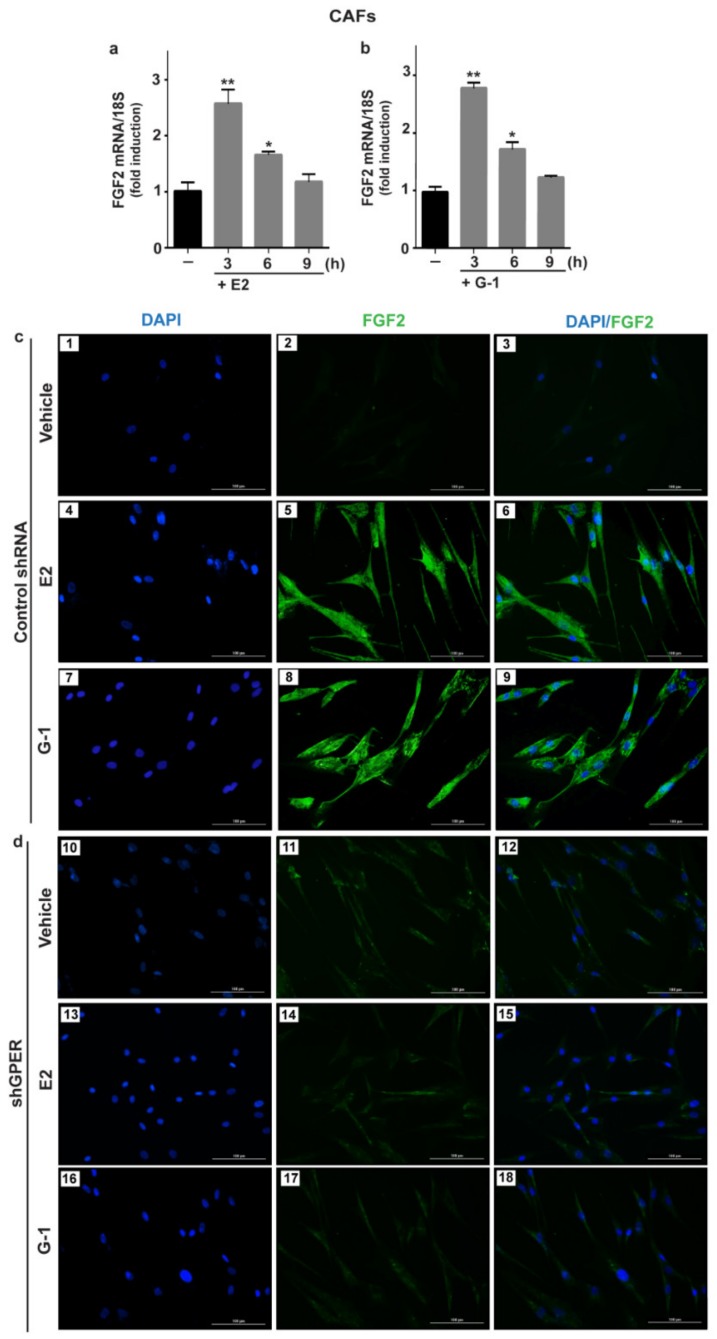
E2 and G-1 induce FGF2 expression through GPER in CAFs. 10 nM E2 (a) and 100 nM G-1 (b) induced FGF2 mRNA expression, as evaluated by quantitative PCR (qPCR). Values were normalized to 18S expression and shown as fold changes of FGF2 mRNA expression upon E2 and G-1 treatments respect to cells exposed to vehicle (). Each column represents the mean ± standard deviation (SD) of three independent experiments performed in triplicate. (**) indicates p < 0.01 and (*) indicates p < 0.05. (c,d) FGF2 protein expression by immunofluorescence in CAFs transfected for 24 h with control shRNA (panels 1–9) or sh G protein estrogen receptor (shGPER) (panels 10–18) and then treated for 6 h with vehicle, 10 nM E2 and 100 nM G-1, as indicated. FGF2 accumulation is shown by the green signal, nuclei are stained by 4, 6-diamidino-2-phenylindole dihydrochloride (DAPI) (blue signal), scale bar = 100 μm. Images shown are representative of two independent experiments.

