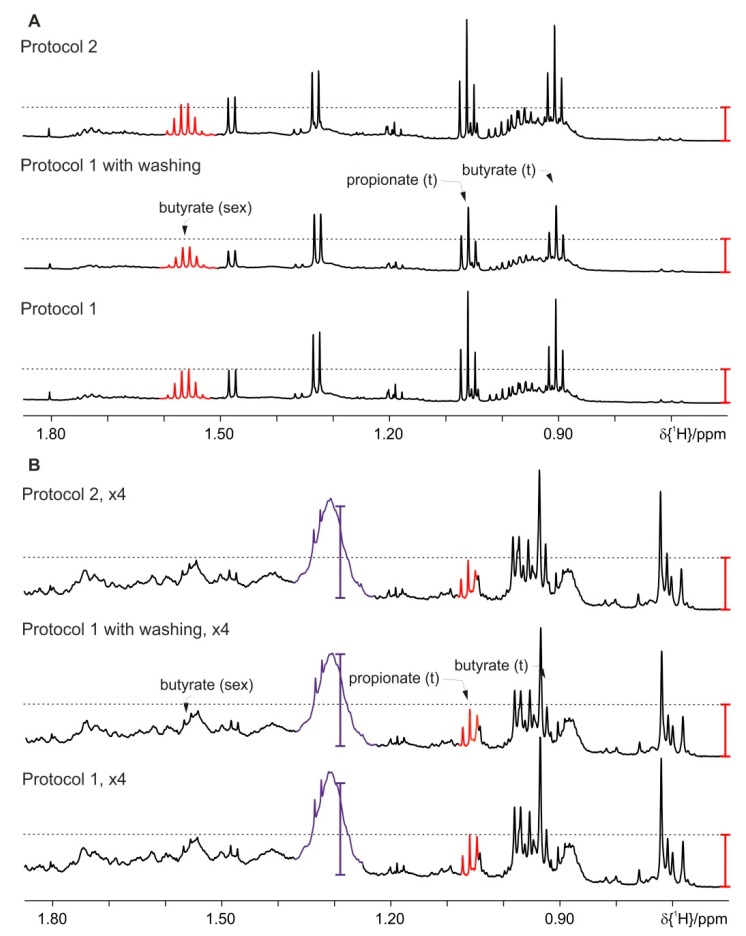
Figure 8.
Effect of optimized lipid extraction at 4 °C on the concentration of metabolites and amounts of background signals using Protocol 1 without and with washing steps and Protocol 2: (A) feces of mice fed on a standard diet and (B) on HFD (the intensity is upscaled four times). For clarity only a selected spectral range of the proton NMR spectra is shown. The red and violet bars are fixed at the same height in each section of the figure and indicate the increased signal intensities of the SCFA and background signals, respectively.

