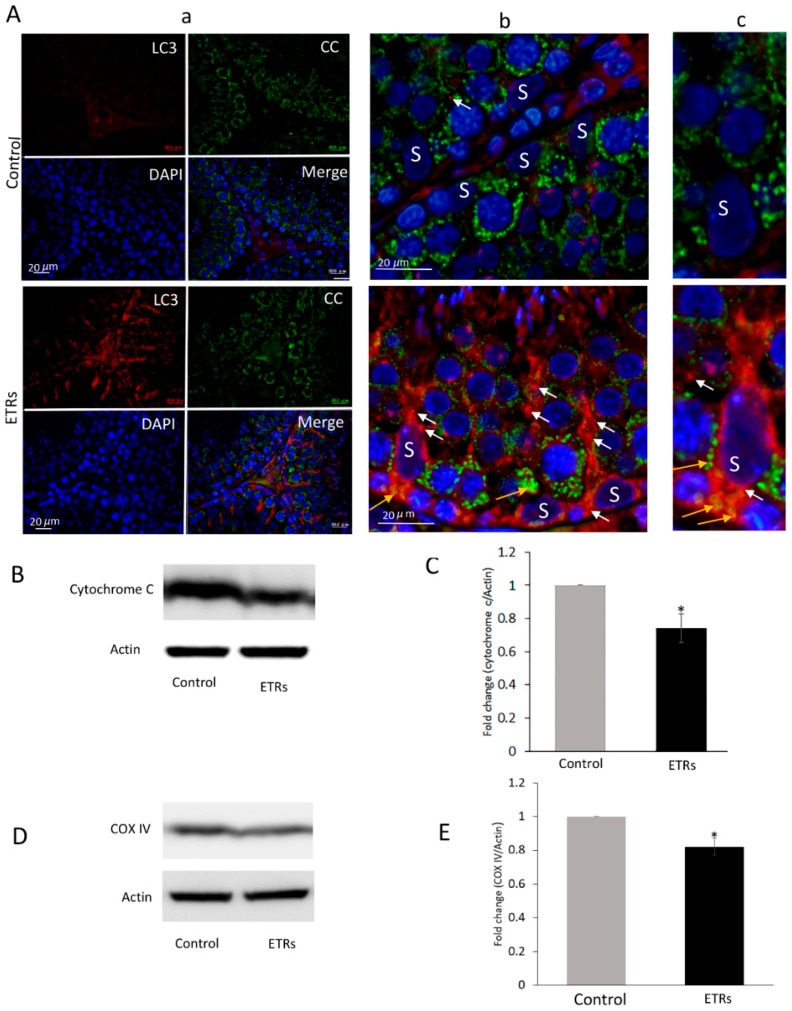
Figure 3.
Enhanced colocalization of LC3 with cytochrome c in SCs of ETRs and reduced expression of mitochondrial proteins. (A) Immunofluorescence (IF) double-labeling of LC3 (red) and cytochrome c (CC) (green) with nuclear counterstaining using DAPI (blue). The panels in the middle (b) and on the right (c) are higher magnifications of those on the left in (a). Orange arrows indicate areas of colocalization for proteins (yellow-orange), while white arrows indicate LC3 puncta. S: SC nucleus. (B) Western blot of CC (n = 3). The histogram in (C) shows significant reduction of CC in ETRs. (D) Western bot of Cytochrome c oxidase (COX) IV (n = 3). The histogram in E shows significant reduction of the protein in ETRs * p < 0.05 (t-test).

