

Abstract
Different tacrolimus (TAC) population pharmacokinetic (PPK) models have been established in various pediatric disease populations. However, a TAC PPK model for pediatric refractory nephrotic syndrome (PRNS) has not been well characterized. The current study aimed to establish a TAC PPK model in Chinese PRNS and provide a summary of previous literature concerning TAC PPK models in different pediatric diseases. A total of 147 TAC conventional therapeutic drug monitoring (TDM) data from multiple blood samples obtained from 65 Chinese patients with PRNS were characterized using nonlinear mixed-effects modeling. The impacts of demographic features, biological characteristics and drug combination were evaluated. Model validation was assessed using the bootstrap method. A one-compartment model with first-order absorption and elimination was determined to be the most suitable model for TDM data in PRNS. The absorption rate constant (Ka) was set at 4.48 h−1. The typical values of apparent oral clearance (CL/F) and apparent volume of distribution (V/F) in the final model were 5.46 l/h and 57.1 l, respectively. The inter-individual variability of CL/F and V/F were 22.2 and 0.2%, respectively. The PPK equation for TAC was: CL/F = 5.46 × exponential function (EXP)(0.0323 × age) × EXP(−0.359 × cystatin-C) × EXP(0.148 × daily dose of TAC). No significant effects of covariates on V/F were observed. In conclusion, the current study developed and validated the first TAC PPK model for patients with PRNS. The study also provided a summary of previous literature concerning other TAC PPK models in different pediatric diseases.
Keywords: pediatric refractory nephrotic syndrome, nonlinear mixed-effects modeling, population pharmacokinetics, tacrolimus, therapeutic drug monitoring
Introduction
The incidence of nephrotic syndrome (NS) in children is 0.16‰, and is a primary concern in pediatric nephrology. NS may cause damage to the kidneys by enhancing glomerular basement membrane permeability (1,2). The majority of diagnosed children have steroid-sensitive nephrotic syndrome (SSNS), and ~20% of children do not achieve complete remission and ultimately develop steroid-resistant nephrotic syndrome (SRNS) (3). In addition, 80–90% of children with SSNS undergo relapse, and in those that relapse, 50% experience frequent relapses and develop steroid-dependent nephrotic syndrome (SDNS) (4–6). Therefore, the treatment of pediatric refractory nephrotic syndrome (PRNS), which includes SDNS and SRNS, is challenging. Patients with PRNS are administered repeated, long-term steroid therapy, which increases the risk of obesity, cushingoid appearance, hypertension, growth retardation, osteoporosis, infections and psychological problems (7).
Encouragingly, several investigations have used tacrolimus (TAC), a steroid-sparing agent, to treat patients with PRNS, which has improved responses and reduced adverse reactions to steroid therapy (8–15). However, as a potent immunosuppressive agent, the therapeutic window of TAC is narrow (16). Although adequate and continuous immunosuppression is necessary, excessive immunosuppression may give rise to severe adverse reactions, including infections and toxicity. TAC pharmacokinetics (PK) have exhibited considerable inter- and intra-individual variability, making it difficult to define an optimal dosing schedule (16,17).
Using population PK (PPK), PK data may be acquired by analyzing sparse data pooled from a group of people. Furthermore, the PPK method is able to differentiate between inter- and intra-individual variability. Thus, compared with traditional PK, PPK has the power to verify the effect of multiple factors on PK and may make it possible to determine an optimal dose schedule (18). Currently, different TAC PPK models have been set up in multiple populations, including patients undergoing renal transplant (19–24), liver transplant (25–30), hematopoietic stem cell transplant (31) and lung transplant (32). However, the TAC PPK model for PRNS is still unclear. The objective of the current study was to produce a TAC PPK model in Chinese patients with PRNS and to analyze factors involved in pharmacokinetic variability. The current study also summarizes previous literature regarding TAC PPK models in different pediatric diseases, including liver transplant (27,28,33–39), kidney transplant (23) and hematopoietic stem cell transplant (31).
Patients and methods
Patients and data collection
Patients <18 years of age, who were diagnosed with PRNS and were receiving TAC therapy were recruited into the present study. Patients were excluded if they presented with other serious diseases, including kidney transplantation. A total of 65 Chinese patients (44 males and 21 females) with PRNS treated at the Children's Hospital of Fudan University (Shanghai, China) between January 2014 and October 2017 (2.4–16.4 years old; mean age, 7.6±3.9 years) were retrospectively analyzed. Drug concentrations were collected from therapeutic drug monitoring (TDM) records and relevant clinical information was acquired from medical records. The study was approved by the Research Ethics Committee of the Children's Hospital of Fudan University.
Information extracted from the medical records included age, weight, daily dose of TAC (TAMT), albumin (ALB), globulin (GLB), albumin/globulin (A/G), aspartate aminotransferase (AST), alanine aminotransferase (ALT), creatinine (CR), total protein (TP), cystatin-C (CYSC), gamma-glutamyl transpeptidase (GGT), urea (UR), uric acid (UA), hematocrit (HCT), hemoglobin (HGB), mean corpuscular hemoglobin (MCH), mean corpuscular hemoglobin concentration (MCHC) and concomitant drugs (corticosteroids, clarithromycin, ceftriaxone, warfarin, simvastatin, cimetidine, ranitidine, omeprazole, nifedipine, diltiazem, felodipine, fosinopril, dihydrochlorothiazide, spirolactone, ciclosporin, mycophenolate mofetil, montelukast, loratadine, piperazine ferulate, vitamin B6 and shegan mixture). The information was verified for accuracy as comprehensively as possible.
Drug administration
All patients received oral TAC (capsule, 1 and 0.5 mg). The initial TAC dose was 0.5–2.0 mg twice daily and the dose range of TAC was 1.0–4.0 mg/day. The dose of TAC was adjusted based on efficacy, adverse effects and the trough concentration in TDM. All blood concentrations were collected prior to the subsequent administration. The TAC concentrations used in the current research were trough concentrations.
Analytical method
Whole blood concentrations of TAC were measured using the Emit® 2000 Tacrolimus assay (Siemens Healthineers, Erlangen, Germany), which was linear over the range of 2.0–30.0 ng/ml and blood samples exceeding the upper limit of the calibration range of 30.0 ng/ml were diluted according to the manufacturer's protocol.
Population pharmacokinetic modeling
Data were analyzed using a nonlinear mixed-effects model computer program (NONMEM, version 7; ICON Development Solutions, LLC, Ellicott City, MD, USA). The first-order conditional estimation method with interaction option was used to estimate PK parameters and their variability. A one-compartment model with first-order elimination was used for describing the absorption phase, since all the TAC concentrations in the current research were trough concentrations. The bioavailability (F) and absorption with a lag time could not be estimated because TAC was orally administered and TAC concentration data were insufficient. Thus, the PK parameters were comprised of apparent oral clearance (CL/F) and apparent volume of distribution (V/F). The absorption rate constant (Ka) of the model was set as 4.48 h−1, according to what was previously set in the literature (28,40,41).
Random effect model
The inter-individual variability in PK parameters was explored with additive, proportional and exponential error models. The residual error variability was evaluated with additive, proportional, exponential and mixed error models.
Covariate model
To determine the variability of PK parameters, the associations were examined between covariates and all the PK parameters where inter-individual variability was tested. The possible covariates included age, weight, TAMT, ALB, GLB, A/G, AST, ALT, CR, TP, CYSC, GGT, UR, UA, HCT, HGB, MCH, MCHC and concomitant medication. The covariate model was established in a stepwise way. To compare hierarchical models, a likelihood ratio test was adopted. The change in objective function values (OFV) caused by the inclusion of a covariate is proportional to twice the negative log likelihood of the data and approximates a chi-square distribution (42). In the univariate analysis, a decrease in OFV >3.84 (P<0.05, degrees of freedom = 1) was selected as a standard for inclusion of the covariate in the base model. The significant covariates were reserved in the model. When a full regression model was built, the model was further validated by discarding the covariate of each parameter one by one to acquire the final model. An increase in OFV >6.64 (P<0.01, degrees of freedom = 1) was selected as a standard to retain significant covariates in the final model.
Model validation
An internal validation bootstrap method was used to evaluate the stability and reliability of parameter estimates in the final model (43). Goodness-of-fit plots applied to models were generated using R software (version 3.4.2; http://www.r-project.org/). Bootstrapping was produced using repeated random sampling with replacement of the original data (44,45). This procedure was performed using the software package Wings for NONMEM (version 7; ICON Development Solutions, LLC) and repeated 2,000 times with different random draws. Bootstrap outcomes with successful minimization and acceptable covariance were applied for further analysis. The medians and 2.5–97.5% percentiles in the bootstrap result set parameters were compared with the parameter estimates of final PK.
Summary of TAC PPK models in different pediatric diseases
To investigate the differences and similarities in TAC PPK models and factors that cause its variation among various pediatric diseases, the study also provided a summary of previous literature regarding TAC PPK models in pediatric patients with PRNS, liver transplant, kidney transplant and hematopoietic stem cell transplant. Studies between January 1995 and October 2017 were retrieved from PubMed (https://www.ncbi.nlm.nih.gov/pubmed) and Web of Science Knowledge (https://login.webofknowledge.com/). Search terms included: Tacrolimus, population pharmacokinetics and relevant pediatric diseases. Primary research papers matching the criteria were identified and evaluated.
Results
Data collection
Whole blood concentration of TAC was evaluated in 147 samples from 65 Chinese patients with PRNS consisting of 44 males and 21 females, and data were made available for population modeling. Patient characteristics and drug combinations are summarized in Tables I and II, respectively.
Table I.
Demographic and clinical characteristics of patients (n=65).
| Characteristic | Mean ± SD | Median | Range |
|---|---|---|---|
| Age (years) | 7.61±3.92 | 6.8 | 2.4–16.4 |
| Weight (kg) | 30.85±17.12 | 25.0 | 13.5–86.5 |
| TAMT (mg) | 1.62±0.75 | 1.5 | 1.0–4.0 |
| A/G | 1.16±0.44 | 1.1 | 0.6–2.6 |
| ALB (g/l) | 25.41±8.87 | 24.1 | 12.3–45.3 |
| ALT (IU/l) | 9.91±6.48 | 8.0 | 2.0–35.0 |
| AST (IU/l) | 15.93±6.49 | 14.0 | 5.0–35.0 |
| CR (µmol/l) | 30.49±12.67 | 27.0 | 14.0–69.0 |
| GLB (g/l) | 22.16±3.32 | 22.6 | 15.2–31.2 |
| TP (g/l) | 47.51±10.22 | 46.9 | 29.5–69.1 |
| CYSC (mg/l) | 0.85±0.25 | 0.8 | 0.4–2.3 |
| GGT (IU/l) | 32.85±54.52 | 22.0 | 9.0–446.0 |
| UR (mmol/l) | 4.41±2.59 | 4.0 | 1.9–18.1 |
| UA (µmol/l) | 343.42±117.00 | 315.0 | 134.0–799.0 |
| HCT (%) | 42.62±4.94 | 42.6 | 27.4–55.3 |
| HGB (g/l) | 144.79±17.34 | 146.0 | 90.0–180.1 |
| MCH (pg) | 28.91±1.46 | 29.0 | 26.0–32.0 |
| MCHC (g/l) | 340.12±14.91 | 342.0 | 302.0–366.0 |
TAMT, daily dose of tacrolimus; A/G, albumin/globulin; ALB, albumin; ALT, alanine aminotransferase; AST, aspartate aminotransferase; CR, creatinine; GLB, globulin; TP, total protein; CYSC, cystatin-C; GGT, gamma-glutamyl transpeptidase; UR, urea; UA, uric acid; HCT, hematocrit; HGB, hemoglobin; MCH, mean corpuscular hemoglobin; MCHC, MCH concentration; SD, standard deviation.
Table II.
Drug combinations administered to patients.
| Drug | Category | n | % |
|---|---|---|---|
| Corticosteroids | 0 | 1 | 1.5 |
| 1 | 64 | 98.5 | |
| Clarithromycin | 0 | 64 | 98.5 |
| 1 | 1 | 1.5 | |
| Ceftriaxone | 0 | 63 | 96.9 |
| 1 | 2 | 3.1 | |
| Warfarin | 0 | 64 | 98.5 |
| 1 | 1 | 1.5 | |
| Simvastatin | 0 | 64 | 98.5 |
| 1 | 1 | 1.5 | |
| Cimetidine | 0 | 64 | 98.5 |
| 1 | 1 | 1.5 | |
| Ranitidine | 0 | 64 | 98.5 |
| 1 | 1 | 1.5 | |
| Omeprazole | 0 | 55 | 84.6 |
| 1 | 10 | 15.4 | |
| Nifedipine | 0 | 64 | 98.5 |
| 1 | 1 | 1.5 | |
| Diltiazem | 0 | 61 | 93.8 |
| 1 | 4 | 6.2 | |
| Felodipine | 0 | 63 | 96.9 |
| 1 | 2 | 3.1 | |
| Fosinopril | 0 | 52 | 80.0 |
| 1 | 13 | 20.0 | |
| Dihydrochlorothiazide | 0 | 42 | 64.6 |
| 1 | 23 | 35.4 | |
| Spirolactone | 0 | 43 | 66.2 |
| 1 | 22 | 33.8 | |
| Ciclosporin | 0 | 63 | 96.9 |
| 1 | 2 | 3.1 | |
| Mycophenolate mofetil | 0 | 63 | 96.9 |
| 1 | 2 | 3.1 | |
| Montelukast | 0 | 63 | 96.9 |
| 1 | 2 | 3.1 | |
| Loratadine | 0 | 63 | 96.9 |
| 1 | 2 | 3.1 | |
| Piperazine ferulate | 0 | 58 | 89.2 |
| 1 | 7 | 10.8 | |
| Vitamin B6 | 0 | 64 | 98.5 |
| 1 | 1 | 1.5 | |
| Shegan mixture | 0 | 61 | 93.8 |
| 1 | 4 | 6.2 |
0, not administered; 1, administered.
Modeling and validation
A one-compartment model with first order absorption and elimination was best fitted to the data. Ka was set at 4.48 h−1 according to the literature (28,40,41). Furthermore, the Ka parameter was also tested using other values to evaluate the sensitivity. Ka was increased or reduced 5-fold, from 0.896 to 22.4 h−1. However, the results of CL/F, V/F and the OFV exhibited minimal changes. Using this method, it was determined that the appropriate Ka value was 4.48 h−1. The PK parameters of TAC, CL/F and V/F were estimated using NONMEM. Inter-individual variability and residual variability were best described by exponential and mixed error models, respectively. Of all the tested covariates, only three had a significant effect on PK parameters: Age, CYSC and TAMT on CL/F. No covariates notably influenced V/F. The changes in OFV are presented in Table III. The final models were as follows: CL/F = θCL/F × EXP(θAGE × age) × EXP(θCYSC × CYSC) × EXP (θTAMT × TAMT); V/F = θV/F; where θCL/F and θV/F were the typical population values of CL/F and V/F, respectively, and θAGE, θCYSC and θTAMT were the coefficients of age, CYSC and TAMT, respectively.
Table III.
Change of OFV in covariate analysis.
| Step | Model description | OFV | ∆OFV | P-value |
|---|---|---|---|---|
| Inclusion | Base model | 455.868 | N/A | N/A |
| Influence of age on CL/F | 438.708 | −17.160 | <0.05 | |
| Influence of CYSC on CL/F | 427.426 | −11.282 | <0.05 | |
| Influence of TAMT on CL/F | 420.171 | −7.255 | <0.05 | |
| Elimination | Full model | 420.171 | N/A | N/A |
| Eliminate age on CL/F | 428.159 | 7.988 | <0.01 | |
| Eliminate CYSC on CL/F | 433.351 | 13.180 | <0.01 | |
| Eliminate TAMT on CL/F | 427.426 | 7.255 | <0.01 |
OFV, objective function values; CL/F, apparent oral clearance; CYSC, cystatin-C; TAMT, daily dose of tacrolimus.
The goodness-of-fit plots of the final model compared with the base model are presented in Figs. 1 and 2. From 2,000 bootstrap runs, 1,791 runs were successfully minimized by covariance steps, and finally they were added into the bootstrap analysis. The parameter estimates of the final model and bootstrap validation are presented in Table IV. The median values of the parameter estimated from bootstraps were near to the final model's respective values, indicating that the PK parameter estimates from the final model were precise and the model was reliable.
Figure 1.
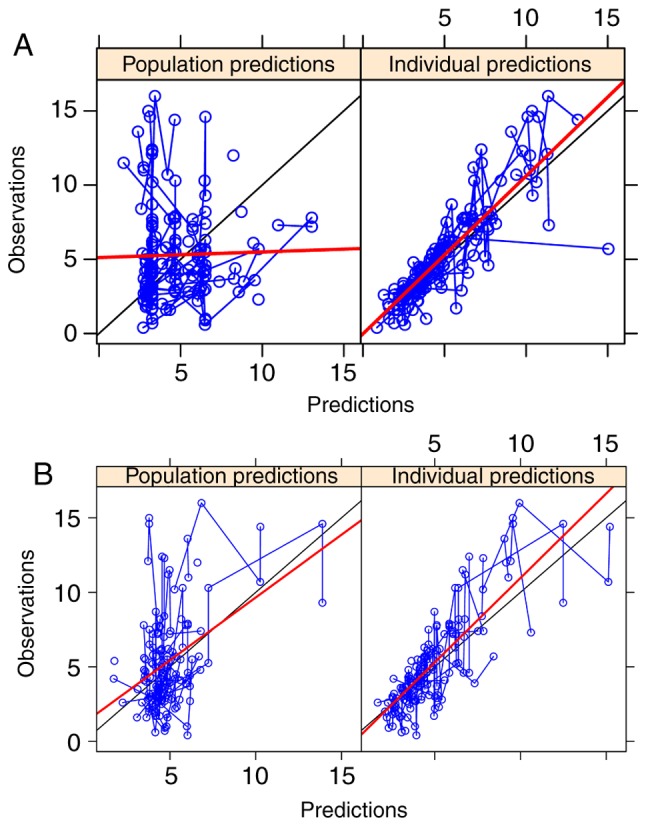
Population and individual predictions. (A) Observation vs. population predictions and individual predictions in the base model. (B) Observation vs. population predictions and individual predictions in the final model.
Figure 2.
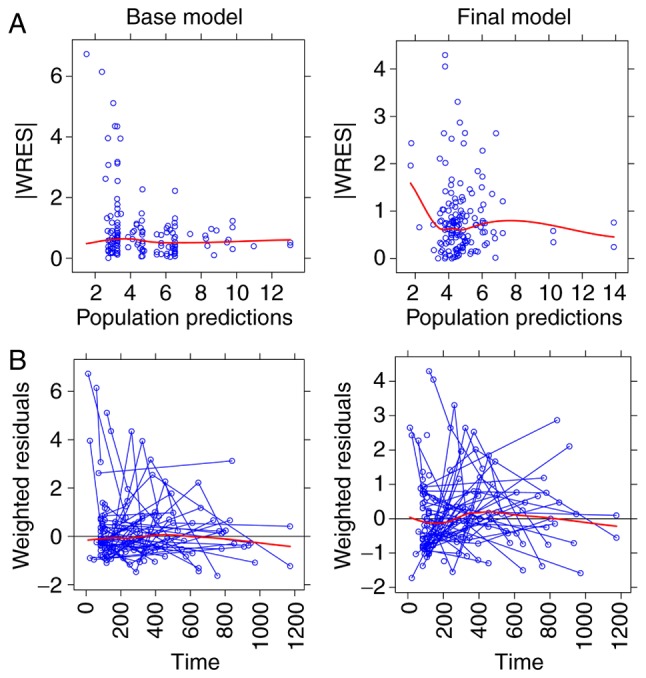
Weighted residuals. (A) Absolute value of weighted residuals vs. population predictions in the base and final model. (B) Weighted residuals vs. time in the base and final model. |WRES|, absolute value ofweighted residuals.
Table IV.
Parameter estimates of final model and bootstrap validation.
| Bootstrap (n=2000) | |||||
|---|---|---|---|---|---|
| Parameter | Estimate | SE (%) | Median | 95% confidence interval | Bias (%) |
| CL/F (l/h) | 5.4600 | 22.7 | 5.640 | [0.160, 9.895] | 3.297 |
| V/F (l) | 57.1000 | 46.8 | 59.500 | [0.298, 496.750] | 4.203 |
| Ka (h-1) | 4.4800 (fixed) | N/A | N/A | N/A | N/A |
| θAGE | 0.0323 | 35.0 | 0.033 | [0.007, 0.062] | 2.477 |
| θCYSC | −0.3590 | 26.1 | −0.375 | [-0.719, −0.087] | 4.457 |
| θTAMT | 0.1480 | 47.9 | 0.140 | [0.012, 0.350] | −5.405 |
| ωCL/F | 0.2220 | 18.5 | 0.216 | [0.053, 0.342] | −2.703 |
| ωV/F | 0. 0020 | 48.5 | 0.001 | [0.001, 0.009] | −50.000 |
| σ1 | 0.3590 | 8.2 | 0.345 | [0.235, 0.417] | −3.900 |
| σ2 | 0.8040 | 31.5 | 0.806 | [0.003, 1.594] | 0.249 |
95% confidential interval was the 2.5th and 97.5th percentile of bootstrap estimates. CL/F, apparent oral clearance; V/F, apparent volume of distribution; Ka, absorption rate constant; θAGE, θCYSC and θTAMT, coefficients of age, CYSC and TAMT, respectively; ωCL/F, inter-individual variability of CL/F; ωV/F, inter-individual variability of V/F; σ1, residual variability, proportional error; σ2, residual variability, additive error; Bias, prediction error, Bias (%) = (Median-Estimate) / Estimate × 100; SE, standard error.
TAC PPK models in different pediatric diseases
Twelve pediatric TAC PPK models were identified in the literature, including the current PRNS model, nine liver transplant models, one kidney transplant model and one hematopoietic stem cell transplant model. Table V summarizes these PPK studies in different pediatric diseases. However, TAC PPK models vary in pediatric diseases, which indicates that disease state may lead to differences in CL/F and V/F in different pediatric disease populations.
Table V.
Population pharmacokinetics of tacrolimus in different pediatric disease models.
| Model | Reference | n | Age in years, average (range) | Time post-transplantation | Pharmacokinetic parameters | BSV CL (%) | BSV V (%) | Refs. |
|---|---|---|---|---|---|---|---|---|
| Refractory nephrotic syndrome | Current study | 65 | 6.8a (2.4–16.4) | NR | CL/F (l/h) = 5.46 × EXP(0.0323 × AGE) × EXP(−0.359 × CYSC) × EXP(0.148 × TAMT); V/F (l) = 57.1; Ka (h−1) = 4.48 (fixed) | 22.2 | 0.2 | N/A |
| Liver transplant | Yang et al, 2015 | 52 | 1.78b (0.42–17.8) | From the day after transplantation | CL/F (l/h) = 5.72 × POD0.152 × (ALT/70)−0.111; V/F (l) = 131 × POD0.31 × (ALT/70)−0.317 × (TP/54)−2.01; Ka (h−1) = 4.48 (fixed) | 13.5 | 78.1 | 28 |
| Kassir et al, 2014 | 30 | 7.3a (0.4–18.4) | ≤28 days, 8 patients; >28 days, 22 patients | CL/F (l/h) =12.1 × (WT/20)0.75; V1/F (l) = 31.3 × (WT/20)1; Q/F (l/h) = 30.7 × (WT/20)0.75; V2/F (l) = 290 × (WT/20)1; Ka (h−1) = 0.342 × (WT/20)−0.25; tlag (h) =0.433 | 55.6 | 126.1 | 37 | |
| Jalil et al, 2014 | 43 | 5b (0.65–17.56) | First year post-transplantation | CL/F (l/h)c = 12.9 × (WT/13.2)0.75 × e(−0.00158×POD) × e(0.428×hFLAG) | 40 | NR | 36 | |
| Guy-Viterbo et al, 2013 | 42 | 1.35a (0.53–10.93) | From the day after transplantation until the patient experienced a rejection episode or, alternatively, until the end of the first year | CL/F (l/day)d = 0.001 × [1 + (314×TIME) / (17.4 + TIME)] × [(Size / WT) / median (Size / WT)]0.12 × (Hct/29)−0.85; V1/F (l) = 253 × (WT/10.2)0.9; V2/F (l) =100 (fixed); Q/F (l/day) = 115 | 54.8 | 77.5 | 35 | |
| Wallin et al, 2011 | 73 | 3.5a (0.4–16.9) | First year post-transplantation | CL/F (l/h/kg−0.75) = 0.148 + (1.37 × POD3.78) / (5.383.78 + POD3.78); V/F (l/kg) = 27.2 | NR | 90 | 27 | |
| Fukudo et al, 2006 | 100 | 1.2a (0.1–15.0) | First 50 days post-transplantation | CL/F (l/h/kg)e = (0.134 × 1.8iFLAG + 0.0181 × 2 hFLAG × XPOD) × 8.6 × (WT/8.6)0.341 × e(−0.0358×AST/53); V/F (l) = 17.1 × 8.6 × (WT/8.6)0.341 | 48.7 | 82.6 | 33 | |
| Garcia Sanchez et al, 2001 | 18 | 9.1a (0.3–16.0) | From 1 day to 6.8 years | CL (l/h) = 10.4 × (WT/70)0.75 × e(−0.00032T) × e(−0.057BILI) × (1 - 0.079 × ALT); F = 20% (fixed) | 24.3 | NR | 34 | |
| Sam et al, 2000 | 20 | 3.7b (1.1–13.9) | 0–7 days | CL (l/h) = 1.46 × [1 + 0.339 × (AGE - 2.25)]; V (l) = 39.1 × [1 + 4.57 × (BSA-0.49)]; F (%) = 0.197 × (1 + 0.0887 × WT - 11.4), BILI <200 µmol/l; F (%) = 0.197 × (1 + 0.0887 × WT - 11.4) × 1.61, BILI ≥200 µmol/l | 33.5 | 33 | 38 | |
| Yasuhara et al, 1995 | 33 | 4.2b (0.3–15) | 52 days | CL (l/h) = (0.0749 + 0.000457 × POD) × [15 × (WT/15)0.29]; V (l) = 2.76 × [15 × (WT/15)0.29]; F =19% | 52.1 | 27.4 | 39 | |
| Kidney transplant | Zhao et al, 2009 | 50 | 10b (2–18) | During the initial post-transplantation period (<2 months) | Ka (h−1) = 0.462; tlag (h) =0.356; CL/F (l/h)f = 13.9 × (WT/70)0.75 × (2.26FLAG1) + 7.11 × (1.74 FLAG2); V1/F (l) = 57.9 × (WT/70); V2/F (l) = 966 × (WT/70); Q/F (l) = 79.7 × (WT/70)0.75 | 41.9 | 132 | 23 |
| Hematopoietic stem cell transplant | Wallin et al, 2009 | 22 | 6b (0.5–18) | Within the first year after stem cell transplantation | CL (ml/h/kg−0.75) = 106 × [1 + 18.7 × (S-Crea−1 - S-Crea−1median)]; V (l/kg) = 3.71; F (%) = 15.7 × [1 + (−0.002) × POD - 14] | 50 | 122 | 31 |
Median value.
Mean value.
If the patient was a CYP3A5*1 allele carrier, then hFLAG = 1; otherwise, 0.
Equation not fully provided by authors.
If POD was <21, then XPOD = POD; otherwise, XPOD = 21; if the donor was a CYP3A5*1 allele carrier, then hFLAG = 1; otherwise, 0; and if the intestinal MDR1 mRNA level was >0.22 amol (µg total RNA)−1, then iFLAG = 1; otherwise, 0.
If CYP3A5*3/*3, FLAG1 = 0; if CYP3A5*1/*3 or *1/*1, FLAG1 = 1; if hematocrit ≥33%, FLAG2 = 0; if hematocrit <33%, FLAG2 = 1. AGE, age; ALT, alanine aminotransferase; AST, aspartate aminotransferase; BILI, bilirubin concentration; BSA, body surface area; BSV, between-subject variability; CL, clearance; CL/F, apparent oral clearance; CYSC, cystatin-C; F, bioavailability; Hct, haematocrit; Ka, absorption rate constant; NR, not reported; POD, postoperative day; Q/F, intercompartmental clearance; S-Crea, serum creatinine; Size/WT, liver transplant size/body weight ratio; tlag, lag time; T, time after initiation of treatment; TAMT, daily dose of tacrolimus; TIME, time after transplantation; TP, total protein; V, volume of distribution; V/F, apparent volume of distribution; V1/F, apparent central volume of distribution; V2/F, apparent peripheral volume of distribution; WT, body weight.
Discussion
TAC has been used for the treatment of patients with PRNS to improve their responses and reduce adverse reactions to steroid therapy. Since TAC exhibits considerable inter- and intra-individual PK variability, PPK analysis of TAC is crucial (8–17). To the best of our knowledge, the current model may be the first pediatric study of TAC PPK in patients with refractory nephrotic syndrome. In the current study, TAC PPK was performed in Chinese patients with PRNS using a population modeling method, which was particularly applicable since excessive blood sample collection is prohibited for pediatric patients compared with traditional PK studies (46). A TAC PPK model that is able to determine the pharmacokinetic process in individual patients with PRNS may have important clinical applications.
In the current study, a one-compartment model with first-order elimination was used for describing the absorption phase, as all the TAC concentrations were trough concentrations, and the Ka of the model was fixed at 4.48 h−1 (28,40,41). The typical values of CL/F and V/F in the final TAC PPK model were 5.46 l/h and 57.1 l, respectively, and the CL/F value was similar to that in a PPK model of TAC in Chinese pediatric patients shortly after liver transplantation (28). The current model also tested various covariates on different parameters and the following covariates were determined to be significant: Age, CYSC and TAMT on CL/F. Przepiorka et al (47) also demonstrated that TAC clearance was age-dependent in pediatric patients undergoing hematopoietic stem cell transplant. Thus, CL/F of TAC was affected by age in PRNS and pediatric hematopoietic stem cell transplantation models; this may be associated with developmental maturity and how this influences the clearance of TAC.
Cystatin-C, generated by all nucleated cells and catabolized by proximal tubules, is a low molecular weight protein that is part of the cysteine protease family (48). Cystatin-C is superior to creatinine in estimating glomerular filtration rate (49) and is widely considered to be a predictive biomarker in kidney and cardiovascular diseases (50,51). Additionally, serum cystatin-C has been confirmed as a more sensitive biomarker than serum creatinine in predicting renal dysfunction in patients with primary NS (49,52). This also supports the previous claim that cystatin-C was a biomarker of NS and could predict the disease progress (49,52,53). The current study identified that CL/F was negatively associated with cystatin-C, which indicated the progression of disease had an impact on CL/F in a pediatric refractory nephrotic syndrome model.
In addition to age and CYSC, another key factor affecting TAC clearance was TAMT. It is established that TAC is primarily metabolized by the oxidative enzyme cytochrome P450 (CYP) 3A subfamily in the intestine and liver, with CYP3A4 and the highly polymorphic CYP3A5 as the major metabolizing enzymes (54). A previous study reported that individuals with the CYP3A5*3/*3 genotype require less TAC to attain objective concentrations compared with patients with the CYP3A5*1 allele (55–57). Additionally, genetically-induced CYP3A5 hyperactivity increases the TAC daily dose (58). Therefore, the effect of TAMT on CL/F may be primarily derived from CYP3A5 gene polymorphisms. Unfortunately, at present, CYP3A5 genotyping is not routinely performed in Chinese patients with PRNS. Whether CYP3A5 genotype could better assess the inter-individual variability in the current model of CL/F on TAC in PRNS should be determined in the future.
In addition, the current study provided a summary of previous literature concerning TAC PPK models in several pediatric diseases. Notably, TAC PPK models vary in different pediatric diseases. To a certain extent, this may indicate that disease situation may lead to differences in CL/F and V/F in different populations.
In conclusion, the first TAC PPK model in patients with PRNS was established using retrospective, routinely monitored data. Age, CYSC and TAMT were identified as significant covariates for CL/F. No covariates significantly influenced V/F. The current study also provided a summary of previous literature concerning TAC PPK models in different pediatric diseases.
Acknowledgements
Not applicable.
Funding
This study was supported by the Clinical Pharmacy Key Specialty Construction Project of Shanghai (grant no. YZ2017/5).
Availability of data and materials
The datasets used and/or analyzed during the current study are available from the corresponding author on reasonable request.
Authors' contributions
ZL conceived and designed the study. DW, JL and QL collected data and built the model. DW wrote the paper. JL and QL reviewed and edited the manuscript. All authors read and approved the final manuscript.
Ethics approval and consent to participate
The study was approved by the Research Ethics Committee of Children's Hospital of Fudan University (Shanghai, China).
Patient consent for publication
Not applicable.
Competing interests
The authors declare that they have no competing interests.
References
- 1.Certikova-Chabova V, Tesar V. Recent insights into the pathogenesis of nephrotic syndrome. Minerva Med. 2013;104:333–347. [PubMed] [Google Scholar]
- 2.2. Eddy AA, Symons JM. Nephrotic syndrome in childhood. Lancet. 2003;362:629–639. doi: 10.1016/S0140-6736(03)14184-0. [DOI] [PubMed] [Google Scholar]
- 3.McKinney PA, Feltbower RG, Brocklebank JT, Fitzpatrick MM. Time trends and ethnic patterns of childhood nephrotic syndrome in Yorkshire, UK. Pediatr Nephrol. 2001;16:1040–1044. doi: 10.1007/s004670100021. [DOI] [PubMed] [Google Scholar]
- 4.Koskimies O, Vilska J, Rapola J, Hallman N. Long-term outcome of primary nephrotic syndrome. Arch Dis Child. 1982;57:544–548. doi: 10.1136/adc.57.7.544. [DOI] [PMC free article] [PubMed] [Google Scholar]
- 5.Lombel RM, Gipson DS, Hodson EM, Kidney Disease Improving Global Outcomes: Treatment of steroid-sensitive nephrotic syndrome: New guidelines from KDIGO. Pediatr Nephrol. 2013;28:415–426. doi: 10.1007/s00467-012-2310-x. [DOI] [PubMed] [Google Scholar]
- 6.Tarshish P, Tobin JN, Bernstein J, Edelmann CM., Jr Prognostic significance of the early course of minimal change nephrotic syndrome: Report of the International Study of Kidney Disease in Children. J Am Soc Nephrol. 1997;8:769–776. doi: 10.1681/ASN.V85769. [DOI] [PubMed] [Google Scholar]
- 7.Hodson EM, Willis NS, Craig JC. Corticosteroid therapy for nephrotic syndrome in children. Cochrane Database Syst Rev (4) 2007:CD001533. doi: 10.1002/14651858.CD001533.pub4. [DOI] [PubMed] [Google Scholar]
- 8.Choudhry S, Bagga A, Hari P, Sharma S, Kalaivani M, Dinda A. Efficacy and safety of tacrolimus versus cyclosporine in children with steroid-resistant nephrotic syndrome: A randomized controlled trial. Am J Kidney Dis. 2009;53:760–769. doi: 10.1053/j.ajkd.2008.11.033. [DOI] [PubMed] [Google Scholar]
- 9.Gulati A, Sinha A, Gupta A, Kanitkar M, Sreenivas V, Sharma J, Mantan M, Agarwal I, Dinda AK, Hari P, et al. Treatment with tacrolimus and prednisolone is preferable to intravenous cyclophosphamide as the initial therapy for children with steroid-resistant nephrotic syndrome. Kidney Int. 2012;82:1130–1135. doi: 10.1038/ki.2012.238. [DOI] [PubMed] [Google Scholar]
- 10.Gulati S, Prasad N, Sharma RK, Kumar A, Gupta A, Baburaj VP. Tacrolimus: A new therapy for steroid-resistant nephrotic syndrome in children. Nephrol Dial Transplant. 2008;23:910–913. doi: 10.1093/ndt/gfm688. [DOI] [PubMed] [Google Scholar]
- 11.Loeffler K, Gowrishankar M, Yiu V. Tacrolimus therapy in pediatric patients with treatment-resistant nephrotic syndrome. Pediatr Nephrol. 2004;19:281–287. doi: 10.1007/s00467-003-1370-3. [DOI] [PubMed] [Google Scholar]
- 12.Roberti I, Vyas S. Long-term outcome of children with steroid-resistant nephrotic syndrome treated with tacrolimus. Pediatr Nephrol. 2010;25:1117–1124. doi: 10.1007/s00467-010-1471-8. [DOI] [PubMed] [Google Scholar]
- 13.Sinha A, Gupta A, Kalaivani M, Hari P, Dinda AK, Bagga A. Mycophenolate mofetil is inferior to tacrolimus in sustaining remission in children with idiopathic steroid-resistant nephrotic syndrome. Kidney Int. 2017;92:248–257. doi: 10.1016/j.kint.2017.01.019. [DOI] [PubMed] [Google Scholar]
- 14.Wang W, Xia Y, Mao J, Chen Y, Wang D, Shen H, Fu H, Du L, Liu A. Treatment of tacrolimus or cyclosporine A in children with idiopathic nephrotic syndrome. Pediatr Nephrol. 2012;27:2073–2079. doi: 10.1007/s00467-012-2228-3. [DOI] [PubMed] [Google Scholar]
- 15.Yang EM, Lee ST, Choi HJ, Cho HY, Lee JH, Kang HG, Park YS, Cheong HI, Ha IS. Tacrolimus for children with refractory nephrotic syndrome: A one-year prospective, multicenter, and open-label study of Tacrobell®, a generic formula. World J Pediatr. 2016;12:60–65. doi: 10.1007/s12519-015-0062-y. [DOI] [PubMed] [Google Scholar]
- 16.Venkataramanan R, Swaminathan A, Prasad T, Jain A, Zuckerman S, Warty V, McMichael J, Lever J, Burckart G, Starzl T. Clinical pharmacokinetics of tacrolimus. Clin Pharmacokinet. 1995;29:404–430. doi: 10.2165/00003088-199529060-00003. [DOI] [PubMed] [Google Scholar]
- 17.Jusko WJ, Thomson AW, Fung J, McMaster P, Wong SH, Zylber-Katz E, Christians U, Winkler M, Fitzsimmons WE, Lieberman R, et al. Consensus document: Therapeutic monitoring of tacrolimus (FK-506) Ther Drug Monit. 1995;17:606–614. doi: 10.1097/00007691-199512000-00011. [DOI] [PubMed] [Google Scholar]
- 18.Vadcharavivad S, Praisuwan S, Techawathanawanna N, Treyaprasert W, Avihingsanon Y. Population pharmacokinetics of tacrolimus in Thai kidney transplant patients: Comparison with similar data from other populations. J Clin Pharm Ther. 2016;41:310–328. doi: 10.1111/jcpt.12396. [DOI] [PubMed] [Google Scholar]
- 19.Andreu F, Colom H, Grinyó JM, Torras J, Cruzado JM, Lloberas N. Development of a population PK model of tacrolimus for adaptive dosage control in stable kidney transplant patients. Ther Drug Monit. 2015;37:246–255. doi: 10.1097/FTD.0000000000000134. [DOI] [PubMed] [Google Scholar]
- 20.Benkali K, Rostaing L, Premaud A, Woillard JB, Saint-Marcoux F, Urien S, Kamar N, Marquet P, Rousseau A. Population pharmacokinetics and Bayesian estimation of tacrolimus exposure in renal transplant recipients on a new once-daily formulation. Clin Pharmacokinet. 2010;49:683–692. doi: 10.2165/11535950-000000000-00000. [DOI] [PubMed] [Google Scholar]
- 21.Bergmann TK, Hennig S, Barraclough KA, Isbel NM, Staatz CE. Population pharmacokinetics of tacrolimus in adult kidney transplant patients: Impact of CYP3A5 genotype on starting dose. Ther Drug Monit. 2014;36:62–70. doi: 10.1097/FTD.0b013e31829f1ab8. [DOI] [PubMed] [Google Scholar]
- 22.Han N, Ha S, Yun HY, Kim MG, Min SI, Ha J, Lee JI, Oh JM, Kim IW. Population pharmacokinetic-pharmacogenetic model of tacrolimus in the early period after kidney transplantation. Basic Clin Pharmacol Toxicol. 2014;114:400–406. doi: 10.1111/bcpt.12176. [DOI] [PubMed] [Google Scholar]
- 23.Zhao W, Elie V, Roussey G, Brochard K, Niaudet P, Leroy V, Loirat C, Cochat P, Cloarec S, André JL, et al. Population pharmacokinetics and pharmacogenetics of tacrolimus in de novo pediatric kidney transplant recipients. Clin Pharmacol Ther. 2009;86:609–618. doi: 10.1038/clpt.2009.210. [DOI] [PubMed] [Google Scholar]
- 24.Zuo XC, Ng CM, Barrett JS, Luo AJ, Zhang BK, Deng CH, Xi LY, Cheng K, Ming YZ, Yang GP, et al. Effects of CYP3A4 and CYP3A5 polymorphisms on tacrolimus pharmacokinetics in Chinese adult renal transplant recipients: A population pharmacokinetic analysis. Pharmacogenet Genomics. 2013;23:251–261. doi: 10.1097/FPC.0b013e32835fcbb6. [DOI] [PubMed] [Google Scholar]
- 25.Lu YX, Su QH, Wu KH, Ren YP, Li L, Zhou TY, Lu W. A population pharmacokinetic study of tacrolimus in healthy Chinese volunteers and liver transplant patients. Acta Pharmacol Sin. 2015;36:281–288. doi: 10.1038/aps.2014.110. [DOI] [PMC free article] [PubMed] [Google Scholar]
- 26.Musuamba FT, Guy-Viterbo V, Reding R, Verbeeck RK, Wallemacq P. Population pharmacokinetic analysis of tacrolimus early after pediatric liver transplantation. Ther Drug Monit. 2014;36:54–61. doi: 10.1097/FTD.0b013e31829dcbcd. [DOI] [PubMed] [Google Scholar]
- 27.Wallin JE, Bergstrand M, Wilczek HE, Nydert PS, Karlsson MO, Staatz CE. Population pharmacokinetics of tacrolimus in pediatric liver transplantation: Early posttransplantation clearance. Ther Drug Monit. 2011;33:663–672. doi: 10.1097/FTD.0b013e31823415cc. [DOI] [PubMed] [Google Scholar]
- 28.Yang JW, Liao SS, Zhu LQ, Zhao Y, Zhang Y, Sun XY, Rao W, Qu W, Li WZ, Sun LY. Population pharmacokinetic analysis of tacrolimus early after Chinese pediatric liver transplantation. Int J Clin Pharmacol Ther. 2015;53:75–83. doi: 10.5414/CP202189. [DOI] [PubMed] [Google Scholar]
- 29.Zhang XQ, Wang ZW, Fan JW, Li YP, Jiao Z, Gao JW, Peng ZH, Liu GL. The impact of sulfonylureas on tacrolimus apparent clearance revealed by a population pharmacokinetics analysis in Chinese adult liver-transplant patients. Ther Drug Monit. 2012;34:126–133. doi: 10.1097/FTD.0b013e31824a67eb. [DOI] [PubMed] [Google Scholar]
- 30.Zhu L, Yang J, Zhang Y, Jing Y, Zhang Y, Li G. Effects of CYP3A5 genotypes, ABCB1 C3435T and G2677T/A polymorphism on pharmacokinetics of Tacrolimus in Chinese adult liver transplant patients. Xenobiotica. 2015;45:840–846. doi: 10.3109/00498254.2015.1021733. [DOI] [PubMed] [Google Scholar]
- 31.Wallin JE, Friberg LE, Fasth A, Staatz CE. Population pharmacokinetics of tacrolimus in pediatric hematopoietic stem cell transplant recipients: New initial dosage suggestions and a model-based dosage adjustment tool. Ther Drug Monit. 2009;31:457–466. doi: 10.1097/FTD.0b013e3181aab02b. [DOI] [PubMed] [Google Scholar]
- 32.Monchaud C, de Winter BC, Knoop C, Estenne M, Reynaud-Gaubert M, Pison C, Stern M, Kessler R, Guillemain R, Marquet P, et al. Population pharmacokinetic modelling and design of a Bayesian estimator for therapeutic drug monitoring of tacrolimus in lung transplantation. Clin Pharmacokinet. 2012;51:175–186. doi: 10.2165/11594760-000000000-00000. [DOI] [PubMed] [Google Scholar]
- 33.Fukudo M, Yano I, Masuda S, Goto M, Uesugi M, Katsura T, Ogura Y, Oike F, Takada Y, Egawa H. Population pharmacokinetic and pharmacogenomic analysis of tacrolimus in pediatric living-donor liver transplant recipients. Clin Pharmacol Ther. 2006;80:331–345. doi: 10.1016/j.clpt.2006.06.008. [DOI] [PubMed] [Google Scholar]
- 34.García Sánchez MJ, Manzanares C, Santos-Buelga D, Blázquez A, Manzanares J, Urruzuno P, Medina E. Covariate effects on the apparent clearance of tacrolimus in paediatric liver transplant patients undergoing conversion therapy. Clin Pharmacokinet. 2001;40:63–71. doi: 10.2165/00003088-200140010-00005. [DOI] [PubMed] [Google Scholar]
- 35.Guy-Viterbo V, Scohy A, Verbeeck RK, Reding R, Wallemacq P, Musuamba FT. Population pharmacokinetic analysis of tacrolimus in the first year after pediatric liver transplantation. Eur J Clin Pharmacol. 2013;69:1533–1542. doi: 10.1007/s00228-013-1501-0. [DOI] [PubMed] [Google Scholar]
- 36.Jalil MH, Hawwa AF, McKiernan PJ, Shields MD, McElnay JC. Population pharmacokinetic and pharmacogenetic analysis of tacrolimus in paediatric liver transplant patients. Br J Clin Pharmacol. 2014;77:130–140. doi: 10.1111/bcp.12174. [DOI] [PMC free article] [PubMed] [Google Scholar]
- 37.Kassir N, Labbé L, Delaloye JR, Mouksassi MS, Lapeyraque AL, Alvarez F, Lallier M, Beaunoyer M, Théorêt Y, Litalien C. Population pharmacokinetics and Bayesian estimation of tacrolimus exposure in paediatric liver transplant recipients. Br J Clin Pharmacol. 2014;77:1051–1063. doi: 10.1111/bcp.12276. [DOI] [PMC free article] [PubMed] [Google Scholar]
- 38.Sam WJ, Aw M, Quak SH, Lim SM, Charles BG, Chan SY, Ho PC. Population pharmacokinetics of tacrolimus in Asian paediatric liver transplant patients. Br J Clin Pharmacol. 2000;50:531–541. doi: 10.1046/j.1365-2125.2000.00288.x. [DOI] [PMC free article] [PubMed] [Google Scholar]
- 39.Yasuhara M, Hashida T, Toraguchi M, Hashimoto Y, Kimura M, Inui K, Hori R, Inomata Y, Tanaka K, Yamaoka Y. Pharmacokinetics and pharmacodynamics of FK 506 in pediatric patients receiving living-related donor liver transplantations. Transplant Proc. 1995;27:1108–1110. [PubMed] [Google Scholar]
- 40.Jusko WJ, Piekoszewski W, Klintmalm GB, Shaefer MS, Hebert MF, Piergies AA, Lee CC, Schechter P, Mekki QA. Pharmacokinetics of tacrolimus in liver transplant patients. Clin Pharmacol Ther. 1995;57:281–290. doi: 10.1016/0009-9236(95)90153-1. [DOI] [PubMed] [Google Scholar]
- 41.Lindbom L, Pihlgren P, Jonsson EN. PsN-Toolkit - a collection of computer intensive statistical methods for non-linear mixed effect modeling using NONMEM. Comput Methods Programs Biomed. 2005;79:241–257. doi: 10.1016/j.cmpb.2005.04.005. [DOI] [PubMed] [Google Scholar]
- 42.Wang DD, Lu JM, Li Q, Li ZP. Population pharmacokinetics of tacrolimus in paediatric systemic lupus erythematosus based on real-world study. J Clin Pharm Ther. 2018;43:476–483. doi: 10.1111/jcpt.12707. [DOI] [PubMed] [Google Scholar]
- 43.Lindbom L, Ribbing J, Jonsson EN. Perl-speaks-NONMEM (PsN) - a Perl module for NONMEM related programming. Comput Methods Programs Biomed. 2004;75:85–94. doi: 10.1016/j.cmpb.2003.11.003. [DOI] [PubMed] [Google Scholar]
- 44.Brendel K, Dartois C, Comets E, Lemenuel-Diot A, Laveille C, Tranchand B, Girard P, Laffont CM, Mentré F. Are population pharmacokinetic and/or pharmacodynamic models adequately evaluated? A survey of the literature from 2002 to 2004. Clin Pharmacokinet. 2007;46:221–234. doi: 10.2165/00003088-200746030-00003. [DOI] [PMC free article] [PubMed] [Google Scholar]
- 45.Jolling K, Perez Ruixo JJ, Hemeryck A, Vermeulen A, Greway T. Mixed-effects modelling of the interspecies pharmacokinetic scaling of pegylated human erythropoietin. Eur J Pharm Sci. 2005;24:465–475. doi: 10.1016/j.ejps.2005.01.002. [DOI] [PubMed] [Google Scholar]
- 46.Kauffman RE, Kearns GL. Pharmacokinetic studies in paediatric patients. Clinical and ethical considerations. Clin Pharmacokinet. 1992;23:10–29. doi: 10.2165/00003088-199223010-00002. [DOI] [PubMed] [Google Scholar]
- 47.Przepiorka D, Blamble D, Hilsenbeck S, Danielson M, Krance R, Chan KW. Tacrolimus clearance is age-dependent within the pediatric population. Bone Marrow Transplant. 2000;26:601–605. doi: 10.1038/sj.bmt.1702588. [DOI] [PubMed] [Google Scholar]
- 48.Hojs R, Bevc S, Ekart R, Gorenjak M, Puklavec L. Serum cystatin C as an endogenous marker of renal function in patients with mild to moderate impairment of kidney function. Nephrol Dial Transplant. 2006;21:1855–1862. doi: 10.1093/ndt/gfl073. [DOI] [PubMed] [Google Scholar]
- 49.Dharnidharka VR, Kwon C, Stevens G. Serum cystatin C is superior to serum creatinine as a marker of kidney function: A meta-analysis. Am J Kidney Dis. 2002;40:221–226. doi: 10.1053/ajkd.2002.34487. [DOI] [PubMed] [Google Scholar]
- 50.Koenig W, Twardella D, Brenner H, Rothenbacher D. Plasma concentrations of cystatin C in patients with coronary heart disease and risk for secondary cardiovascular events: More than simply a marker of glomerular filtration rate. Clin Chem. 2005;51:321–327. doi: 10.1373/clinchem.2004.041889. [DOI] [PubMed] [Google Scholar]
- 51.Villa P, Jiménez M, Soriano MC, Manzanares JP. Serum cystatin C concentration as a marker of acute renal dysfunction in critically ill patients. Crit Care. 2005;9:R139–R143. doi: 10.1186/cc3044. [DOI] [PMC free article] [PubMed] [Google Scholar]
- 52.Zaffanello M, Franchini M, Fanos V. Is serum Cystatin-C a suitable marker of renal function in children? Ann Clin Lab Sci. 2007;37:233–240. [PubMed] [Google Scholar]
- 53.Cordeiro VF, Pinheiro DC, Silva GB, Jr, Lima JW, Mota RM, Libório AB, Daher EF. Comparative study of cystatin C and serum creatinine in the estimative of glomerular filtration rate in children. Clin Chim Acta. 2008;391:46–50. doi: 10.1016/j.cca.2008.02.004. [DOI] [PubMed] [Google Scholar]
- 54.Kurzawski M, Droździk M. Pharmacogenetics in solid organ transplantation: Genes involved in mechanism of action and pharmacokinetics of immunosuppressive drugs. Pharmacogenomics. 2013;14:1099–1118. doi: 10.2217/pgs.13.89. [DOI] [PubMed] [Google Scholar]
- 55.Haufroid V, Mourad M, Van Kerckhove V, Wawrzyniak J, De Meyer M, Eddour DC, Malaise J, Lison D, Squifflet JP, Wallemacq P. The effect of CYP3A5 and MDR1 (ABCB1) polymorphisms on cyclosporine and tacrolimus dose requirements and trough blood levels in stable renal transplant patients. Pharmacogenetics. 2004;14:147–154. doi: 10.1097/00008571-200403000-00002. [DOI] [PubMed] [Google Scholar]
- 56.Hesselink DA, van Schaik RH, van der Heiden IP, van der Werf M, Gregoor PJ, Lindemans J, Weimar W, van Gelder T. Genetic polymorphisms of the CYP3A4, CYP3A5, and MDR-1 genes and pharmacokinetics of the calcineurin inhibitors cyclosporine and tacrolimus. Clin Pharmacol Ther. 2003;74:245–254. doi: 10.1016/S0009-9236(03)00168-1. [DOI] [PubMed] [Google Scholar]
- 57.Kuypers DR, de Jonge H, Naesens M, Vanrenterghem Y. A prospective, open-label, observational clinical cohort study of the association between delayed renal allograft function, tacrolimus exposure, and CYP3A5 genotype in adult recipients. Clin Ther. 2010;32:2012–2023. doi: 10.1016/j.clinthera.2010.11.010. [DOI] [PubMed] [Google Scholar]
- 58.Quteineh L, Verstuyft C, Furlan V, Durrbach A, Letierce A, Ferlicot S, Taburet AM, Charpentier B, Becquemont L. Influence of CYP3A5 genetic polymorphism on tacrolimus daily dose requirements and acute rejection in renal graft recipients. Basic Clin Pharmacol Toxicol. 2008;103:546–552. doi: 10.1111/j.1742-7843.2008.00327.x. [DOI] [PubMed] [Google Scholar]
Associated Data
This section collects any data citations, data availability statements, or supplementary materials included in this article.
Data Availability Statement
The datasets used and/or analyzed during the current study are available from the corresponding author on reasonable request.