Abstract
Solventogenic clostridia are an important class of microorganisms that can produce various biofuels. One of the bottlenecks in engineering clostridia stems from the fact that central metabolic pathways remain poorly understood. Here, we utilized the power of 13C-based isotopomer analysis to re-examine central metabolic pathways of C. acetobutylicum ATCC 824. We demonstrate using [1,2-13C]glucose, mass spectrometry analysis of intracellular metabolites, and enzymatic assays that C. acetobutylicum has a split TCA cycle where only Re-citrate synthase contributes to the production of α-ketoglutarate via citrate. Furthermore, we show that there is no carbon exchange between α-ketoglutarate and fumarate and that the oxidative pentose-phosphate pathway is inactive. Dynamic gene expression analysis of the putative Re-citrate synthase gene (CAC0970), its operon, and all glycolysis, pentose-phosphate pathway and TCA cycle genes identify genes and their degree of involvement in these core pathways that support the powerful primary metabolism of this industrial organism.
Keywords: Citrate synthase, TCA cycle, pentose-phosphate pathway, metabolic flux analysis, gene expression analysis
Solventogenic clostridia are an important class of microorganisms that can utilize simple and complex carbohydrates to produce various solvents, acids and other products by anaerobic fermentation [1, 2]. The biochemistry of solventogenesis has been extensively reviewed [1–4]; however, central metabolic pathways remain only partially resolved. Recently, two genome-scale metabolic network reconstructions for C. acetobutylicum ATCC 824 were reported [5, 6]. Based on its genome sequence [4], it is accepted that in C. acetobutylicum the TCA cycle is degenerate (incomplete) and the oxidative branch of the pentose-phosphate pathway (oxPPP) is missing. Notably, given the inability to identify enzymes needed for the conversion of succinate to fumarate, succinyl-CoA to succinate, and oxaloacetate to citrate (a citrate synthase, CS), the biosynthesis of α-ketoglutarate, a precursor for glutamate, glutamine and proline, remains unknown. The two genome-scale models propose two different pathways for α-ketoglutarate biosynthesis. Senger and Papoutsakis hypothesized a previously unresolved pathway involving the urea cycle and arginine biosynthesis pathway operating in the reverse direction [5], and Lee et al. hypothesized that C. acetobutylicum has a reductive TCA cycle operating in the direction from oxaloacetate to fumarate and to α-ketoglutarate [6]. However, there is limited experimental evidence to support either hypothesis. Given that the missing proteins may be coded by previously unidentifiable proteins raises the possibility that the accepted hypotheses regarding these key steps of central metabolism require a careful re-examination. We undertook this re-examination driven by the recent discovery of a novel Re-CS in C. kluyveri, which has an identifiable ortholog (CAC0970) in C. acetobutylicum, and the power of 13C-based isotopomer analysis for in vivo flux analysis [7–9]. Here, we show that C. acetobutylicum indeed utilizes Re-CS to produce α-ketoglutarate via citrate, that oxPPP is inactive, and that there is no carbon exchange between α-ketoglutarate and fumarate in the TCA cycle.
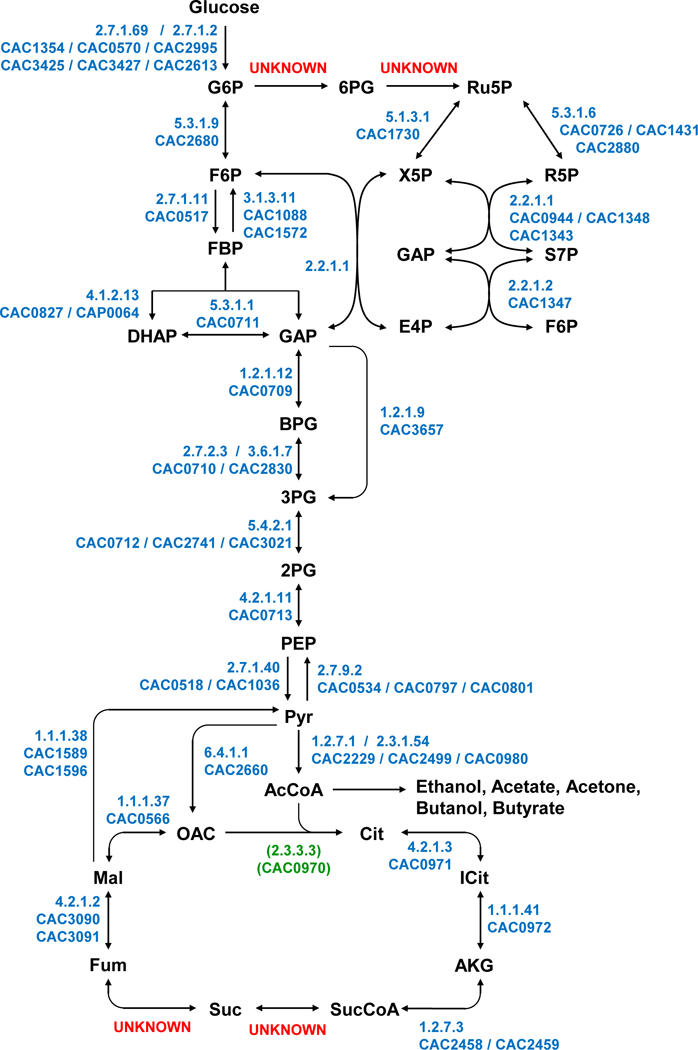
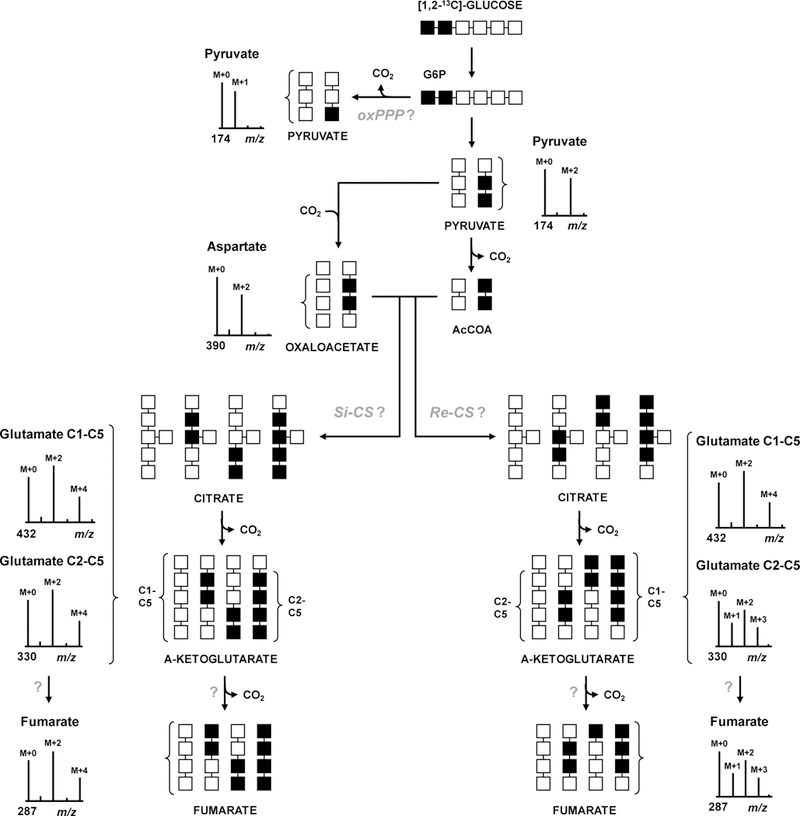
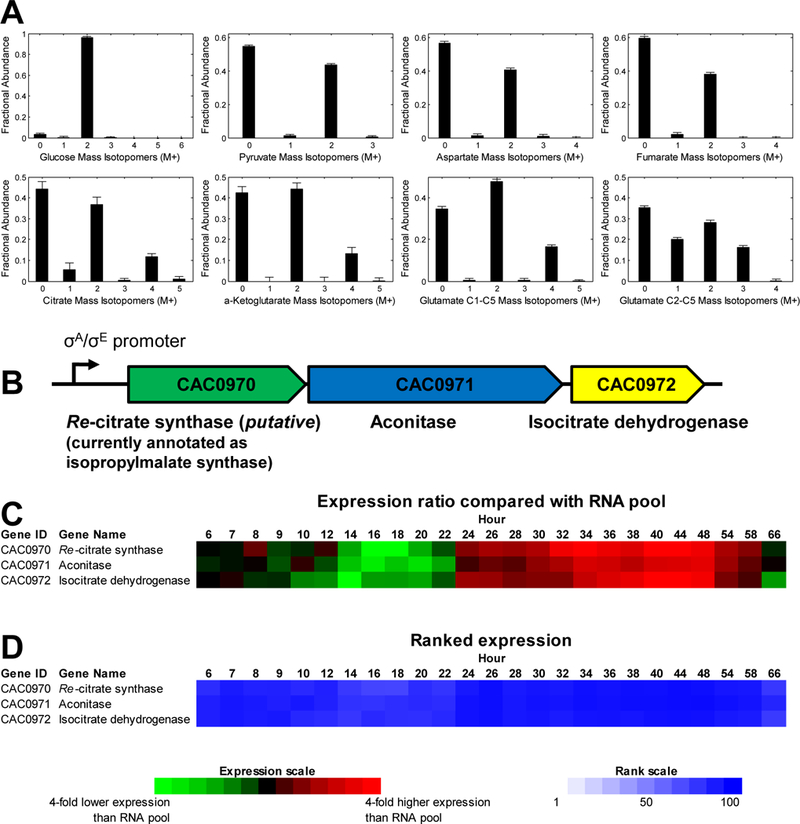
We used Metran software [8, 10] to design a tracer experiment to elucidate the metabolic pathways in the putative network model (Fig. 1). The optimal tracer was determined to be [1,2-13C]glucose. Figure 2 illustrates the strategy for pathway elucidation from mass isotopomer distributions (MID) of intracellular metabolites that can be measured by GC-MS (see Supporting Information). C. acetobutylicum was grown anaerobically to mid-exponential phase in batch culture on defined clostridial growth medium CGM [11] with 20 g/L [1,2-13C]glucose (99%) as the only carbon source. After 14 hrs, the cells produced 35±3 mM acetate and 21±1 mM butyrate. Only low levels of solvents were detected (6.8±1.4 mM ethanol, 1.1±0.2 mM butanol, and 1.5±0.2 mM acetone), indicating that the cells were in the acetogenic phase and had just initiated solvent production. The labeling of glucose in the medium and intracellular metabolites was measured by GC-MS (Waters Quattro-Micro) after tert-butyldimethylsilyl derivatization [10, 12] (Fig. 3A). MIDs of pyruvate, aspartate and fumarate were almost identical with M+2 (~40%) as the only enriched mass isotopomer. Loss of C1 of glucose in oxPPP would have resulted in M+1 enriched pyruvate. Thus, the absence of M+1 mass isotopomer indicated that oxPPP was inactive, as had been originally hypothesized [4].
Figure 1. Central metabolic pathways of C. acetobutylicum based on the original genome annotation [4] and two recently constructed genome-scale models of C. acetobutylicum ATCC 824 [5, 6].

Unresolved or hypothesized pathways/reactions are indicated as UNKNOWN. The proposed/putative gene (CAC0970) coding for Re-citrate synthase is shown.
Figure 2. 13C-Labeling experiment designed to elucidate central metabolic pathways in C. acetobutylicum.

C. acetobutylicum is grown on [1,2-13C2]glucose as the sole carbon source (■=13C, □=12C). The expected labeling profiles and MIDs of intracellular metabolites at key points in metabolism are shown. Presence or absence of oxPPP is determined from the labeling of pyruvate. Condensation of M+2 labeled oxaloacetate and acetyl-CoA via CS will result in a characteristic pattern of M+2 and M+4 mass isotopomers of glutamate (m/z 432 fragment). To determine the stereochemistry of CS, MID of glutamate fragment m/z 330 is measured, which retains carbon atoms C2-C5. For Si-CS, MID of m/z 330 fragment of glutamate will be identical to that of m/z 432 fragment of glutamate; for Re-CS characteristic M+1 and M+3 isotopomers will be formed. To determine if the TCA cycle is complete, MID of fumarate is compared to that of glutamate fragment m/z 330 and aspartate.
Figure 3. Mass isotopomer distributions of glucose and intracellular metabolites from C. acetobutylicum grown on [1,2-13C2]glucose, and putative Re-citrate synthase in C. acetobutylicum ATCC 824.

(A) MIDs of glucose, pyruvate, aspartate, fumarate, citrate, α-ketoglutarate, and two fragments of glutamate, m/z 432 fragment (C1-C5) and m/z 330 fragment (C2-C5). Data shown were corrected for natural isotope enrichments. (B) Re-citrate synthase is putatively coded by CAC0970 which is part of the tricistronic operon CAC0970–0971-0972. (C) Expression values are presented as ratios compared to a reference mRNA pool [15]. (D) Level of expression as measured by the ranked expression intensity values for each gene. Ranks run from 100 to 1 based on all the expressed genes of the genome at each time point.
MIDs of citrate, α-ketoglutarate, and glutamate had labeling patterns with M+2 (~37–48%) and M+4 (~16%) as the main enriched mass isotopomers. This labeling pattern suggested that the metabolites were formed by condensation of two ~40% M+2 labeled species, presumably acetyl-CoA and oxaloacetate by CS. The expected M+2 enrichment was 2×0.4×(1–0.4) = 0.48, and the expected M+4 enrichment was 0.4×0.4 = 0.16 (Fig. 2). The labeling pattern of glutamate fragment C2-C5 was characterized by M+1, M+2 and M+3 mass isotopomers, which was consistent with citrate being formed by Re-CS (Fig. 2), as Si-CS would have resulted in formation of M+2 and M+4 mass isotopomers. To examine the completeness of the TCA cycle, fumarate labeling was analyzed. Fumarate labeling was identical to that of aspartate indicating that there was no carbon flow from α-ketoglutarate to fumarate, as that would have produced M+1 and M+3 mass isotopomers of fumarate. Moreover, we concluded that there was no carbon flow from fumarate to α-ketoglutarate, as that would have produced higher abundance of M+2 mass isotopomer of glutamate.
Cell-free protein extracts were assayed for CS activity using a commercial kit (Sigma-Aldrich). The specific CS activity in the presence of MnCl2 (presumably then the Re-CS activity [13]), was 0.55±0.08 U/mg of total-cell-protein over its corresponding control without oxaloacetate. The specific enzyme activity was reduced to 0.20 U/mg of protein when 30 μl of cell-free protein extracts were treated with a final concentration of 0.3 mM EDTA. This observation suggested the possibility of small levels of non-metal dependent, Si-CS activity, although we could not ascertain that EDTA would remove the metal cofactor from the presumed Re-CS protein with 100% effectiveness. Si-CS activity would not be consistent with the 13C-tracer data (Figs. 2 and 3A). Metal dependent CS activity was restored to levels similar to those observed without EDTA treatment upon adding 0.5 mM of MnCl2 to the reaction mixture that was treated with EDTA. This further supported the assumption that most of the CS activity was derived from the Re-CS enzyme.
The gene coding for this activity has been tentatively identified as CAC0970 and is the first gene of a putative tricistronic operon (CAC0970–0971-0972) [13, 14], with the last two genes coding for aconitase and isocitrate dehydrogenase (Fig. 3B). These three genes code for the proteins catalyzing three sequential reactions of the TCA cycle (Fig. 1). The expression of these genes based on microarray studies [15] appears to be similar (Fig. 3C-D), thus supporting the prediction that the genes belong to the same operon. This operon is expressed well, and apparently at higher levels in the stationary phase of culture, which is consistent with the predicted σE promoter for this operon [14]. We also examined the gene expression patterns (Fig. S1) of all the genes putatively identified (Fig. 1) to support the reactions of glycolysis, pentose-phosphate pathway and TCA cycle. The goal was to examine the extent to which these expression patterns and levels were consistent with each other within each of the three pathways, identify which among possible multiple genes are likely involved in a reaction, and if a reaction is likely to operate in a particular stage of the fermentation. While there is no perfect correlation between gene expression and fluxes, previous analysis has shown [16] that gene expression analysis is consistent with results from flux analysis. Overall, most of the pentose-phosphate pathway genes are expressed low, while all identifiable core TCA genes appear to be expressed at high levels and apparently in a synchronized fashion.
The results from this work are significant because they provide a solid basis for future studies of C. acetobutylicum using 13C-metabolic flux analysis [17–20]. In addition, our work identifies new targets for metabolic engineering of energy metabolism in C. acetobutylicum with implications for biofuel production. In particular, metabolic engineering of the TCA cycle is a potential strategy for improving biofuel yield now that it is possible to achieve limited growth of C. acetobutylicum under microaerobic conditions by manipulating the expression of the peroxide repressor-like perR gene [2, 21]. Growth under microaeronic conditions may not only simplify bioprocessing, but significantly, cells may be able to derive biosynthetic energy (ATP) via oxygen utilization. This will have benefits for solvent production and especially the butanol yield by decreasing the need to produce high amounts of acetate for ATP production [2, 22–24].
Supplementary Material
Acknowledgements
This work was supported by the DuPont Young Professor Grant to MRA and NSF grant CBET-0853490 to ETP. We thank Daniel Hess for help with the initial tracer experiments and enzyme assay and Shawn Jones for the preparation of Figure 3.
ABBREVIATIONS:
- CS
citrate synthase
- MID
mass isotopomer distribution
- oxPPP
oxidative pentose-phosphate pathway
Footnotes
Conflict of interest statement
The authors have declared no conflict of interest.
Note by the Authors. An earlier version of this manuscript was submitted for publication on June 29, 2010. On July 9, the manuscript “Systems-level metabolic flux profiling elucidates a complete, bifurcated TCA cycle in Clostridium acetobutylicum” (doi:10.1128/JB.00490-10) by Amador-Noguez et al., appeared in Journal of Bacteriology under Manuscripts published ahead of print. The Amador-Noguez et al. manuscript presents similar results and conclusions to our analysis.
REFERENCES
- [1].Jones DT, Woods DR, Acetone-butanol fermentation revisited. Microbiol. Rev. 1986, 50, 484–524. [DOI] [PMC free article] [PubMed] [Google Scholar]
- [2].Papoutsakis ET, Engineering solventogenic clostridia. Curr. Opin. Biotechnol. 2008, 19, 420–429. [DOI] [PubMed] [Google Scholar]
- [3].Durre P, New insights and novel developments in clostridial acetone/butanol/isopropanol fermentation. Appl. Microbiol. Biotechnol. 1998, 49, 639–648. [Google Scholar]
- [4].Nolling J, Breton G, Omelchenko MV, Makarova KS, et al. , Genome sequence and comparative analysis of the solvent-producing bacterium Clostridium acetobutylicum. J. Bacteriol. 2001, 183, 4823–4838. [DOI] [PMC free article] [PubMed] [Google Scholar]
- [5].Senger RS, Papoutsakis ET, Genome-scale model for Clostridium acetobutylicum: Part I. Metabolic network resolution and analysis. Biotechnol. Bioeng. 2008, 101, 1036–1052. [DOI] [PMC free article] [PubMed] [Google Scholar]
- [6].Lee J, Yun H, Feist AM, Palsson BO, Lee SY, Genome-scale reconstruction and in silico analysis of the Clostridium acetobutylicum ATCC 824 metabolic network. Appl. Microbiol. Biotechnol. 2008, 80, 849–862. [DOI] [PubMed] [Google Scholar]
- [7].Antoniewicz MR, Kelleher JK, Stephanopoulos G, Elementary metabolite units (EMU): a novel framework for modeling isotopic distributions. Metab. Eng. 2007, 9, 68–86. [DOI] [PMC free article] [PubMed] [Google Scholar]
- [8].Antoniewicz MR, Kelleher JK, Stephanopoulos G, Determination of confidence intervals of metabolic fluxes estimated from stable isotope measurements. Metab. Eng. 2006, 8, 324–337. [DOI] [PubMed] [Google Scholar]
- [9].Antoniewicz MR, Kraynie DF, Laffend LA, Gonzalez-Lergier J, et al. , Metabolic flux analysis in a nonstationary system: fed-batch fermentation of a high yielding strain of E. coli producing 1,3-propanediol. Metab. Eng. 2007, 9, 277–292. [DOI] [PMC free article] [PubMed] [Google Scholar]
- [10].Yoo H, Antoniewicz MR, Stephanopoulos G, Kelleher JK, Quantifying reductive carboxylation flux of glutamine to lipid in a brown adipocyte cell line. J. Biol. Chem. 2008, 283, 20621–20627. [DOI] [PMC free article] [PubMed] [Google Scholar]
- [11].Wiesenborn DP, Rudolph FB, Papoutsakis ET, Thiolase from Clostridium acetobutylicum ATCC 824 and Its Role in the Synthesis of Acids and Solvents. Appl. Environ. Microbiol. 1988, 54, 2717–2722. [DOI] [PMC free article] [PubMed] [Google Scholar]
- [12].Antoniewicz MR, Kelleher JK, Stephanopoulos G, Accurate assessment of amino acid mass isotopomer distributions for metabolic flux analysis. Anal. Chem. 2007, 79, 7554–7559. [DOI] [PubMed] [Google Scholar]
- [13].Li F, Hagemeier CH, Seedorf H, Gottschalk G, Thauer RK, Re-citrate synthase from Clostridium kluyveri is phylogenetically related to homocitrate synthase and isopropylmalate synthase rather than to Si-citrate synthase. J. Bacteriol. 2007, 189, 4299–4304. [DOI] [PMC free article] [PubMed] [Google Scholar]
- [14].Paredes CJ, Rigoutsos I, Papoutsakis ET, Transcriptional organization of the Clostridium acetobutylicum genome. Nucleic. Acids Res. 2004, 32, 1973–1981. [DOI] [PMC free article] [PubMed] [Google Scholar]
- [15].Jones SW, Paredes CJ, Tracy B, Cheng N, et al. , The transcriptional program underlying the physiology of clostridial sporulation. Genome. Biol. 2008, 9, R114. [DOI] [PMC free article] [PubMed] [Google Scholar]
- [16].Tummala SB, Junne SG, Paredes CJ, Papoutsakis ET, Transcriptional analysis of product-concentration driven changes in cellular programs of recombinant Clostridium acetobutylicum strains. Biotechnol. Bioeng. 2003, 84, 842–854. [DOI] [PubMed] [Google Scholar]
- [17].Salimi F, Zhuang K, Mahadevan R, Genome-scale metabolic modeling of a clostridial co-culture for consolidated bioprocessing. Biotechnol. J. 2010, 5, 726–738. [DOI] [PubMed] [Google Scholar]
- [18].Ranganathan S, Maranas CD, Microbial 1-butanol production: Identification of non-native production routes and in silico engineering interventions. Biotechnol. J. 2010, 5, 716–725. [DOI] [PubMed] [Google Scholar]
- [19].Senger RS, Biofuel production improvement with genome-scale models: The role of cell composition. Biotechnol. J. 2010, 5, 671–685. [DOI] [PubMed] [Google Scholar]
- [20].Young JD, Walther JL, Antoniewicz MR, Yoo H, Stephanopoulos G, An elementary metabolite unit (EMU) based method of isotopically nonstationary flux analysis. Biotechnol. Bioeng. 2008, 99, 686–699. [DOI] [PubMed] [Google Scholar]
- [21].Hillmann F, Doring C, Riebe O, Ehrenreich A, et al. , The Role of PerR in O-2-Affected Gene Expression of Clostridium acetobutylicum. J. Bacteriol. 2009, 191, 6082–6093. [DOI] [PMC free article] [PubMed] [Google Scholar]
- [22].Sillers R, Al-Hinai MA, Papoutsakis ET, Aldehyde-alcohol dehydrogenase and/or thiolase overexpression coupled with CoA transferase downregulation lead to higher alcohol titers and selectivity in Clostridium acetobutylicum fermentations. Biotechnol. Bioeng. 2009, 102, 38–49. [DOI] [PubMed] [Google Scholar]
- [23].Sillers R, Chow A, Tracy B, Papoutsakis ET, Metabolic engineering of the non-sporulating, non-solventogenic Clostridium acetobutylicum strain M5 to produce butanol without acetone demonstrate the robustness of the acid-formation pathways and the importance of the electron balance. Metab. Eng. 2008, 10, 321–332. [DOI] [PubMed] [Google Scholar]
- [24].Lee JY, Jang YS, Lee J, Papoutsakis ET, Lee SY, Metabolic engineering of Clostridium acetobutylicum M5 for highly selective butanol production. Biotechnol. J. 2009, 4, 1432–1440. [DOI] [PubMed] [Google Scholar]
Associated Data
This section collects any data citations, data availability statements, or supplementary materials included in this article.


