

Abstract
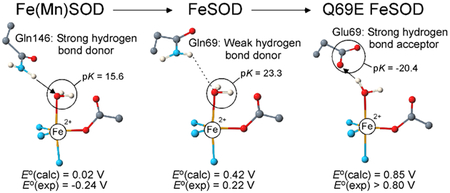
In Fe- and Mn-dependent superoxide dismutases (SODs), second-sphere residues have been implicated in precisely tuning the metal ion reduction potential to maximize catalytic activity (Vance, C. K.; Miller, A.-F. J. Am. Chem. Soc. 1998, 120, 461–467). In the present study, spectroscopic and computational methods were used to characterize three distinct Fe-bound SOD species that possess different second coordination spheres and, consequently, Fe3+/2+ reduction potentials that vary by ~1 V; namely, FeSOD, Fe-substituted MnSOD (Fe(Mn)SOD), and the Q69E FeSOD mutant. Despite having markedly different metal ion reduction potentials, FeSOD, Fe(Mn)SOD, and Q69E FeSOD exhibit virtually identical electronic absorption, circular dichroism, and magnetic circular dichroism (MCD) spectra in both their oxidized and reduced states. Likewise, variable-temperature variable-field MCD data obtained for the oxidized and reduced species do not reveal any significant electronic, and thus geometric variations within the Fe ligand environment. To gain insight into the mechanism of metal ion redox tuning, complete enzyme models for the oxidized and reduced states of all three Fe-bound SOD species were generated using combined quantum mechanics/molecular mechanics (QM/MM) geometry optimizations. Consistent with our spectroscopic data, density functional theory computations performed on the corresponding active-site models predict that the three SOD species share similar active site electronic structures in both their oxidized and reduced states. By using the QM/MM-optimized active-site models in conjunction with the conductor-like screening model to calculate the proton-coupled Fe3+/2+ reduction potentials, we found that different hydrogen-bonding interactions with the conserved second-sphere Gln (changed to Glu in Q69E FeSOD) greatly perturb the pK of the Fe-bound solvent ligand and, thus, drastically affect the proton-coupled metal ion reduction potential.
Graphical Abstract
Numerous spectroscopic and computational methods were used to characterize the Fe superoxide dismutase (FeSOD), Fe-substituted Mn superoxide dismutase (Fe(Mn)SOD), and the Q69E FeSOD mutant. Despite having virtually identical active-site structures, these species possess Fe3+/2+ reduction potentials that differ by ~1 V. The results obtained in this study provide compelling evidence that this difference primarily stems from different hydrogen-bonding interactions with second-sphere residues, which modulate the pK of the Fe-bound solvent ligand that accepts a proton upon metal-ion reduction.
1. Introduction
Superoxide dismutases (SODs) are metalloenzymes that defend biological systems against oxidative damage caused by the superoxide radical anion (O2•–) that is generated during aerobic metabolism.1 Oxidative stress resulting from the superoxide radical has been implicated in numerous neuronal degenerative diseases such as Alzheimer’s and Parkinson’s diseases, as well as familial amyotrophic lateral sclerosis.2, 3 Several distinct classes of SODs are known that differ with respect to their metal cofactor: Cu/Zn-, Fe- and MnSODs, along with the more recently discovered NiSOD.1, 4, 5 Fe- and MnSODs, like all SODs, disproportionate O2•– to O2 and H2O2 (eq 1). In this so-called ping-pong mechanism the metal ion, M, corresponding to Fe or Mn, cycles between the +3 and +2 oxidation states.6, 7
| (1-a) |
| (1-b) |
While unrelated to the Cu/Zn- and NiSODs, the Fe- and Mn-containing SODs are structurally homologous.8–10 It has been known for more than two decades that Fe- and MnSODs not only share similar amino acid sequences and basic protein folds, but also possess virtually identical active-site structures.11–13 In both enzymes the active-site metal ion is in a trigonal bipyramidal ligand environment consisting of one aspartate, three histidines, and a solvent molecule that is believed to be OH– in the oxidized state and H2O in the reduced state (Figure 1).14 Nonetheless, for the E. coli enzymes incorporation of Fe into the MnSOD protein and Mn into the FeSOD protein matrices so as to generate Fe-substituted MnSOD (Fe(Mn)SOD) and Mn-substituted FeSOD (Mn(Fe)SOD), respectively, results in enzymes that display less than 1% activity relative to wild type (WT) Fe- and MnSODs under standard conditions.15–18 Note that in some other organisms, however, so-called cambialistic SODs are present that display significant catalytic activity with either Fe or Mn bound.19–25 Several factors have been proposed to contribute to the strict metal ion specificities of the E. coli Fe- and MnSODs: (i) the increased affinity of Fe3+(Mn)SOD for hydroxide makes this species more susceptible to competitive inhibition by OH- at physiological pH,23, 26–28 (ii) the active site adopts a distorted geometry when the non-native metal is incorporated,13, 28 and (iii) metal-substituted SODs have inappropriate reduction potentials for catalytic turnover.18, 29 Indeed, studies by Vance and Miller revealed that Fe(Mn)SOD and Mn(Fe)SOD possess too low and too high a reduction potential (E°), respectively, to catalyze both half-reactions in eq 1.18, 29 Qualitatively, this result can be understood in terms of the considerably higher 3+/2+ redox potentials typically observed for Mn complexes relative to their Fe analogues;30, 31 thus, the MnSOD protein must depress the E° of its metal ion to a much greater extent than the FeSOD protein in order to produce the observed similar reduction potentials of the native SOD proteins. The reduction potentials of both FeSOD and MnSOD are near 200 mV (vs NHE)18, 29, 32, 33 and thus approximately halfway between the reduction potentials associated with the O2•–/H2O2 and O2/O2•– redox couples (890 and −330 mV vs NHE, respectively),34 thereby ensuring similar driving forces for the oxidative and reductive steps (eqs 1-a and 1-b, respectively). Indeed, the rates of O2•– oxidation and reduction by FeSOD were shown to be comparable, whereas for Fe(Mn)SOD the rate of reduction of O2•– by Fe2+(Mn)SOD was found to be much faster than the rate of O2•– oxidation, consistent with Fe(Mn)SOD’s much lower E°.7, 29 The structural and electronic basis for the markedly different redox tuning applied by the FeSOD and MnSOD proteins is an enduring subject of intense research.1, 35
Figure 1.
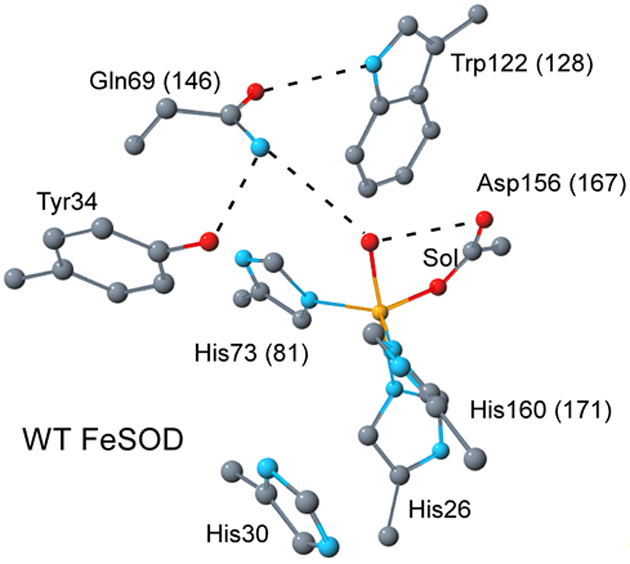
Active-site model of E. coli FeSOD based on the 1ISA pdb file.12 Hydrogen-bonding interactions are represented by dashed lines. Residue numbers for E. coli MnSOD are shown in parentheses.13
Recently, we proposed that different hydrogen-bonding interactions between second-sphere amino-acid residues and the metal ion’s coordinated solvent molecule (Figure 1) contribute to the very different redox tuning in E. coli FeSOD and MnSOD.29, 36–38 Preliminary density functional theory (DFT) calculations on truncated active-site models of FeSOD and Fe(Mn)SOD37 indicated that the closer proximity of the active site Gln side chain to the coordinated solvent in the (Mn)SOD protein matrix favors metal-bound OH- over H2O, thus strongly stabilizing the Fe3+ state over the Fe2+ state. This prediction is in qualitative agreement with the strongly depressed E° of −240 mV (vs NHE) measured experimentally for Fe(Mn)SOD.29 It also concurs nicely with the recent proposal that the second-sphere Gln is primarily responsible for redox tuning, whereas other second-sphere residues, in particular Tyr34 and His30, are crucial for proton transport and substrate specificity (Figure 1).39–43
Provided that redox tuning in FeSOD and MnSOD indeed involves modulation of the degree by which a given protonation state of the solvent ligand is stabilized, changing the hydrogen bond donating second-sphere Gln (Figure 1) to a hydrogen bond accepting residue should substantially raise E° by favoring the H2O-bound Fe2+ state over the OH--bound Fe3+ state. This hypothesis was recently verified experimentally by constructing the Q69E FeSOD mutant in which Gln69 was replaced by the hydrogen-bond acceptor Glu.37 While this Gln → Glu substitution did not produce a gross disruption of the active site,38 the Q69E FeSOD mutant was found to have less than 1 % activity compared to WT FeSOD. In support of our hypothesis regarding the role of residue 69 in active site redox tuning, the Q69E FeSOD mutant was isolated in the reduced state, in contrast to WT FeSOD, which is in the ferric state when exposed to air. Even exposure to O2•– did not result in the oxidation of the ferrous ion in Q69E FeSOD, indicating that the E° for this mutant is greater than that of O2•–.37 Indeed, strong oxidants such as potassium permanganate were necessary to obtain the Q69E Fe3+SOD species.38 This enormous increase in E° (by apparently > 600 mV) for the Fe3+/2+ couple in Q69E FeSOD provides an interesting contrast to the large decrease in E° (by ~300 mV) when Fe is incorporated into the (Mn)SOD protein matrix. Thus FeSOD, Q69E FeSOD, and Fe(Mn)SOD provide a set of homologous proteins that are almost ideally suited for investigating how the (Fe)SOD and (Mn)SOD protein matrices differently tune the E° of their active site metal ion.
In this study, we have built upon our previous work on FeSOD, Fe(Mn)SOD, and Q69E FeSOD to develop a more quantitative understanding of why the Fe3+/2+ redox couple for these three species spans a range of ~1 V despite the fact that in each case the Fe cofactor contains the same set of active-site ligands. To experimentally characterize both the oxidized and reduced states of all three enzymes, electronic absorption (Abs), circular dichroism (CD), and magnetic circular dichroism (MCD) spectroscopies were employed. These methods offer sensitive probes of the metal-ion environment and thus can aid in identifying differences in the active site geometric and electronic properties of the three Fe-bound SOD species that would not readily be detectable by X-ray crystallographic methods. To complement our spectroscopic studies, active-site models were generated using the combined quantum mechanics/molecular mechanics (QM/MM) methodology, where the optimized models were validated on the basis of our experimental data. Using an approach similar to the one developed by Noodleman and co-workers,44 the free energies for the proton-coupled reduction potentials of our QM/MM-generated active-site models were calculated to assess how differences in the second coordination sphere affect the electron-transfer and proton-transfer steps and thus the E° values.
2. Experimental
2.1. Protein Species.
Wild type FeSOD was overexpressed in E. coli and purified as described previously.45, 46 The specific activity of the protein used in this study was ~7000 units/mg of protein per minute, and the Fe content was ~2.2 Fe/protein dimer based on the absorbance at 350 nm and the published extinction coefficients.45 Fe(Mn)SOD was prepared according to published procedures.47 In short, MnSOD was treated with guanidine hydrochloride and EDTA to generate partially unfolded apo-MnSOD that was subsequently reconstituted with Fe. To reduce as-isolated (i.e., oxidized) WT Fe3+SOD and Fe3+(Mn)SOD to the Fe2+ state, solutions ~1 mM in SOD protein were purged with Ar for ~30 min in sealed vials and subsequently incubated with a two-fold molar excess of freshly prepared dithionite in 100 mM potassium hydroxide.
The gene for Q69E FeSOD was constructed by polymerase chain reaction using the megaprimer method.48 Both strands of the mutant gene were sequenced to confirm mutation of the CAG codon for Gln to GAG for Glu and to ascertain that no additional mutations had occurred. The mutant protein was expressed and isolated according to established procedures.45, 46 Consistent with the conservative nature of the amino acid substitution, the Q69E FeSOD mutant was found to bind ~2 Fe/protein dimer (determined on the basis of a colorimetric assay49 and atomic absorption measurements, and using the ε280 of FeSOD45). Oxidized Q69E Fe3+SOD was prepared by incubating as-isolated (i.e., reduced) protein with 1 equivalent of KMnO4.
2.2. Spectroscopy.
Variable-temperature Abs, CD, and MCD spectra were recorded on a Jasco J-715 spectropolarimeter in conjunction with an Oxford Instruments SM-4000 8T magnetocryostat. To eliminate contributions from the natural CD to the MCD signal, the difference was taken between data obtained with the magnetic field aligned parallel and anti-parallel to the light propagation axis. All samples were prepared in 50 mM potassium phosphate buffer (pH 7.0) in the presence of 55% (v/v) glycerol to ensure glass formation upon freezing. To reduce the fraction of the six-coordinate, ferric hydroxide adduct observed for Fe3+(Mn)SOD and Q69E Fe3+SOD at pH 7.0, additional samples of these species were prepared in 50 mM MES buffer (pH 6.0). The protein concentrations used in our experiments are given in the figure captions. Variable-temperature variable-field (VTVH) MCD data were collected by measuring the MCD intensity as a function of the magnetic field at a fixed temperature and wavelength.
2.3. Computations.
2.3.1. QM/MM geometry optimizations.
The QM/MM methodology as implemented in ADF 2006 was used to generate complete protein models for FeSOD, Fe(Mn)SOD, and Q69E FeSOD. For all geometry optimizations, only one of the two protein subunits was considered. The QM region contained the metal ion, all protein ligands, and coordinated solvent, as well as the second-sphere residues Tyr34 and Gln69 (Glu69 and Gln146 in Q69E FeSOD and Fe(Mn)SOD, respectively, see Figure 1). Moreover, Trp122 (Trp128 for Fe(Mn)SOD) was added to the QM region to prevent partial unfolding of the protein near the active site, as was observed when Trp122 was treated at the MM level. All amino acid residues included in the QM region were cut off at the Cα atom, thus placing their NH and CO backbone atoms in the MM region. Each input file was generated from suitable crystallographic coordinates (PDB files) using the pdb2adf program developed by M. Swart (2002). To calculate the metal ion reduction potentials and the pK values of the solvent ligand in the reduced state, active-site models for three different states were needed: (1) the native Fe3+-bound state with coordinated OH-, (2) the hypothetical Fe2+-bound state with coordinated OH-, and (3) the native Fe2+-bound state with coordinated H2O. For all WT FeSOD models, the X-ray structural data from the 1ISA PDB file (Fe2+SOD) were used to generate input coordinates.12 For Fe(Mn)SOD, two sets of active-site models were generated from two separate PDB files: (1) from the 1MMM PDB file (using the protein subunit containing a five-coordinate active-site Fe3+ center),28 and (2) from the 1VEW PDB file (Mn3+SOD), by replacing Mn with Fe.13 Two different PDB files were also used to generate models for Q69E FeSOD. Because no X-ray crystallographic data are available for Q69E Fe3+SOD, models for this species were generated by QM/MM optimization of the crystal structure coordinates from the 1ISA PDB file after replacing the Gln69 residue with a Glu. For the Q69E Fe2+SOD models, the 2BKB PDB file (Q69E Fe2+SOD) was used as the basis.50 In exploring different possible protonation states for Q69E Fe2+SOD, active-site models were generated by fixing all atoms and only optimizing the coordinates of the solvent ligand, Oε1 and Oε2 of Glu69, and all protons involved in the hydrogen-bond network comprising Tyr34, Glu69, Trp122, and the solvent ligand. In contrast, the Q69E Fe2+SOD models used to calculate E° were fully geometry optimized. The Cartesian coordinates of all active-site models discussed in this paper are provided in the Supporting Information (Tables S1 –S18).
The QM/MM energy minimizations were performed using the ADF 2006 suite of programs on an ACE computer cluster consisting of 64 Intel Xeon processors.51–54 The QM region was treated at the DFT level using an integration constant of 4.0, and the Vosko-Wilk-Nusair local density approximation55 along with the nonlocal gradient corrections of Becke56 and Perdew.57 All QM geometry optimizations were performed by employing the spin-unrestricted formalism and using the ADF uncontracted triple-ζ Slater-type orbitals with one set of polarization functions (ADF basis set IV), where the core orbitals were frozen through 1s (O, N, C), and 2p (Fe). Geometries were considered converged when the maximum energy change between subsequent cycles dropped below 10−3 Hartrees and the maximum Cartesian gradient was less than 10−2 Hartrees/Å. For the MM partitioning, the modified IMOMM scheme of Maseras and Morokuma implemented in ADF (IMOMM/ADF scheme)58 was employed and the MM region was parameterized using the AMBER95 force field.59 The QM/MM-optimized protein models were analyzed using the PROCHECK program to ensure that the bond angles and distances are reasonable.60
2.3.2. Calculation of ground-state and excited-state properties.
The ORCA 2.4 computational package developed by Dr. Frank Neese (Universität Bonn, Germany) was used to perform single-point DFT, time-dependent DFT (TD-DFT), and semiempirical INDO/S-CI calculations on suitably truncated active-site models of all QM/MM geometry optimized protein species.61 For each single-point DFT calculation, the entire QM region of the corresponding QM/MM-optimized protein subunit was used. For the INDO/S-CI calculations, the Fe ion, all of its ligands, and the second-sphere residues Tyr34 and Gln69 (Glu69 and Gln146 in Q69E FeSOD and Fe(Mn)SOD, respectively) were included, while only first-sphere models were used for the TD-DFT calculations. In all cases, the amino-acid residues were truncated at their Cα atoms by replacing the adjacent backbone atoms with H atoms.
For all DFT calculations in ORCA, Becke’s three parameter hybrid functional62, 63 for exchange and the correlation functional of Lee, Yang, and Parr (B3LYP)64 were used. The SV(P) (Ahlrichs polarized split valence) basis65 and SV/C auxiliary basis66 were employed for all atoms except Fe, for which the TZVP (Ahlrichs polarized triple-ζ valence)67 basis was used. Isosurface plots of key MOs were generated using the gOpenMol program developed by Laaksonen with an isodensity value of 0.04 a.u.68, 69 Electronic excitation energies and absorption intensities for all Fe2+ models were computed using the TD-DFT method70–72 within the Tamm-Dancoff approximation73, 74 and employing the same DFT parameters listed above. The resolution of identity approximation was used in calculating the Coulomb term.75 For all models, the 40 lowest-energy excited states were calculated associated with single-electron excitations within ±3 Hartrees of the HOMO/LUMO energies.
For all single-point DFT and TD-DFT calculations within ORCA, the conductor-like screening model (COSMO) developed by Klamt and Schüürmann76 and implemented in ORCA in collaboration with COSMOlogic was employed to account for solvation effects. The dielectric constant, ε, was set to 4.0, although similar results were obtained with an ε of 10.0 (Table S44). In calculating the scaling factor used to compute the screening charges for a specific ε, ƒ(ε) = (ε−1)/(ε+x), the empirical parameter, x, was set to 0.5, which is the default in ORCA. To calculate the radius of the solute molecule (i.e. QM/MM-optimized active-site model), the atomic radii were taken to be 1.2 times the van der Waals radii,77, 78 which corresponds to the following values used by ORCA: Fe, 2.223 Å; C, 2.000 Å; N, 1.830 Å; O, 1.720 Å; H, 1.300 Å.
Semiempirical INDO/S-CI calculations were carried out to compute the ground state properties of all active-site models and the electronic excitation energies and absorption intensities for the Fe3+-containing models. The ORCA program uses the INDO/S-CI model of Zerner and co-workers,79, 80 the valence shell ionization potentials and Slater-Condon parameters listed by Bacon and Zerner,81 and the standard interaction factors ƒpσpσ = 1.266 and ƒpπpπ = 0.585. Restricted open-shell Hartree-Fock (ROHF) SCF calculations were tightly converged on the quintet (Fe2+-bound species) or sextet (Fe3+-bound species) ground state that then served as the reference state for configuration interaction (CI) calculations. For the oxidized species, electronic transition energies and intensities were calculated by including all possible single-electron excitations within the 69 highest-energy doubly-occupied MOs (DOMOs), the 5 singly-occupied MOs (SOMOs), and the 36 lowest-energy virtual MOs. Ground-state calculations additionally included double-electron excitations within the 47 highest-energy DOMOs, all SOMOs and the 4 lowest energy virtual MOs, as well as single-electron excitations among the SOMOs for the quartet states. Ground-state properties for the reduced species were calculated by including all possible single-electron excitations within the 61 highest-energy DOMOs, the 4 SOMOs, and the 35 lowest-energy virtual MOs. Double excitations included the 30 highest-energy DOMOs, the 4 SOMOs, and 9 virtual MOs, and single excitations among the SOMOs were considered for the triplet states. Larger active spaces did not significantly change the calculated ground-state spin Hamiltonian parameters.
2.3.3. Calculation of redox properties.
The method developed by Noodleman and coworkers was used as the basis for calculating the Fe3+/2+ reduction potentials of our active-site models.31, 44, 82 As the reduction of the Fe3+ center is coupled to proton uptake (eq 1-a), the proton-coupled redox potential at pH 7, E°(coupled, pH=7), was calculated using eq 2:
| (2) |
where εPT and εET are the energies (eV) associated with proton transfer and electron transfer, respectively. The energy for electron transfer is the sum of the gas phase ionization potential for the reduced species (IP), the difference in solvation energies for the oxidized and reduced species (Δεsol-ET) and a correction term of −4.43 (V) for the standard hydrogen electrode:
| (3) |
The energy for proton transfer is proportional to the pK of the solvent ligand in the reduced state at pH 7:
| (4) |
| (5) |
where εdeprot is the gas phase deprotonation energy (in kcal/mol), Δεsol-PT is the difference in solvation energies for the protonated and deprotonated states (in kcal/mol), and −268.3 kcal/mol is a correction term containing the solvation and entropic energy contribution for a proton (−260.5 kcal.mol and −7.76 kcal/mol, respectively). ΔZPE is the zero point energy difference between the protonated and deprotonated states; the value of −7.1 kcal/mol reported by Noodleman and coworkers was used for this term.82
The solvation energies, Δεsol-PT and Δεsol-ET, were obtained from DFT COSMO calculations on our active-site models (i.e., the QM region of the QM/MM-optimized structures) using ORCA. Because ORCA integrates the calculation of the screening potential into the DFT SCF cycles, the total energy obtained is not the sum of the gas phase and solvation energies, but rather is a sum of the energy for a polarized QM wavefunction plus the solvation energies. For this reason, the total energy of the system cannot be separated into explicit gas-phase (e.g. IP) and solvation terms (e.g. Δεsol-ET) and hence only total energy differences were used in the calculation of E° and pK. The computed values obtained using ε = 4.0 and 10.0 were identical within 0.04 mV for E° and 2.6 pH units for pK values; thus, only the results obtained with ε = 4.0 are presented in the text.
3. Results and Analysis
3.1. Spectroscopic data.
The active sites of WT FeSOD, Fe(Mn)SOD, and Q69E FeSOD in both their oxidized and reduced states were probed experimentally using Abs, CD, and MCD spectroscopies to investigate possible causes of their vastly different Fe3+/2+ reduction potentials. Because of their distinct selection rules,83 these three spectroscopies provide complementary information that, collectively, yields detailed insight into the geometric and electronic properties of Fe-bound SOD species.
3.1.1. Oxidized species.
The Abs, CD, and MCD spectra of WT Fe3+SOD at pH 7 (Figure 2) are well understood27 and therefore provide an excellent reference point for a comparison with the spectroscopic data of Fe3+(Mn)SOD and Q69E Fe3+SOD. An iterative Gaussian deconvolution of the Abs, CD, and MCD spectra using a minimal number of bands of constant width provides the approximate energies and intensities of the relevant electronic transitions (Table 1). Because of their low intensities in the Abs spectrum, bands 1–3 have been assigned as ligand field (LF) transitions. Even though for high-spin Fe3+ (a d5 ion) all LF transitions are formally both Laporte and spin-forbidden, they can acquire some Abs intensity via spin-orbit coupling.84–86 Conversely, based on their high Abs intensities, bands 4 and 5 have been assigned as ligand-to-metal charge transfer (LMCT) transitions. To identify the ligand involved in these LMCT transitions, VTVH MCD data were collected at 25 840 cm-1. From a quantitative analysis87–89 of these VTVH MCD data using the zero-field splitting (ZFS) parameters of D = −1.7 cm−1 and E/D = 0.24 determined previously on the basis of electron paramagnetic resonance (EPR) data,30 it was shown that both transitions most likely involve electronic excitation from an orbital of the Asp ligand.27
Figure 2.
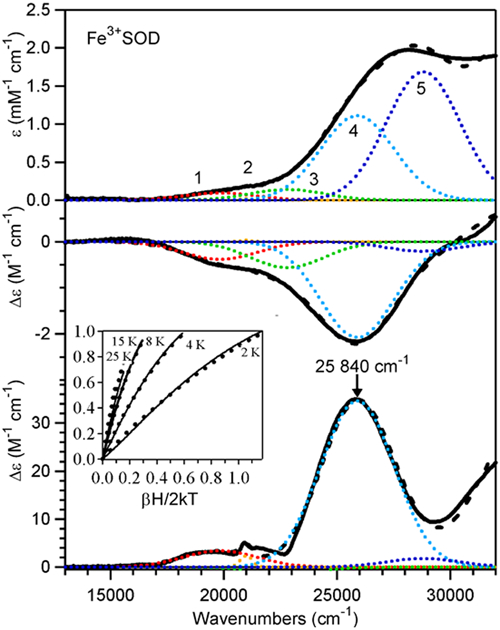
Absorption (top), CD (middle) and MCD (bottom) spectra at 4.5 K (solid lines) of WT Fe3+SOD. Individual Gaussian bands (…) and their sums (---) obtained from an iterative fit are shown for each spectrum. Inset: VTVH MCD data obtained at 25840 cm−1; the simulated data are shown as dots. Sample conditions: [FeSOD] = 1.1 mM in 55% (v/v) glycerol and 50 mM phosphate buffer (pH 7.0).
Table 1.
Band positions (cm−1) and assignments for Fe3+SOD, Fe3+(Mn)SOD, and Q69E Fe3+SODa
| Band | Assignment | Fe3+SOD | Fe3+(Mn)SOD | Q69E Fe3+SOD |
|---|---|---|---|---|
| 1 | d → d | 19 800 | 18 700 | 17 980 |
| 2 | d → d | 21 000 | 21 000 | 21 550 |
| 3 | d → d | 22 800 | 23 000 | 21 800 |
| 4b | Asp → Fe3+ LMCT | 25 900 (fexp = 0.022) | 25 700 (fexp = 0.016) | 25 800 (fexp = 0.027) |
| 5b | Asp → Fe3+ LMCT | 28 800 (fexp = 0.031) | 28 500 (fexp = 0.041) | 29 300 (fexp = 0.052) |
Band positions were obtained from an iterative fit of the Abs, CD, and MCD spectra with a minimum number of Gaussian bands using a full width at half maximum of 3872 cm−1 for bands 1 and 3-5 and 618 cm−1 for band 2.
The oscillator strength is given by fexp.
Abs, CD, and MCD spectra were also obtained for Fe3+(Mn)SOD and Q69E Fe3+SOD. The MCD data are shown in Figure 3 along with those obtained for Fe3+SOD; the Abs and CD spectra are included in the Supporting Information (Figures S1-S2). Despite having significantly different reduction potentials, Fe3+(Mn)SOD and Q69E Fe3+SOD display MCD spectra that are qualitatively similar to the MCD spectrum of Fe3+SOD, each exhibiting a broad, intense feature centered at ~ 26 000 cm−1 with weaker bands at lower energy. Gaussian deconvolutions of the Abs, CD, and MCD spectra of Fe3+(Mn)SOD and Q69E Fe3+SOD reveal that they also contain contributions from at least 5 electronic transitions. By analogy to Fe3+SOD, bands 1–3 are assigned as LF transitions, while bands 4 and 5 are assigned as Asp → Fe3+ CT transitions. The fact that the LMCT transition energies and intensities show little variation from Fe3+SOD to Fe3+(Mn)SOD and Q69E Fe3+SOD indicates that in each case the energy separations between the Fe 3d-based molecular orbitals (MOs) and the Asp frontier MOs are of similar magnitude. Furthermore, the VTVH MCD data of Fe3+(Mn)SOD and Q69E Fe3+SOD display the same saturation behavior as those obtained for Fe3+SOD, signifying comparable ground-state properties for the Fe3+ centers in all three SOD species.
Figure 3.
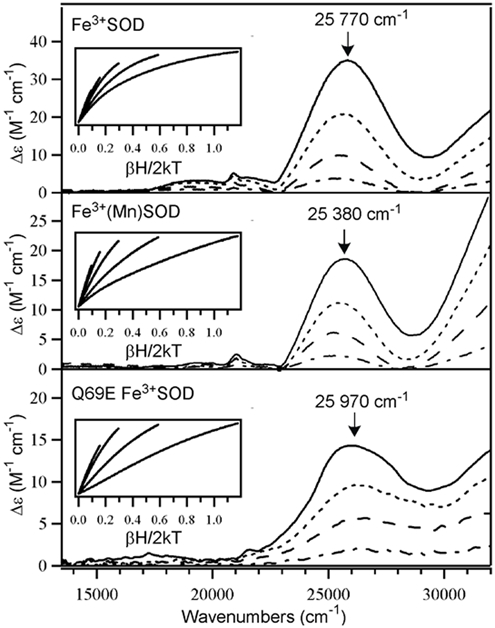
Variable-field (0.5, 1.5, 3.5, and 7 T) MCD spectra at 4.5 K of Fe3+SOD (top), Fe3+(Mn)SOD (middle), and Q69E Fe3+SOD (bottom). Insets: VTVH MCD data obtained at the positions indicated by arrows (collected at 2, 4, 8, 15, and 25 K). Sample conditions: [Fe3+SOD] = 1.4 mM; [Fe3+(Mn)SOD] = 1.1 mM; and [Q69E Fe3+SOD] = 0.85 mM. For Q69E Fe3+SOD and Fe3+(Mn)SOD, data were taken in 50 mM MES buffer (pH 6.0) and for Fe3+SOD, data were taken in 50 mM phosphate buffer (pH 7.0). All samples contained 55% (v/v) glycerol.
The most significant difference in the MCD spectra of Fe3+SOD, Fe3+(Mn)SOD, and Q69E Fe3+SOD is the varying intensity in the near-UV region above 30 000 cm-1. The intensity in this region saturates more rapidly with increasing field than that of the feature at ~26 000 cm−1, suggesting that in each case two distinct species contribute to the MCD spectrum. Indeed, recent pH dependence studies of WT FeSOD revealed that this feature, with a maximum above 32 000 cm−1, is associated with a six-coordinate ferric hydroxide adduct that corresponds to a minority species at neutral pH but becomes the dominant form at high pH.27 Thus, the greater relative intensity in the high-energy region of the Q69E Fe3+SOD and Fe3+(Mn)SOD MCD spectra compared to the WT Fe3+SOD spectrum suggests that larger fractions of six-coordinate Fe3+ centers are present in the former two samples at neutral pH, consistent with EPR studies.23, 47, 50
3.1.2. Reduced species.
The 4.5 K MCD spectra and VTVH MCD data of Fe2+SOD, Fe2+(Mn)SOD, and Q69E Fe2+SOD are shown in Figure 4. The Fe2+SOD MCD spectrum shows a single band centered at ~10 200 cm−1, attributed to the highest-energy LF transition of the ferrous ion.90 Even though this transition occurs at slightly higher energies of ~ 10 500 and 10 700 cm−1 for Fe2+(Mn)SOD and Q69E Fe2+SOD, respectively, this difference is insignificant in comparison to the large difference in reduction potentials, which are on the order of hundreds of mVs. Additionally, all three VTVH MCD data sets exhibit nearly identical saturation behavior,91 suggesting that the Fe2+ centers in all three species possess distorted trigonal bipyramidal coordination environments, consistent with X-ray crystallographic data reported for WT Fe2+SOD12 and Q69E Fe2+SOD.38
Figure 4.
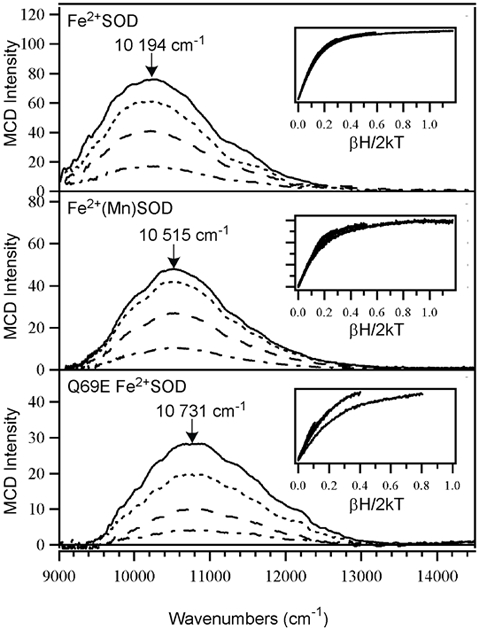
Variable-field (0.5, 1.5, 3.5, and 7 T) MCD spectra at 4.5 K of Fe2+SOD (top), Fe2+(Mn)SOD (middle), and Q69E Fe2+SOD (bottom). Insets: VTVH MCD data obtained at the positions indicated by arrows (collected at 2, 4, 8, 15, and 25 K). Sample conditions: [Fe2+SOD] = 1.4 mM; [Fe2+(Mn)SOD] = 1.1 mM; and [Q69E Fe2+SOD] = 0.85 mM. For Q69E Fe2+SOD and Fe2+(Mn)SOD, data were taken in 50 mM MES buffer (pH 6.0) and for Fe2+SOD, data were taken in 50 mM phosphate buffer (pH 7.0). All samples contained 55% (v/v) glycerol.
Collectively, our spectroscopic data for the oxidized and reduced FeSOD, Fe(Mn)SOD, and Q69E FeSOD species indicate that changes in the positioning or the identity of the conserved second-sphere Gln (Figure 1), while having a dramatic effect on E°, cause remarkably little perturbations of the electronic properties of the active site. Consequently, the strikingly different active site redox tuning accomplished by the FeSOD and MnSOD protein matrices must involve a mechanism other than a direct modulation of the effective nuclear charge or the energy of the “redox-active” molecular orbital (MO) of the bound metal ion.
3.2. Computations.
To generate realistic active-site models for the oxidized and reduced states of the three SOD species investigated, the QM/MM approach was used in geometry optimizations of entire protein subunits (see Experimental section), so as to account for the steric and electrostatic effects of all outer-sphere residues. For the ferrous state, two protonation states of the active sites were considered, one in which the number of protons was the same as the corresponding oxidized species and one where an additional proton was added to coordinated solvent (or residue 69 for Q69E Fe2+SOD). To differentiate between each pair of models described in this paper, the identity of the ligand whose protonation state was varied is indicated as a superscript (e.g. Fe2+SOD with coordinated OH- in the axial position is designated Fe2+SODOH-). In each case, the success of the QM/MM geometry optimization was assessed using the PROCHECK program developed by Laskowski and coworkers.60 This program evaluates multiple structural parameters to score the quality of the input structure (in this case the QM/MM-optimized models), where values above −0.5 are deemed to be acceptable. DFT and INDO/S-CI calculations were then performed to verify that the active sites of these QM/MM-optimized protein models also reproduce our spectroscopic data. Finally, these active-site models were used in conjunction with COSMO methods to explore the origins of the vastly different Fe3+/2+ reduction potentials exhibited by the three SOD species investigated.
3.2.1. Oxidized species.
Fe3+SOD. The computational model generated for Fe3+SOD was derived from the corresponding X-ray crystal-structure coordinates (PDB file 1ISA; similar results were obtained using PDB file 1ISB, see Supporting Information).12 The PROCHECK computed score of −0.32 for this model indicates that the QM/MM-optimized protein structure is reasonable. Consistent with the 1.85 Å resolution X-ray crystal structure and X-ray absorption (XAS) data reported for Fe3+SOD12, 26, Fe retains a trigonal bipyramidal coordination geometry in the QM/MM-optimized structure, and the average Fe–ligand bond length of 2.06 Å is in good agreement with the average bond lengths of 2.03 and 1.98 Å obtained from the XAS and X-ray crystallographic studies, respectively (Table 2). Other important structural parameters, such as the ligand-metal-ligand bond angles and hydrogen-bond distances, also agree well with the experimental data. The most notable difference between the X-ray crystallographic data and the QM/MM-optimized model is the shortening of the N(Gln69)…O(Sol) hydrogen-bond distance from 3.48 Å to 3.08 Å; however, despite this apparent discrepancy, our computations yielded an adequate active-site electronic structure description (vide infra).
Table 2.
Structural parameters (Å) derived from QM/MM-optimized models of oxidized and reduced Fe-bound SOD species
| FeSOD |
Fe(Mn)SOD |
Q69E FeSODa |
|||||||
|---|---|---|---|---|---|---|---|---|---|
| Fe3+/OH− | Fe2+/HOH | Fe2+/OH− | Fe3+/OH− | Fe2+/HOH | Fe2+/OH− | Fe3+/OH− | Fe2+/HOHA | Fe2+/HOHB | |
| Bond lengths (Å) | |||||||||
| Fe-O (Sol) | 1.90 | 2.22 | 1.97 | 1.90 | 2.25 | 1.96 | 1.93 | 2.15 | 2.25 |
| Fe-O (Asp) | 1.91 | 1.93 | 1.97 | 1.92 | 1.93 | 1.90 | 1.91 | 1.94 | 1.91 |
| Fe-N (His26) | 2.24 | 2.15 | 2.50 | 2.20 | 2.12 | 2.26 | 2.28 | 2.16 | 2.15 |
| Fe-N (His160) | 2.12 | 2.13 | 2.17 | 2.16 | 2.12 | 2.14 | 2.13 | 2.10 | 2.14 |
| Fe-N (His73) | 2.15 | 2.09 | 2.14 | 2.14 | 2.11 | 2.11 | 2.10 | 2.16 | 2.09 |
| H-bond distances (Å) | |||||||||
| O(Sol)…N(Gln/Glu) | 3.08 | 3.56 | 2.86 | 2.77 | 3.03 | 2.93 | 2.96 | 3.15 | 2.72 |
| O(Sol)…O(Asp) | 3.10 | 2.62 | 3.46 | 2.89 | 2.57 | 3.28 | 3.22 | 2.85 | 3.00 |
| O(Tyr)…N(Gln/Glu) | 3.29 | 3.12 | 3.24 | 3.20 | 3.30 | 3.36 | 3.37 | 2.65 | 2.61 |
| O(Gln/Glu)···N(Trp) | 2.75 | 2.78 | 2.78 | 2.82 | 2.83 | 2.85 | 2.78 | 2.98 | 2.71 |
| Bond angles (deg) | |||||||||
| His73–Fe–His160 | 124 | 118 | 118 | 125 | 121 | 125 | 122 | 128 | 125 |
Glu69 is protonated in Q69E Fe2+SODA and deprotonated in Q69E Fe2+SODB.
To further validate our QM/MM-optimized Fe3+SOD active-site model, semi-empirical INDO/S-CI calculations were used to compute the ground-state properties and electronic transition energies. The zero-field splitting (ZFS) parameters predicted by this method, D = −0.89 cm−1 and E/D = 0.025 (Table 3), are in qualitative agreement with those obtained from EPR spectroscopic experiments (i.e. D = −1.7 cm−1 and E/D = 0.24).30 Furthermore, consistent with previous computational studies on truncated active-site models of this species,27 the z-axis of the computed D-tensor coincides with the Fe–O(Sol) bond vector, while the x-axis is oriented along the Fe–O(Asp156) bond vector. The INDO/S-CI computed electronic transition energies and Abs intensities (Table 3) are also in reasonable agreement with our experimental data (Table 1), thus permitting us to assign the dominant feature at 26 000 cm−1 in the Fe3+SOD Abs spectrum (Figure 2) to a transition possessing primarily O(Asp156) → Fe3+ 3dx2-y2 CT character. Our INDO/S-CI computations also correctly predict several spin-forbidden d → d transitions at lower energy, though these transitions are predicted to carry no Abs intensity because this method does not account for spin-orbit mixing among excited states.
Table 3.
INDO/S-CI calculated electronic excitation energies and zero-field splitting parameters for Fe3+SOD, Fe3+(Mn)SOD, and Q69E Fe3+SODa
| Fe3+SOD | Fe3+(Mn)SOD | Q69E Fe3+SOD | |
|---|---|---|---|
| d → d | 5508 | 4766 | 6475 |
| 5573 | 4866 | 6505 | |
| 9443 | 8440 | 10 904 | |
| 10 421 | 9437 | 11 575 | |
| 16 672 | 16 763 | 16 743 | |
| 20 772 | 21 124 | 20 558 | |
| 23 865 | 23 712 | 20 991 | |
| 23 762 | |||
| Asp →Fe3+ LMCT | 27 928 (f < 0.001) | 27 734 (f < 0.001) | 28 042 (f < 0.001) |
| 28 763 (f =0.017) | 28 553 (f = 0.013) | 28 808 (f = 0.01) | |
| 29 731 (f = 0.026) | 29 319 (f = 0.037) | 29 783 (f = 0.003) | |
| 29 816 (f = 0.023) | 29 486 (f = 0.011) | 29 785 (f = 0.052) | |
| 33 924 (f = 0.023) | 33 893 (f = 0.014) | 33 379 (f = 0.021) | |
| 34 184 (f = 0.015) | |||
| D (cm−1) | −0.89 | −1.00 | −0.67 |
| E/D | 0.025 | 0.036 | 0.025 |
The INDO/S-CI computed oscillator strengths, f, are given in parantheses for all transitions with f > 0.
While INDO/S-CI calculations confirm that our Fe3+SOD active-site model is reasonable, we also verified that DFT calculations adequately reproduce our spectroscopic data obtained for Fe3+SOD as DFT methods were ultimately used to compute E° and pK values. Because time-dependent (TD) DFT methods fail to predict reasonable electronic excitation energies for high-spin Fe3+ species,92 we used the Slater transition-state approach for determining the energies of specific transitions.93, 94 In this approach, 0.5 electrons are excited from the donor MO to the acceptor MO involved in the transition of interest, and the difference in MO energies after convergence is taken as the transition energy. The computed energy of 29 276 cm−1 for the O(Asp156) → Fe3+ 3dx2-y2 CT transition, which is the main contributor to the intense feature in the experimental Abs spectrum (vide supra), is in good agreement with our experimental and INDO/S-CI results (Tables 1 and 3). Collectively, these results indicate that the QM/MM optimization of the Fe3+SOD protein subunit yields an active-site model that reproduces both the structural and electronic properties as determined by experimental methods.95
Fe3+(Mn)SOD. For Fe3+(Mn)SOD, two different computational models were generated. For the first model, the starting coordinates were taken from the MnSOD X-ray crystal structure (PDB file 1VEW) and the active-site Mn was changed to Fe.13 The second model was based on X-ray crystallographic data reported for E. coli Fe3+(Mn)SOD (PDB file 1MMM) at a pH of 8.5.28 As the pK associated with the binding of an exogenous OH- to the Fe3+ ion between the His171 and His81 ligands is only ~6.7 for this species,23, 47 the active site in one of the protein subunits exhibits a 6-coordinate distorted octahedral geometry in the Fe3+(Mn)SOD crystal structure.28 Although the active site in the other protein subunit (i.e., the one used in our QM/MM optimization) appears to be 5-coordinate, the large N(His171)–Fe–N(His81) bond angle of 147° (as compared to 148° in the 6-coordinate species and 127° for five-coordinate FeSOD) suggests that it may also be interacting with a second, possibly disordered, OH-. Indeed, QM/MM geometry optimizations of Fe3+(Mn)SOD models based on the MnSOD and Fe3+(Mn)SOD crystal structures yielded similar active-site models. Therefore, only the MnSOD-derived model will be discussed in the test (the results for the other model are provided in Supporting Information).
The average Fe–ligand bond length in the QM/MM-optimized Fe3+(Mn)SOD model (PROCHECK score of −0.16) is 2.06 Å, the same as for our computational model of Fe3+SOD. In comparison, the average Fe–ligand bond length in the Fe3+(Mn)SOD crystal structure is ~0.10 Å larger (2.16 Å), providing further evidence that the corresponding active sites are more representative of a 6-coordinate Fe3+ species. The QM/MM-optimized Fe3+SOD and Fe3+(Mn)SOD models reveal some interesting differences within the active-site hydrogen-bond network. In particular, the O(Sol)…O(Asp167) and O(Sol)…N(Gln146) hydrogen bonds in Fe3+(Mn)SOD are predicted to be 0.21 and 0.30 Å, respectively, shorter than the analogous O(Sol)…O(Asp156) and O(Sol)…N(Gln69) hydrogen bonds in Fe3+SOD, consistent with the native active-site structures of E. coli Fe3+SOD and Mn3+SOD.12, 13
The INDO/S-CI computed ZFS parameters for the Fe3+(Mn)SOD active-site model are D = −1.00 cm−1 and E/D = 0.050. Although the corresponding experimental values have not yet been reported, the similar saturation behavior of the VTVH MCD data for Fe3+(Mn)SOD and Fe3+SOD (Figure 3) requires that the computed ZFS parameters for these two species be comparable, as is indeed the case (Table 3). Also consistent with our spectroscopic data (Figure 3), the INDO/S-CI computations predict similar D-tensor orientations as well as electronic transition energies and Abs intensities for the Fe3+(Mn)SOD and Fe3+SOD active-site models (Table 3). Lastly, the DFT/Slater computed energy of 28 050 cm−1 for the O(Asp) → Fe3+ CT transition is in excellent agreement with our experimental and INDO/S-CI computational results. Therefore, it can be concluded that our QM/MM geometry optimization afforded a realistic active-site model for the low-pH (i.e., five coordinate) form of Fe3+(Mn)SOD.
Q69E Fe3+SOD. Because X-ray crystallographic data for Q69E Fe3+SOD have not yet been reported, a model for this species was generated by QM/MM optimization using the crystal structure of Fe3+SOD (PDB file 1ISA) as a starting point. To assess the protonation state of Glu69,50 three hypothetical Q69E Fe3+SOD active-site models were considered: i) H2O as the axial solvent ligand and deprotonated Glu69, ii) OH- as the axial solvent ligand and protonated Glu69, and iii) OH- as the axial solvent ligand and deprotonated Glu69 (the singly deprotonated form of models i and ii). The key structural parameters for all three optimized models are provided in the Supporting Information. On the basis of electrostatic considerations, model iii is considered to be the least favorable, as it contains two anionic groups within 3 Å of each other. Of the other two models, both were found to represent stable isomers, but model ii was computed to be ~6.7 kcal/mol more stable than model i and thus provides the best active-site description for Q69E Fe3+SOD. Therefore model ii, which received a PROCHECK score of −0.26, was used in all subsequent calculations.
As revealed by our VTVH MCD data, Q69E and WT Fe3+SOD possess similar Fe3+ coordination environments. Consistent with this experimental finding, the Fe3+ center in the Q69E Fe3+SOD model retained a 5-coordinate, trigonal bipyramidal ligand environment upon geometry optimization, and the average Fe–ligand bond length of 2.07 Å after optimization is within 0.1 Å of that predicted for Fe3+SOD (Table 2). However, since Glu69 is a much stronger hydrogen-bond donor than Gln, it effectively pulls the solvent ligand away from Fe3+ and its other hydrogen-bond partner, Asp156, causing a lengthening of both the Fe–O(Sol) bond (by 0.03 Å) and the O(Sol)…O(Asp156) hydrogen bond (by 0.12 Å), relative to Fe3+SOD.
INDO/S-CI calculations on the Q69E Fe3+SOD active-site model predict similar ZFS parameters (D = −0.67 cm−1 and E/D = 0.025) to those computed for Fe3+SOD and Fe3+(Mn)SOD, as required by our VTVH MCD data. Likewise, the d → d and O(Asp) → Fe3+ CT transition energies obtained by using the INDO/S-CI method (Table 3) and, additionally, the DFT/Slater approach for the latter (28 767 cm−1) agree well with our experimental results. Hence, it can be concluded that the QM/MM-optimized active-site model for Q69E Fe3+SOD is reasonable.
3.2.2. Reduced species.
Fe2+SOD. For Fe2+SOD, two models with different protonation states, Fe2+SODHOH and Fe2+SODOH, were generated from the X-ray crystal-structure coordinates (PDB file 1ISA).12 As expected, protonation of the axial solvent ligand lengthens the Fe–O(Sol) bond distance from 1.97 Å in Fe2+SODOH- to 2.22 Å in the QM/MM optimized Fe2+SODHOH model (PROCHECK score of −0.25). While the latter value is 0.18 Å larger than the Fe–O(Sol) bond distance in the Fe2+SOD crystal structure,12 it is clearly within the range of Fe2+–OH2 bond lengths reported for synthetic complexes.96, 97 In the hypothetical Fe2+SODOH- model used for active-site pK and reduction potential calculations (vide infra), the short Fe–O(Sol) bond has a large trans influence on the Fe–N(His26) bond, which lengthens to 2.50 Å. A similar effect was noted previously by Noodleman and coworkers, whose DFT geometry optimizations of truncated Fe2+SODOH- active-site models yielded Fe–N(His26) bond lengths in excess of 2.60 Å.44
The INDO/S-CI computed ZFS parameters for the Fe2+SODHOH model of D = −4.6 cm−1 and E/D = 0.10, are in qualitative agreement with the experimental values (D = −8 ± 2 cm−1 and E/D = 0.27)90 and almost identical to previously computed values (D = −4.7 cm−1 and E/D = 0.10).27 TD-DFT calculations predict four spin-allowed transitions from the doubly occupied Fe2+ 3dyz-based MO to the four singly occupied Fe2+ 3d-based MOs (Table 4).98 The highest-energy transition at 14 165 cm−1 involves Fe 3dyz → 3dz2 excitation and corresponds to the prominent feature centered at ~10 200 cm−1 in the experimental MCD spectrum (Figure 4). The DFT/Slater computed energy of 12 194 cm−1 for this transition also agrees reasonably well with the experimental value. Similar results were obtained from INDO/S-CI calculations on our Fe2+SODHOH model (Table S24).
Table 4.
Experimental and computed transition energies (cm−1) for the Fe2+-bound SOD species
| Fe2+SOD | Fe2+(Mn)SOD | Q69E Fe2+SOD | |
|---|---|---|---|
| Exp | 10 194 | 10 515 | 10 731 |
| TD-DFTa | |||
| 1 (3dyz → 3dx2-y2) | 443 | 2144 | 2131 |
| 2 (3dyz → 3dxz) | 3276 | 4918 | 5402 |
| 3 (3dyz → 3dxy) | 5581 | 6282 | 6388 |
| 4 (3dyz → 3dz2) | 14 165 | 14 322 | 13 271 |
| Slater methodb | 12 194 | 12 170 | 11 226 |
TD-DFT calculations performed in ORCA using the B3LYP functional and COSMO (ε = 4.0).
DFT/Slater method calculations performed in ADF using the BP functional; only the energy of the Fe 3dyz → 3dz2 transition was calculated.
Fe2+(Mn)SOD. Because X-ray crystallographic data for Fe2+(Mn)SOD have not yet been reported, models of Fe2+(Mn)SODOH- and Fe2+(Mn)SODHOH were derived from the MnSOD 1VEW PDB file.13 Similar to the results obtained with the Fe2+SOD models, the Fe–O(Sol) bond length of 2.25 Å in the QM/MM geometry optimized Fe2+(Mn)SODHOH model is ~0.3 Å longer than in the Fe2+(Mn)SODOH- model. However, in the Fe2+(Mn)SOD models the Fe–N(His26) bond only lengthens by 0.14 Å upon deprotonation of the axial solvent ligand, as compared to 0.35 Å in the Fe2+SOD models. This difference can be attributed to the stronger hydrogen-bond interaction between the coordinated solvent and Gln69/146 in the metal-substituted enzyme, which reduces the donor strength of the solvent ligand in its deprotonated (i.e., OH-) form.
As required by the similarity of the VTVH MCD data obtained for Fe2+(Mn)SOD and Fe2+SOD (Figure 3), INDO/S-CI calculations for the Fe2+(Mn)SODHOH model (PROCHECK score of −0.20) yielded ZFS parameters (D = −5.45 cm−1 and E/D = 0.14) and a D-tensor orientation similar to those predicted for the Fe2+SODHOH model. Also consistent with our spectroscopic data (Figure 4), the TD-DFT and DFT/Slater method computed LF transition energies for Fe2+(Mn)SODHOH are similar to those of Fe2+SODHOH.
Q69E Fe2+SOD. The recently reported 1.1 Å resolution crystal structure50 of Q69E Fe2+SOD provided an excellent starting point for our computational models of this species, though the protonation states of Glu69 and the solvent ligand had to be evaluated computationally by using the QM/MM methodology. In the fully protonated model, Q69E Fe2+SODA (Table 2), Tyr34, Glu69 and the solvent ligand are all protonated. For the singly deprotonated active-site model, Q69E Fe2+SODB, the relative pKs of Glu69, Tyr34, and the solvent ligand were determined by optimizing three different active-site models obtained by removing a proton from either Glu69, Tyr34, or coordinated solvent. QM/MM geometry optimization of each singly deprotonated model invariably yielded an active site with Tyr34 and the solvent ligand in their protonated states and deprotonated Glu69 (Table S23). This result indicates that the pK of Glu69 is lower than those of Tyr34 and coordinated solvent, consistent with our finding from a recent NMR study that Glu69 is most likely deprotonated in Q69E Fe2+SOD.37, 50 Because the close proximity of two anionic moieties in the doubly deprotonated Q69E Fe2+SOD model should be very unfavorable for electrostatic reasons, this species will not be discussed in detail here (structural parameters for this model are provided in Table S23).
As in the case of Fe2+(Mn)SOD, the ground state properties of Q69E Fe2+SOD have not yet been analyzed in detail. However, from the similar saturation behavior of the VTVH MCD curves (Figure 4), it is evident that the ZFS parameters should be comparable to those of Fe2+SOD. For this reason, the computed values of D = −5.22 cm−1 and E/D = 0.15 for the Q69E Fe2+SODB model (PROCHECK score of −0.18) are deemed reasonable. Moreover, the TD-DFT and DFT/Slater method computed energies for the LF transitions also agree reasonably well with those predicted for Fe2+SODHOH and Fe2+(Mn)SODHOH. The fact that the highest-energy LF transition is predicted to red-shift by ~1000 cm−1 from Fe2+SODHOH and Fe2+(Mn)SODHOH to Q69E Fe2+SODB, even though our spectroscopic data show that this transition occurs at approximately the same energy for all three species, indicates that our DFT calculations slightly overestimate the stabilization of the Fe 3dz2-based MO by the hydrogen-bond acceptor Glu69.
3.2.3. Active-site pKs and reduction potentials.
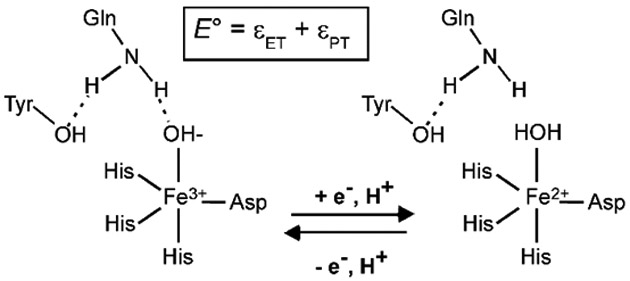
Calculations were performed to elucidate the molecular origin of the vastly “detuned” Fe3+/2+ redox potentials in Fe(Mn)SOD and Q69E FeSOD (see Experimental section for details). Because in FeSOD reduction of the Fe3+ center and protonation of the axial solvent ligand are believed to be a concerted process,7, 44 the corresponding E° depends on the energies associated with both proton transfer, εPT, and electron transfer, εET (Scheme 1). In the case of Fe3+(Mn)SOD and Q69E Fe3+SOD, however, the situation is slightly complicated by the fact that both species have a tendency to bind an additional OH- ligand at neutral pH.17, 47, 50 The binding of a sixth ligand stabilizes the oxidized state, thereby slightly lowering E° (by ~40 mV and 120 mV in Fe(Mn)SOD and Q69E FeSOD, respectively, see Supporting Information). Yet, since the goal of this study is to assess the contribution of residue 69/146 to redox tuning, only the WT-like 5-coordinate state was considered in computing the E° for each species.
Scheme 1.
To calculate E° for our QM/MM-derived active-site models, DFT single-point calculations using the B3LYP hybrid functional were employed. Solvation effects were accounted for by employing the COSMO method with a dielectric constant of ε = 4.0. While the absolute E° values obtained in this manner will be subject to some systematic errors, it is expected that these errors are of similar magnitude for all three SOD species investigated. Thus, our DFT/COSMO computations should properly reproduce the trend in E° values, thereby providing insight into the mechanism by which FeSOD, Fe(Mn)SOD, and Q69E FeSOD differently tune their metal ion reduction potentials.
For the first set of calculations on FeSOD and Fe(Mn)SOD, the active-site models included the entire QM region; namely, all first sphere ligands, Tyr34, Gln69/146, and Trp122/128. The relevant results obtained in these calculations are listed in Table 5 (see Table S45 for additional details). The DFT/COSMO computed energies for the one-electron reduction of the Fe3+ center, εET, in FeSOD and Fe(Mn)SOD are −0.54 and −0.49 eV, respectively and the pKs associated with the solvent ligand in the reduced state are 23.3 and 15.6, respectively. Using these values in conjunction with equations 2 and 5 leads to the prediction that the E° of Fe(Mn)SOD is ~400 mV lower than the E° of FeSOD, which agrees remarkably well with the experimentally determined difference in E° of 300–400 mV.29, 38 Interestingly, the main factor contributing to the lower E° of Fe(Mn)SOD relative to FeSOD is the decreased proton affinity of the solvent ligand in the reduced state, as the computed energies associated with the electron-transfer step (i.e. Fe3+ reduction) are nearly identical (Table 5).
Table 5.
DFT/COSMO computed εPT, εET, pK, and E° values for complete active-site models of FeSOD, Fe(Mn)SOD, and Q69E FeSOD
| FeSOD | Fe(Mn)SOD | Q69E FeSOD | |
|---|---|---|---|
| IP (kcal/mol) | 89.6 | 90.8 | 122 |
| εET (eV) | −0.54 | −0.49 | 0.85 |
| εdeprot (kcal/mol) | 305 | 295 | |
| pK[Fe2+SODHOH] | 23.3 | 15.6 | |
| εPT (eV) | 0.97 | 0.51 | |
| E° (V)b | 0.42 | 0.02 | 0.85a |
For Q69E FeSOD, E° corresponds to εET since in this species an intramolecular proton transfer occurs upon metal-ion reduction.
To evaluate the significance of the different positions of key second-sphere residues in FeSOD and MnSOD protein matrices with respect to the metal ion reduction potential, the same computational approach was used to calculate the E° values for truncated active-site models of FeSOD and Fe(Mn)SOD that lack Tyr34, Gln69/146, and Trp122/128. As shown in Table 6, the difference in the solvent ligand pK of 8 pH units is lost upon removal of the second-sphere residues. As a result, the computed reduction potentials for the two truncated models differ by only 0.03 mV. Collectively, our DFT/COSMO computational results provide compelling evidence that the difference in E° of FeSOD and Fe(Mn)SOD is due, primarily, to the difference in driving forces associated with the proton-transfer step and thus largely caused by the different positioning of the second-sphere Gln residue. This hypothesis is consistent with our spectroscopic data of FeSOD and Fe(Mn)SOD, which clearly show that these two species have virtually identical active site electronic structures in both their oxidized and reduced states.
Table 6.
DFT/COSMO computed εPT, εET, pK, and E° values for first-sphere models of FeSOD and Fe(Mn)SOD
| FeSOD | Fe(Mn)SOD | |
|---|---|---|
| IP (kcal/mol) | 83.2 | 85.6 |
| εET (eV) | −0.82 | −0.72 |
| εdeprot (kcal/mol) | 307 | 306 |
| pK[Fe2+SODHOH] | 24.7 | 23.6 |
| εPT (eV) | 1.05 | 0.98 |
| E° (V) | 0.23 | 0.27 |
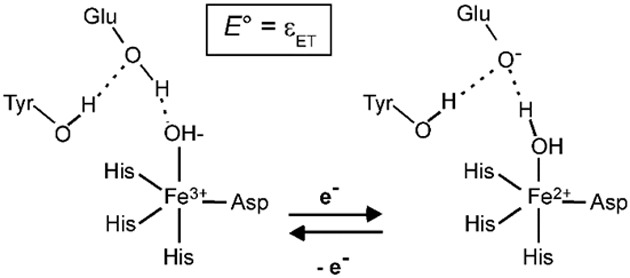
Mutation of Gln69 to a Glu residue in Q69E FeSOD offers a means for selectively altering the driving force of the proton-transfer step. Our previous experimental study of this mutant revealed that the Glu69 residue is most likely neutral in the oxidized state and deprotonated in the reduced state.50 Consistent with these results, the pK computed for Glu69 in the ferrous state is −20.4. Since the solvent ligand becomes protonated upon metal ion reduction, the additional proton most likely derives locally from the Glu69 residue. Therefore, neglecting the possibility of OH- binding to Q69E Fe3+SOD, the reduction of Q69E Fe3+SOD is no longer coupled to proton uptake (Scheme 2). Consequently, the E° of Q69E FeSOD directly corresponds to the computed εET of 0.85 V, which is 0.43 V more positive than the E° predicted for FeSOD. This prediction is in good agreement with the experimental value obtained from redox titrations, which revealed that the E° of Q69E FeSOD is increased by at least 660 mV.38, 50 The contribution of the internal proton transfer to E° for Q69E FeSOD can be estimated by considering the sum of the energies associated with deprotonation of Glu69 and protonation of the solvent ligand in the reduced state. The computed values for these energies are 1.63 and 0.16 eV, respectively, suggesting the driving force provided by the internal proton transfer is on the order of 1.79 V, which is approximately 0.8 V larger than the driving force for simple protonation of the solvent ligand in FeSOD. Thus, the large driving force for reduction of Q69E Fe3+SOD is predominantly provided by the favorable internal proton transfer.
Scheme 2.
4. Discussion.
FeSOD, Fe(Mn)SOD, and Q69E FeSOD provide an almost ideal set of protein species for investigating the role of second-sphere residues with respect to enzyme activity. While the first coordination spheres of the Fe centers in these species are virtually identical in both the oxidized and reduced states, the second coordination spheres exhibit some significant, structurally well-defined differences. Specifically, in Fe(Mn)SOD Gln146 is positioned closer to the solvent ligand than the analogous Gln69 in FeSOD, whereas in Q69E FeSOD this hydrogen-bond donor has been replaced with a hydrogen-bond acceptor (in the reduced state). These second-sphere perturbations have been found to shift the Fe3+/2+ reduction potential by ~ −300 to −400 mV and more than +660 mV for Fe(Mn)SOD and Q69E FeSOD, respectively, relative to that of FeSOD, thereby drastically diminishing the catalytic activity.18, 37, 38 In this study, we have employed a variety of spectroscopic techniques to probe the electronic structure of the active site in each species and used this information to evaluate computational models generated via full QM/MM geometry optimizations, so as to establish a basis for quantitatively assessing the role of residue 69 of FeSOD in metal ion redox tuning. The key findings from this study are discussed below.
4.1. Comparison of the active site electronic structures.
4.1.1. Oxidized species.
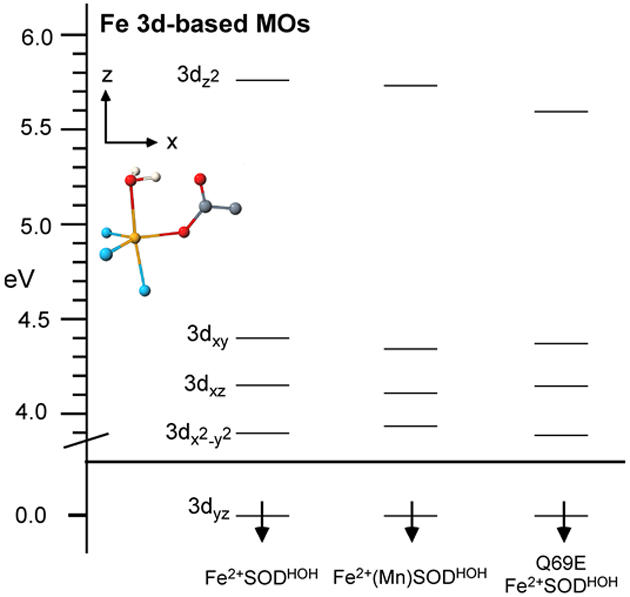
The experimentally validated QM/MM-derived active-site models for Fe3+SOD, Fe3+(Mn)SOD, and Q69E Fe3+SOD reveal only minor structural differences in the first coordination sphere, as anticipated based on the similarity of the VTVH MCD data obtained for these three species (Figure 3). As a result, our DFT/COSMO computed active-site electronic structure descriptions for all three species are very similar. In particular, the splittings of the Fe3+ 3d-based spin-down MOs (Figure 5) are almost identical in magnitude, in each case reflecting the trigonal bipyramidal coordination environment of the Fe3+ center.99 A small difference noted from Figure 5 is the stabilization of the Fe3+ 3dz2-based spin-down MO in Q69E Fe3+SOD by 0.3 eV relative to that of Fe3+SOD (Tables S27-S30). This stabilization reflects an increased hydrogen-bonding interaction between residue 69 and the axial solvent ligand in the mutant, which weakens the Fe–O(Sol) interaction. Alternatively, while the optimized O(Sol)…N(Gln) hydrogen bond distances of 3.08 and 2.77 Å for Fe3+SOD and Fe3+(Mn)SOD, respectively, differ by as much as a 0.3 Å, this difference does not have any significant effect on the computed Fe3+ 3d-orbital splittings (Figure 5). Consistent with this result, previous EPR experiments and our INDO/S-CI computations (Table 3) yielded similar ZFS parameters for Fe3+SOD and Fe3+(Mn)SOD.100 Overall, the lack of any significant differences in the DFT/COSMO computed active site electronic structures leads to the conclusion that the ligand environments of the Fe3+ centers in all three SOD species investigated are very similar. Thus, our computations do not provide any immediate explanation for the different Fe3+/2+ reduction potentials.
Figure 5.
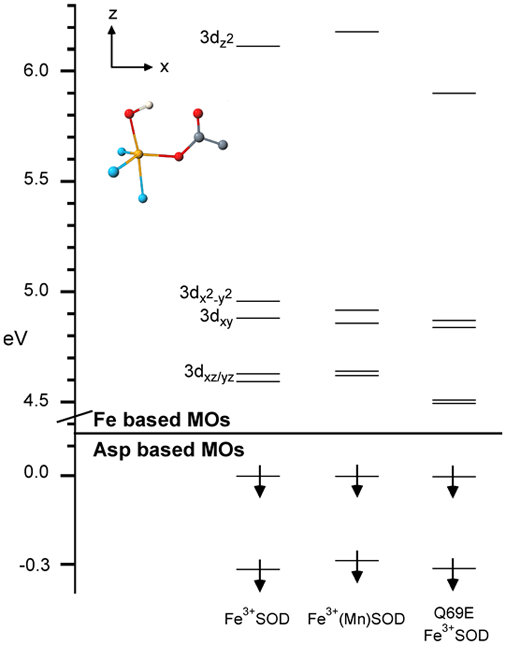
DFT/COSMO computed relative energies of the occupied Asp-based and unoccupied Fe 3d-based spin-down MOs for Fe3+SOD, Fe3+(Mn)SOD, and Q69E Fe3+SOD. The MO energy levels were shifted vertically by moving the higher-energy Asp-based MO to 0.0 eV. The D-tensor orientation as obtained from INDO/S-CI calculations is shown in the upper left.
Previous studies revealed that both azide and OH- bind more tightly to the Fe3+ center in Fe3+(Mn)SOD than in Fe3+SOD.7, 17, 47, 101 Likewise, the tendency of Q69E Fe3+SOD to bind an additional OH- ligand at neutral pH suggests that the mutant’s anion binding affinity is also elevated above that of Fe3+SOD.50 The different anion binding affinities of these three species have been attributed to the Fe3+ ion carrying more positive charge in Fe3+(Mn)SOD.17 However, a more likely explanation is that the anion-binding properties are largely dictated by second-sphere residues, rather than the metal ion electronic structure itself.102–106 Second-sphere effects on anion binding are discussed in the following paper, which presents an in-depth characterization of the azide adducts of Fe3+SOD, Fe3+(Mn)SOD, and Q69E Fe3+SOD.
4.1.2. Reduced species.
As for the oxidized species, the DFT/COSMO computed active-site electronic structure descriptions for Fe2+SOD, Fe2+(Mn)SOD, and Q69E Fe2+SOD reveal no significant differences (Figure 6), despite variations in their second coordination spheres. Consistent with these results, previous 1H NMR studies indicated that even though the second-sphere Gln residue is significantly closer to the metal center in Fe2+(Mn)SOD than in Fe2+SOD,36 the ligand environments and electronic structures of the metal ion are similar in both species based on the similar positions of the His ligand resonances.47 Furthermore, despite the negative charge on the Glu69 residue in Q69E Fe2+SOD, the paramagnetic shifts of the 1H NMR spectral features of Q69E Fe2+SOD are comparable to those of Fe2+SOD50 and Fe2+(Mn)SOD, indicating that all three species possess similar active site electronic structures.
Figure 6.
DFT/COSMO computed relative energies of the Fe 3d-based spin-down MOs for Fe2+SODHOH, Fe2+(Mn)SODHOH, and Q69E Fe2+SODHOH. The MO energy levels were shifted vertically by moving the Fe 3dyz based MO to 0.0 eV. In each case several MOs of similar energies were found to possess significant Fe2+ 3dz2 orbital character; for clarity, only the corresponding lowest-energy MO is shown. The D-tensor orientation as obtained from INDO/S-CI calculations is shown in the upper left.
One noteworthy difference between the 1H NMR results reported for Fe2+SOD and Fe2+(Mn)SOD is the increased exchange rate of a ligand His proton, which was interpreted as suggesting increased solvent accessibility to the active site in the latter species. Alternatively, for Q69E Fe2+SOD the solvent exchange rate of the analogous proton was found to be highly suppressed, presumably due to the presence of the anionic Glu69.50 Consequently, the possibility that an unfavorable electrostatic interaction between anionic Glu69 and O2•– is contributing to the decreased catalytic activity in Q69E FeSOD cannot be completely ruled out. However, both the current and previous studies have found that the anionic Glu69 accepts two strong hydrogen bonds from the water ligand and Tyr34, which effectively shield the negative charge on the Glu69 residue, as evidenced by the fact that the two C-O bond lengths of Glu69 substantially differ from those typically observed for caboxylate.50
4.2. Mechanism of redox tuning.
Reduction potential calculations using our QM/MM-derived active-site models of FeSOD, Fe(Mn)SOD, and Q69E FeSOD nicely reproduce the trend in E° observed experimentally. For FeSOD and Fe(Mn)SOD the computed values for E° of 422 mV and 18 mV, respectively, differ by ~400 mV, in good agreement with the experimental difference of 300–400 mV.29, 38 For these two species E° has two contributions associated with electron transfer and proton transfer, as metal-ion reduction is coupled to proton uptake.7, 44 The uncoupled one-electron reduction of the Fe3+ ion is more favorable for Fe3+(Mn)SOD than for Fe3+SOD by a mere 0.051 eV, consistent with the similar active site electronic structures of these two species. In contrast, proton transfer for Fe2+(Mn)SOD is 0.456 eV less favorable than for Fe2+SOD, corresponding to a reduction in the pK of the solvent ligand by ~8 pH units (Figure 7). The pK of the axial solvent ligand is directly related to the Fe3+/2+ reduction potential; a high pK will favor the H2O protonation state and thus raise E°, while a lower pK will favor the OH- protonation state and therefore depress E°. Since the calculated energies for electron transfer in FeSOD and Fe(Mn)SOD are nearly identical, it is the difference in pK of the solvent ligand that is responsible for the computed 300–400 mV difference in E°. Although the increased affinity of Fe3+(Mn)SOD for exogenous OH- also contributes to the experimental difference in E° by stabilizing the oxidized state, this contribution is only ~40 mV (see Supporting Information). Consequently, by separating the two contributions to the proton coupled reduction potential, in DFT/COSMO computations on experimentally-validated active-site models, we have obtained quantitative support for previous proposals that the (Fe)SOD and (Mn)SOD protein matrices adjust the metal ion reduction potential by modulating the proton affinity of the coordinated solvent molecule, in particular via the Gln69/146…O(Sol) hydrogen bond.29, 36, 37
Figure 7.
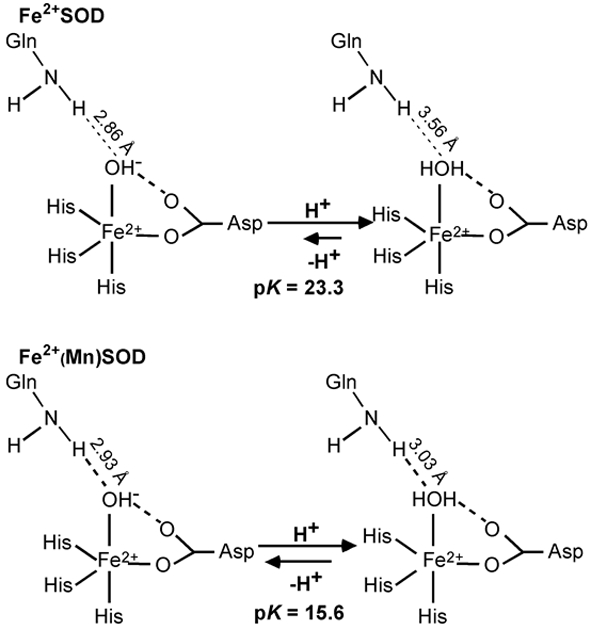
Equilibrium conditions for proton binding to the solvent ligand as predicted by DFT/COSMO calculations (ε = 4.0) for Fe2+SOD and Fe2+(Mn)SOD.
The two most significant differences in the optimized FeSOD and Fe(Mn)SOD active-site structures are: 1) the positioning of the Gln residues with respect to the metal ion and 2) the steric constraints imposed on the Gln residues by the nearby hydrogen-bonding partners (Table 2). In the hypothetical Fe2+SODOH- and Fe3+SOD models, the Gln69 residue is at a distance of 2.86 and 3.08 Å, respectively, from the axial solvent ligand. Upon protonation of the OH- ligand in Fe2+SODOH- to generate the Fe2+SODHOH model, the Gln69 residue is able to move 0.65 Å away from the solvent ligand (final distance of 3.50 Å, Figure 7), thereby minimizing steric clash between the Gln69 amide functionality and solvent ligand protons. On the other hand, upon protonation of the OH- ligand in Fe2+(Mn)SODOH- to yield Fe2+(Mn)SODHOH, the Gln146…O(Sol) hydrogen bond distance only increases from 2.93 Å to 3.03 Å (Figure 7), which leads to significant steric crowding between the Gln146 and solvent ligand protons. Thus, steric constraints imposed on residue Gln146 hinder protonation of the coordinated solvent, and thereby strongly disfavor the Fe2+(Mn)SOD oxidation state. The restricted motion of Gln146 and its close proximity to the solvent ligand are inherent to (Mn)SOD species as shown by numerous crystallographic and computational studies. Thus, Gln146, along with the negatively charged Asp and OH- ligands, likely play a key role in depressing the Mn3+/2+ reduction potential from 1.51 V in aqueous solution to 290 mV in the protein active site.12, 13, 28, 37, 44, 107, 108 In support of this model, the Q143A mutant of human MnSOD was previously shown to be isolated in the reduced state and thus to possess an elevated E°, consistent with the H2O ligand no longer being destabilized in this species.109 Taken together, these results suggest that the (Mn)SOD protein matrix has evolved to destabilize the M2+SODHOH state more than the (Fe)SOD protein matrix does, so as to compensate for the intrinsically higher Mn3+/2+ reduction potential. It is primarily this difference in the nature of the Gln…O(Sol) hydrogen bond interactions in FeSOD and Fe(Mn)SOD that is responsible for the computed difference in solvent ligand pK of 7.7 and thus the large difference in E°.
In further support of the important role that second-sphere residues play in E° tuning, the computed reduction potentials for active-site models of FeSOD and Fe(Mn)SOD comprising only the first coordination sphere are nearly identical, E° = 233 and 266 mV, respectively. In this case the differences in the energies for electron transfer and proton transfer are a mere 0.10 and 0.07 eV, respectively, suggesting that the first-sphere residues depress the Fe3+/2+ reduction potential by about the same amount regardless of the protein matrix. Thus, assuming that the Fe3+/2+ and Mn3+/2+ reduction potentials in FeSOD and MnSOD, respectively, were solely determined by the first-sphere residues, the E° of Fe3+SOD would be ~700 mV more negative than that of Mn3+SOD (corresponding to the difference in E° for aqueous Fe3+ and Mn3+). The second sphere of the (Fe)SOD protein matrix must therefore to ensure that the driving force for proton transfer is large enough to compensate for the overly stabilized Fe3+ state. Indeed, our DFT/COSMO computations predict that the driving force for proton transfer is 0.40 eV larger for FeSOD than for Fe(Mn)SOD (Figure 8).
Figure 8.

DFT/COSMO computed energy diagram illustrating the effect of the second coordination sphere on the εET, εPT, and E° (V) values for FeSOD and Fe(Mn)SOD.
In Fe- and MnSODs, the second-sphere Gln69/146 serves as a hydrogen-bond donor to the solvent ligand and can thus stabilize the OH- ligand and/or destabilize the H2O ligand to a varying degree depending on the exact position of this residue. To study the effect of changing the hydrogen-bonding polarity between residue 69 and the solvent ligand, we prepared the Q69E FeSOD mutant. According to our model for redox tuning, the Glu69 residue should stabilize the reduced state by accepting a hydrogen bond from coordinated H2O. Indeed, the Q69E mutation increases the Fe3+/2+ reduction potential by more than 660 mV, trapping the Q69E FeSOD species in the reduced state. Our computations predict that the large elevation in reduction potential for Q69E FeSOD can be attributed to the large driving force for proton transfer from Glu69 to coordinated solvent, as Glu69 appears to be protonated in the oxidized state (Scheme 2).50
4.3. Importance of proton uptake.
Proton uptake coupled to metal-ion reduction is critical for SOD function. When substrate binds to the active site of the oxidized enzyme (eq 1-a), two events follow: 1) the metal ion is reduced and 2) the axial solvent ligand accepts a proton. It has been suggested that substrate binding alone is insufficient to make electron or proton transfer to the M3+SODOH- state favorable.44, 110 Instead, the electron-transfer and proton-transfer steps most likely represent a concerted process. From our calculations, it is evident that reduction of Fe3+SOD in the absence of proton transfer is highly unfavorable (εET = −0.54 eV in Table 5); thus supporting a mechanism in which metal ion reduction is strongly coupled to proton transfer.
In the second half reaction involving metal-ion oxidation (eq 1-b), the proton originally taken up by the active site during metal-ion reduction is released. In the absence of simultaneous proton transfer, electron transfer to the substrate superoxide would be unfavorable. However, because the pK of coordinated solvent drops upon metal-ion oxidation, it would be expected that the electron-transfer and proton-transfer processes in this half reaction are also strongly coupled. Consequently, product formation should become increasingly more favorable with decreasing pK of the solvent ligand. Considering that the pK of the solvent ligand is predicted to be 7.6 units lower for Fe(Mn)SOD than for FeSOD, and given the depressed E° of the former species, it is not surprising that Fe2+(Mn)SOD has been reported to rapidly reduce O2•–.29
The decreased pK of the solvent ligand in the (Mn)SOD protein matrix might also be crucial in suppressing formation of the product inhibited Mn3+SOD species, which is believed to be a side-on peroxo-Mn3+SODHOH complex.110 The lifetime of this species appears to be enhanced by limiting the availability of protons,34, 111–113 rather than a direct stabilization of the product inhibited species itself.43, 109 Therefore, by depressing the pK of the axial solvent ligand the (Mn)SOD protein matrix can promote proton transfer to, and thus dissociation of, the nascent product, thereby minimizing the likelihood of formation of the product-inhibited species.
Supplementary Material
Acknowledgement.
T.C.B. thanks the N.I.H. (GM 64631) for financial support. A.-F.M. acknowledges support from the N.S.F. (MCB012599) and the Michael and Kate Bárány Young Investigator Award (Biophysical Society) for this work.
Footnotes
Supporting Information Available: Cartesian coordinates of all QM/MM-optimized active-site models used in this study, structural and electronic properties of the Fe3+SOD model derived from PDB file 1ISB, structural and electronic properties of the Fe(Mn)SOD models derived from PDB file 1MMM, structural parameters of all Q69E FeSOD models, electronic structures of the oxidized and reduced species calculated using the BP or B3LYP functionals, reduction potential calculation for FeSOD, Fe(Mn)SOD, and Q69E FeSOD using ε = 10.0, DFT/COSMO computed solvation energies for all models, 4.5 K Abs, CD, and MCD spectral deconvolutions for Fe3+(Mn)SOD and Q69E Fe3+SOD. This material is available free of charge via the Internet at http://pubs.acs.org.
References
- (1).Miller A-F Curr. Opin. Chem. Biol. 2004, 8, 162–168. [DOI] [PubMed] [Google Scholar]
- (2).Valentine JS; Wertz DL; Lyons TJ; Liou L; Goto JJ; Gralla EB Curr. Opin. Chem. Biol. 1998, 2, 253–262. [DOI] [PubMed] [Google Scholar]
- (3).Simonian NA; Coyle JT Annu. Rev. Pharmacool. Toxicol. 1996, 36, 83–106. [DOI] [PubMed] [Google Scholar]
- (4).Youn H; Kim E; Roe J; Hah YC; Kang S Biochem. J. 1996, 318, 889–896. [DOI] [PMC free article] [PubMed] [Google Scholar]
- (5).Wuerges J; Lee J-W; Yim Y-I; Yim H-S; Kang S-O; Carugo KD Proc. Natl. Acad. Sci. U. S. A. 2004, 101, 8569–8574. [DOI] [PMC free article] [PubMed] [Google Scholar]
- (6).Bull C; Niederhoffer EC; Yoshida T; Fee JA J. Am. Chem. Soc. 1991, 113, 4069–4076. [Google Scholar]
- (7).Bull C; Fee JA J. Am. Chem. Soc. 1985, 107, 3295–3304. [Google Scholar]
- (8).Yost FJ; Fridovich I J. Biol. Chem. 1973, 248, 4905–4908. [PubMed] [Google Scholar]
- (9).Harris JI; Auffret AD; Northrop FD; Walker JE Eur. J. Biochem. 1980, 106, 297–303. [DOI] [PubMed] [Google Scholar]
- (10).Schininà ME; Maffey L; Barra D; Bossa F; Puget K; Michelson AM FEBS Lett. 1987, 221, 87–90. [DOI] [PubMed] [Google Scholar]
- (11).Stallings WC; Pattridge KA; Strong RK; Ludwig ML J. Biol. Chem. 1984, 259, 10695–10699. [PubMed] [Google Scholar]
- (12).Lah MS; Dixon MM; Pattridge KA; Stallings WC; Fee JA; Ludwig ML Biochemistry 1995, 34, 1646–1660. [DOI] [PubMed] [Google Scholar]
- (13).Edwards RA; Baker HM; Whittaker MM; Whittaker JW; Jameson GB; Baker EN J. Biol. Inorg. Chem. 1998, 3, 161–171. [Google Scholar]
- (14).Stallings WC; Metzger AL; Pattridge KA; Fee JA; Ludwig ML Free Radic. Res. Commun. 1991, 12–3, 259–268. [DOI] [PubMed] [Google Scholar]
- (15).Beyer WF; Fridovich I J. Biol. Chem. 1991, 266, 303–308. [PubMed] [Google Scholar]
- (16).Ose DE; Fridovich I J. Biol. Chem. 1976, 251, 1217–1218. [PubMed] [Google Scholar]
- (17).Whittaker MM; Whittaker JW Biochemistry 1997, 36, 8923–8931. [DOI] [PubMed] [Google Scholar]
- (18).Vance CK; Miller A-F Biochemistry 2001, 40, 13079–13087. [DOI] [PubMed] [Google Scholar]
- (19).Schmidt M; Meier B; Scherk C; Iakovleva O; Parak F Prog. Biophys. Mol. Biol. 1996, 65, PA113–PA113. [Google Scholar]
- (20).Hiraoka BY; Yamakura F; Sugo S; Nakayama K Biochem. J. 2000, 345, 345–350. [PMC free article] [PubMed] [Google Scholar]
- (21).Meier B; Parak F; Desideri A; Rotilio G FEBS Lett. 1997, 414, 122–124. [DOI] [PubMed] [Google Scholar]
- (22).Schmidt M; Scherk C; Desideri A; Parak F J. Inorg. Biochem. 1999, 74, 288–288. [Google Scholar]
- (23).Yamakura F; Kobayashi K; Ue H; Konno M Eur. J. Biochem. 1995, 227, 700–706. [DOI] [PubMed] [Google Scholar]
- (24).Yamano S; Sako Y; Nomura N; Maruyama T J. Biochem. (Tokyo) 1999, 126, 218–225. [DOI] [PubMed] [Google Scholar]
- (25).Whittaker MM; Whittaker JW J. Biol. Inorg. Chem. 2000, 5, 402–408. [PubMed] [Google Scholar]
- (26).Tierney DL; Fee JA; Ludwig ML; Penner-Hahn JE Biochemistry 1995, 34, 1661–1668. [DOI] [PubMed] [Google Scholar]
- (27).Jackson TA; Xie J; Yikilmaz E; Miller A-F; Brunold TC J. Am. Chem. Soc. 2002, 124, 10833–10845. [DOI] [PubMed] [Google Scholar]
- (28).Edwards RA; Whittaker MM; Whittaker JW; Jameson GB; Baker EN J. Am. Chem. Soc. 1998, 120, 9684–9685. [Google Scholar]
- (29).Vance CK; Miller A-F J.Am. Chem. Soc. 1998, 120, 461–467. [Google Scholar]
- (30).Miller A-F; Sorkin DL Comments Mol. Cell. Biophys. 1997, 9, 1–48. [Google Scholar]
- (31).Li J; Fisher CL; Chen JL; Bashford D; Noodleman L Inorg. Chem. 1996, 35, 4694–4702. [Google Scholar]
- (32).Lawrence GD; Sawyer DT Biochemistry 1979, 18, 3045–3050. [DOI] [PubMed] [Google Scholar]
- (33).Barrette WC Jr.; Sawyer DT; Fee JA; Asada K Biochemistry 1983, 22, 624–627. [DOI] [PubMed] [Google Scholar]
- (34).Stein J; Fackler JP Jr.; McClune GJ; Fee JA; Chan LT Inorg. Chem. 1979, 18, 3511–3519. [Google Scholar]
- (35).Miller A-F In Handbook of Metalloenzymes; Messerschmidt A, Huber R, Poulos T, Wieghardt K, Eds.; John Wiley & Sons: Chichester, U.K., 2001; pp 668–682. [Google Scholar]
- (36).Schwartz AL; Yikilmaz E; Vance CK; Vathyam S; Miller A-F J. Inorg. Biochem. 2000, 80, 247–256. [DOI] [PubMed] [Google Scholar]
- (37).Yikilmaz E; Xie J; Brunold TC; Miller A-F J. Am. Chem. Soc. 2002, 124, 3482–3483. [DOI] [PubMed] [Google Scholar]
- (38).Yikilmaz E; Rodgers DW; Miller A-F Biochemistry 2006, 45, 1151–1161. [DOI] [PubMed] [Google Scholar]
- (39).Leveque VJP; Vance CK; Nick HS; Silverman DN Biochemistry 2001, 40, 10586–10591. [DOI] [PubMed] [Google Scholar]
- (40).Maliekal J; Karapetian A; Vance C; Yikilmaz E; Wu Q; Jackson TA; Brunold TC; Spiro TG; Miller A-F J. Am. Chem. Soc. 2002, 124, 15064–15075. [DOI] [PubMed] [Google Scholar]
- (41).Greenleaf WB; Perry JJP; Hearn AS; Cabelli DE; Lepock JR; Stroupe ME; Tainer JA; Nick HS; Silverman DN Biochemistry 2004, 43, 7038–7045. [DOI] [PubMed] [Google Scholar]
- (42).Hearn AS; Stroupe ME; Cabelli DE; Ramilo CA; Luba JP; Tainer JA; Nick HS; Silverman DN Biochemistry 2003, 42, 2781–2789. [DOI] [PubMed] [Google Scholar]
- (43).Ramilo CA; Leveque V; Guan Y; Lepock JR; Tainer JA; Nick HS; Silverman DN J. Biol. Chem. 1999, 274, 27711–27716. [DOI] [PubMed] [Google Scholar]
- (44).Han WG; Lovell T; Noodleman L Inorg. Chem. 2002, 41, 205–218. [DOI] [PubMed] [Google Scholar]
- (45).Slykhouse TO; Fee JA J. Biol. Chem. 1976, 251, 5472–5477. [PubMed] [Google Scholar]
- (46).Sorkin DL; Miller A-F Biochemistry 1997, 36, 4916–4924. [DOI] [PubMed] [Google Scholar]
- (47).Vance CK; Miller A-F Biochemistry 1998, 37, 5518–5527. [DOI] [PubMed] [Google Scholar]
- (48).Barik S In Methods in Molecular Biology; PCR Cloning Protocols: From Molecular Cloning to Genetic Engineering; White BA, Ed.; Humana Press: Totowa N.J., 1989; pp 173–182. [Google Scholar]
- (49).Carter P Anal. Biochem. 1971, 40, 450–458. [DOI] [PubMed] [Google Scholar]
- (50).Yikilmaz E; Porta J; Grove LE; Vahedi-Faridi A; Bronshteyn Y; Brunold TC; Borgstahl GEO; Miller A-F J. Am. Chem. Soc. 2007, 129, 9927–9940. [DOI] [PubMed] [Google Scholar]
- (51).Baerends EJ; Ellis DE; Ros P Chem. Phys. 1973, 2, 41. [Google Scholar]
- (52).Versluis L; Ziegler T J. Chem. Phys. 1988, 88, 322–328. [Google Scholar]
- (53).te Velde G; Baerends EJ J. Comput. Phys. 1992, 99, 84–98. [Google Scholar]
- (54).Guerra CF; Snijders JG; te Velde G; Baerends EJ Theor. Chem. Acc. 1998, 99, 391–403. [Google Scholar]
- (55).Vosko SH; Wilk L; Nusair M Can. J. Phys. 1980, 58, 1200. [Google Scholar]
- (56).Becke AD J. Chem. Phys. 1986, 84, 4524–4529. [Google Scholar]
- (57).Perdew JP Phys. Rev. B 1986, 33, 8822–8824. [DOI] [PubMed] [Google Scholar]
- (58).Woo TK; Cavallo L; Ziegler T Theor. Chem. Acc. 1998, 100, 307–313. [Google Scholar]
- (59).Cornell WD; Cieplak R; Bayly CI; Gould IR; Merz KM Jr.; Ferguson DM; Spellmeyer DC; Fox T; Caldwell JW; Kollman PA J. Am. Chem. Soc. 1995, 117, 5179–5197. [Google Scholar]
- (60).Laskowski RA; MacArthur MW; Moss DS; Thornton JM J. Appl. Crystallogr. 1993, 26, 283–291. [Google Scholar]
- (61).Neese F (2005) ORCA-An ab Initio, Density Functional, and Semiempirical SCF-MO Package, 2.4, Max-Planck-Institut für Bioanorganische Chemie, Mülheim an der Ruhr, Germany. [Google Scholar]
- (62).Becke AD J. Chem. Phys. 1993, 98, 1372–1377. [Google Scholar]
- (63).Becke AD J. Chem. Phys. 1993, 98, 5648–5652. [Google Scholar]
- (64).Lee C; Yang W; Parr RG Phys. Rev. B 1988, 37, 785–789. [DOI] [PubMed] [Google Scholar]
- (65).Schäfer A; Horn H; Ahlrichs R J. Chem. Phys. 1992, 97, 2571–2577. [Google Scholar]
- (66).Weigand F; Häser M Theor. Chem. Acc. 1997, 97, 331–340. [Google Scholar]
- (67).Schäfer A; Huber C; Ahlrichs R J. Chem. Phys. 1994, 100, 5829–5835. [Google Scholar]
- (68).Laaksonen L J. Mol. Graphics 1992, 10, 33–34. [DOI] [PubMed] [Google Scholar]
- (69).Bergman D; Laaksonen L; Laaksonen A J. Mol. Graphics Modell. 1997, 15, 301–306. [DOI] [PubMed] [Google Scholar]
- (70).Bauerschmitt R; Ahlrichs R Chem. Phys. Lett. 1996, 256, 454–464. [Google Scholar]
- (71).Casida EM; Jamorski C; Casida KC; Salahub DR J. Chem. Phys. 1998, 108, 4439–4449. [Google Scholar]
- (72).Stratman RE; Scuseria GE; Frisch MJ J. Chem. Phys. 1998, 109, 8218–8224. [Google Scholar]
- (73).Hirata S; Head-Gordon M Chem. Phys. Lett. 1999, 302, 375–382. [Google Scholar]
- (74).Hirata S; Head-Gordon M Chem. Phys. Lett. 1999, 314, 291–299. [Google Scholar]
- (75).Neese F; Olbrich G Chem. Phys. Lett. 2002, 362, 170–178. [Google Scholar]
- (76).Klamt A; Schüürmann G J. Chem. Soc., Perkin Trans. 2 1993, 799–805. [Google Scholar]
- (77).Bondi A J. Phys. Chem. 1964, 68, 441–451. [Google Scholar]
- (78).Klamt A; Jonas V; Bürger T; Lohrenz JCW J. Phys. Chem. A 1998, 102, 5074–5085. [Google Scholar]
- (79).Ridley J; Zerner MC Theor. Chem. Acc. 1973, 32, 111. [Google Scholar]
- (80).Zerner MC; Loew GH; Kirchner RF; Mueller-Westerhof UT J. Am. Chem. Soc. 1980, 102, 589. [Google Scholar]
- (81).Bacon AD; Zerner MC Theor. Chem. Acc. 1979, 53, 21. [Google Scholar]
- (82).Li J; Fisher CL; Konecny R; Bashford D; Noodleman L Inorg. Chem. 1999, 38, 929–939. [DOI] [PubMed] [Google Scholar]
- (83).Solomon EI; Lever ABP Inorganic Electronic Structure and Spectroscopy; Wiley: New York, 1999. [Google Scholar]
- (84).Deaton JC; Gebhard MS; Koch SA; Millar M; Solomon EI J. Am. Chem. Soc. 1988, 110, 6241–6243. [DOI] [PubMed] [Google Scholar]
- (85).Deaton JC; Gebhard MS; Solomon EI Inorg. Chem. 1989, 28, 877–889. [Google Scholar]
- (86).Gebhard MS; Deaton JC; Koch SA; Millar M; Solomon EI J. Am. Chem. Soc. 1990, 112, 2217–2231. [DOI] [PubMed] [Google Scholar]
- (87).Neese F; Solomon EI Inorg. Chem. 1999, 38, 1847–1865. [DOI] [PubMed] [Google Scholar]
- (88).Oganesyan VS; George SJ; Cheesman MR; Thomson AJ J. Chem. Phys. 1999, 110, 762–777. [Google Scholar]
- (89).Oganesyan VS; Thomson AJ J. Chem. Phys. 2000, 113, 5003–5017. [Google Scholar]
- (90).Whittaker JW; Solomon EI J. Am. Chem. Soc. 1988, 110, 5329–5339. [Google Scholar]
- (91).Note that the different nesting behavior of the VTVH MCD curves for Q69E Fe2+SOD is caused primarily by a larger linear B-term contribution to the MCD intensity.
- (92).Neese F J. Biol. Inorg. Chem. 2006, 11, 702–711. [DOI] [PubMed] [Google Scholar]
- (93).Slater JC The Calculation of Molecular Orbitals; John Wiley & Sons: New York, 1979. [Google Scholar]
- (94).Stückl AC; Daul CA; Güdel HU Int. J. Quantum Chem 1997, 61, 579–588. [Google Scholar]
- (95).Two different DFT functionals were used in QM/MM geometry optimizations and single-point calculations, BP and B3LYP, respectively; however, both functionals yielded nearly identical computed bonding descriptions (see Supporting Information for MO energies, occupations, and compositions).
- (96).Akesson R; Pettersson LGM; Sandström M; Siegbahn PEM; Wahlgren U J. Phys. Chem. 1992, 96, 10773–10779. [Google Scholar]
- (97).Cotton FA; Daniels LM; Murillo CA; Quesada JF Inorg. Chem. 1993, 32, 4861–4867. [Google Scholar]
- (98).As for the oxidized models, DFT calculations on the reduced models were performed with both the BP and B3LYP functionals to ensure that the choice of functional did not strongly affect the outcome of the calculation. The results obtained using the B3LYP functional are discussed in the text, while those obtained by employing the BP functional are included in the Supporting Information.
- (99).For ease of comparison, only the spin-down MOs are shown as the spin polarization intrinsic to high-spin (S=5/2) Fe3+ complexes leads to a stabilization of the Fe3+ 3d-based occupied spin-up MOs relative to their unoccupied spin-down counterparts, thus resulting in a large admixture of ligand orbital character to the former.
- (100).Renault JP; Verchere-Beaur C; Morgenstern-Badarau I; Yamakura F; Gerloch M Inorg. Chem. 2000, 39, 2666–2675. [DOI] [PubMed] [Google Scholar]
- (101).Yamakura F; Matsumoto T; Kobayashi K Frontiers of reactive oxygen species in biology and medicine; Elsevier Science, Amsterdam, 1994. [Google Scholar]
- (102).Miller A-F; Sorkin D; Padmakumar K Biochemistry 2005, 44, 5969–5981. [DOI] [PubMed] [Google Scholar]
- (103).Xie J; Yikilmaz E; Miller A-F; Brunold TC J. Am. Chem. Soc. 2002, 124, 3769–3774. [DOI] [PubMed] [Google Scholar]
- (104).Whittaker MM; Whittaker JW Biochemistry 1996, 35, 6762–6770. [DOI] [PubMed] [Google Scholar]
- (105).Edwards RA; Whittaker MM; Whittaker JW; Baker EN; Jameson GB Biochemistry 2001, 40, 15–27. [DOI] [PubMed] [Google Scholar]
- (106).Hunter T; Ikebukuro K; Bannister WH; Bannister JV; Hunter GJ Biochemistry 1997, 36, 4925–4933. [DOI] [PubMed] [Google Scholar]
- (107).Borgstahl GEO; Pokross M; Chechab R; Sekher A; Snell EH J. Mol. Biol. 2000, 296, 951–959. [DOI] [PubMed] [Google Scholar]
- (108).Li J; Fisher CL; Konecny R; Lovell T; Bashford D; Noodleman L J. Inorg. Biochem. 1999, 74, 212–212. [Google Scholar]
- (109).Leveque VJP; Stroupe ME; Lepock JR; Cabelli DE; Tainer JA; Nick HS; Silverman DN Biochemistry 2000, 39, 7131–7137. [DOI] [PubMed] [Google Scholar]
- (110).Jackson TA; Karapetian A; Miller A-F; Brunold TC Biochemistry 2005, 44, 1504–1520. [DOI] [PubMed] [Google Scholar]
- (111).Hearn AS; Stroupe ME; Cabelli DE; Lepock JR; Tainer JA; Nick HS; Silverman DN Biochemistry 2001, 40, 12051–12058. [DOI] [PubMed] [Google Scholar]
- (112).Hsu J-L; Hsieh YS; Tu CK; O’Connor D; Nick HS; Silverman DN J. Biol. Chem. 1996, 271, 17687–17691. [DOI] [PubMed] [Google Scholar]
- (113).McCandlish E; Miksztal AR; Nappa M; Sprenger AQ; Valentine JS; Stong JD; Spiro TG J. Am. Chem. Soc. 1980, 102, 4268–4271. [Google Scholar]
Associated Data
This section collects any data citations, data availability statements, or supplementary materials included in this article.