

Abstract
Objective
FOXG1 syndrome is a rare neurodevelopmental disorder associated with heterozygous FOXG1 variants or chromosomal microaberrations in 14q12. The study aimed at assessing the scope of structural cerebral anomalies revealed by neuroimaging to delineate the genotype and neuroimaging phenotype associations.
Methods
We compiled 34 patients with a heterozygous (likely) pathogenic FOXG1 variant. Qualitative assessment of cerebral anomalies was performed by standardized re‐analysis of all 34 MRI data sets. Statistical analysis of genetic, clinical and neuroimaging data were performed. We quantified clinical and neuroimaging phenotypes using severity scores. Telencephalic phenotypes of adult Foxg1+/− mice were examined using immunohistological stainings followed by quantitative evaluation of structural anomalies.
Results
Characteristic neuroimaging features included corpus callosum anomalies (82%), thickening of the fornix (74%), simplified gyral pattern (56%), enlargement of inner CSF spaces (44%), hypoplasia of basal ganglia (38%), and hypoplasia of frontal lobes (29%). We observed a marked, filiform thinning of the rostrum as recurrent highly typical pattern of corpus callosum anomaly in combination with distinct thickening of the fornix as a characteristic feature. Thickening of the fornices was not reported previously in FOXG1 syndrome. Simplified gyral pattern occurred significantly more frequently in patients with early truncating variants. Higher clinical severity scores were significantly associated with higher neuroimaging severity scores. Modeling of Foxg1 heterozygosity in mouse brain recapitulated the associated abnormal cerebral morphology phenotypes, including the striking enlargement of the fornix.
Interpretation
Combination of specific corpus callosum anomalies with simplified gyral pattern and hyperplasia of the fornices is highly characteristic for FOXG1 syndrome.
Introduction
FOXG1 syndrome (OMIM #613454), initially designated “congenital variant of Rett syndrome”, is a rare neurodevelopmental disorder associated with heterozygous variants in the forkhead box G1 (FOXG1) gene or chromosomal microaberrations in 14q12 involving FOXG1.1, 2, 3 The genetic and phenotypic spectrum is expanding.4, 5, 6, 7, 8 In contrast to classical Rett syndrome with consistently normal neuroimaging, cerebral malformations were shown to be part of the phenotype of FOXG1 syndrome. Previous case reports and small case series described gyral simplification/simplified gyral pattern, enlarged lateral ventricles, diminished white matter volume in the frontal lobes, corpus callosum anomalies, and mild frontal pachygyria.3, 8, 9, 10, 11, 12, 13, 14
This study aimed at a more detailed assessment of the structural brain anomalies in FOXG1 syndrome as revealed by cerebral MRI, based on a standardized analysis of a large series (n = 34) of MRI data sets by a single team of investigators. Furthermore, we searched for associations between genotype and neuroimaging phenotype as well as associations between clinical and neuroimaging phenotype.
A mouse model was used to reproduce the effect of heterozygous loss of Foxg1 function on the development of telencephalic structures15 using immunohistological stainings followed by quantitative evaluation of various attendant structural anomalies.
Patients and methods
Using an email based acquisition of rare neurological disorders in childhood (“Erhebung Seltener Neurologischer Erkrankungen im Kindesalter, ESNEK”)16 and in an ongoing collaboration with pediatric neurologists, neuroradiologists and human geneticists from Germany, Switzerland, and the United States we compiled data from 10 new and 24 previously reported7 patients with a heterozygous FOXG1 variant. We recruited patients between February 2015 and September 2017.
Inclusion criteria for this study comprised (1) pathogenic or likely pathogenic intragenic FOXG1 variant according to the recommendations for interpretation of sequence variants published by the American College of Medical Genetics and Genomics (ACMG)17, (2) availability of cranial MRI data sets, and (3) written informed consent from the parents or legal guardians.
We excluded patients with chromosomal microaberrations in 14q12 involving additional genes adjacent to the FOXG1 gene. Thus we obviated impact of mutations in other genes on clinical and neuroimaging features and avoided blurring the borders of the FOXG1‐associated phenotype.
Clinical data were generated by review of the clinical histories and follow‐up investigations. Missing data were collected through telephone interview with the parents using a standardized questionnaire.
This study was approved by the ethics committee of the Faculty of Medicine, University of Göttingen. Written informed consent was obtained from all families.
Clinical phenotype
We roughly quantified the clinical phenotypes associated with pathogenic FOXG1 variants in all 34 patients using a previously reported FOXG1 severity score.7 This score was obtained by averaging 17 phenotypic items in four categories: somatic growth (4 items), motor and speech development (4 items, if applicable according to patient′s age), behavior (3 items), and neurological features (6 items) (Table 1).
Table 1.
FOXG1 clinical severity score (adapted and modified from Mitter et al.7)
| Score | |||
|---|---|---|---|
| Clinical feature | Point score 0 | Point score 1 | Point score 2 |
| Somatic growth | |||
| Body length at last follow‐up | Normal | <−2 SD | |
| BMI at last follow‐up | Normal | <−2 SD | |
| Head circumference at birth | Normal | <−2 SD | |
| Head circumference at last follow‐up | Normal | <−2 SD | |
| Motor development | |||
| Sitting (for patients aged >12 months) | Unsupported | Supported | No |
| Walking (for patients aged >24 months) | Unsupported | Supported | No |
| Functional hand use (for patients aged >12 months) | Yes | No | |
| Speech development | |||
| Expressive speech (for patients aged >24 months) | Yes | No | |
| Behavior | |||
| Social interaction | Yes | No | |
| Eye contact | Yes | Poor | No |
| Abnormal sleep patterns | No | Yes | |
| Neurological features | |||
| Epilepsy | No | Yes | |
| Spasticity | No | Yes | |
| Stereotypic movements | No | Yes | |
| Dyskinesia | No | Yes | |
| Feeding difficulties | No | yes | |
| Kyphoscoliosis/Scoliosis | No | Yes | |
| Sum score min 0, max 34 | |||
Phenotypic items were rated on a 0 to 2‐point scale, with higher scores indicating a more severe clinical phenotype. We used the mean of these single item ratings rather than the sum score, as several items related with motor and speech development did not apply to patients younger than two years.
Neuroimaging phenotype
All 34 MRI data sets were analyzed by two pediatric neurologists with experience in neuroimaging of neurodevelopmental disorders (MP, MS). They scrutinized all available imaging sequences in axial, coronal, and sagittal orientation with focus on cortical malformations and gyral pattern, morphology of corpus callosum and basal ganglia, as well as cortical and subcortical volume (Fig. 1).
Figure 1.
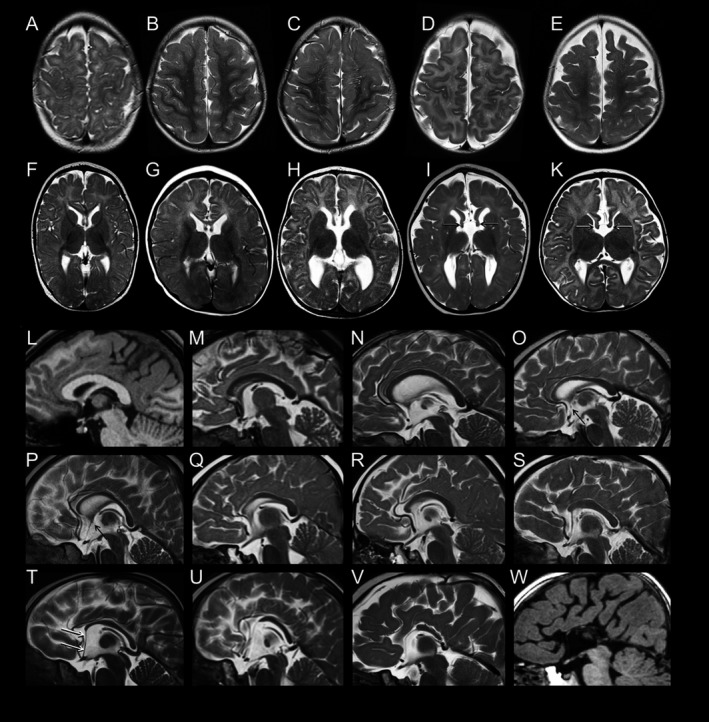
Spectrum of structural brain anomalies in FOXG1 syndrome revealed by neuroimaging. Gyral pattern: (A–E) T2‐weighted axial MR images of the fronto‐parietal area in five patients with FOXG1 point mutations show (A, patient #17) normal gyral pattern; (B, #28) mild and (C, #32) moderate simplified gyral pattern; as well as (D, #29; E, #24) simplified gyral pattern with dilated subarachnoid CSF spaces. Basal ganglia and fornices: (F–K) T2‐weighted axial MR images at the level of the basal ganglia show (F, #17) normal basal ganglia, (G, #6) small basal ganglia relative to thalamus, (H, #24; I, #34) dilated ventricles, and (I, #34; K, #8) thickened fornices (arrows). Corpus callosum: (L, W) T1‐weighted and (M through V) T2‐weighted midsagittal MR images show the spectrum of anomalies of the corpus callosum (CC), ranging from (L, #22) normal CC over various degrees (M, #2; N, #33; O, #17; P, #15; Q, #6) of relative thinning of the anterior portions, (R, #18; S, #16) absent rostrum, (T, #8; U, #9; V, #34) partial agenesis of anterior parts to (W, #1) almost complete agenesis. Note the characteristic elongation of the lamina terminalis stretching from the anterior end of the malformed CC to the bottom of the third ventricle (white arrows in T). An anterior commissure is visible only in the milder variants (L–P; black arrows in O, P).
Based on previous descriptions in the literature3 and the evolving evaluation of our MRI data sets we developed a new FOXG1 neuroimaging severity score (Table 2). This score covered the following items: simplified gyral pattern, hypoplasia of basal ganglia, enlargement of inner CSF spaces, corpus callosum anomalies, fornix anomalies, and hypoplasia of frontal lobes. These items were rated each with 0 to 1 or 0 to 3 points, depending on the respective item. Thus, completely normal MRI findings resulted in a score of 0 points, while a maximum score of 8 points indicated the most severe neuroimaging anomalies.
Table 2.
FOXG1 neuroimaging severity score
| Score | ||||
|---|---|---|---|---|
| MRI feature | Point score 0 | Point score 1 | Point score 2 | Point score 3 |
| Simplified gyral pattern | Absent | Present | ||
| Basal ganglia | Normal | Hypoplasia | ||
| Inner CSF spaces | Normal | Enlarged | ||
| Corpus callosum | Normal | Thinning | Partial agenesis | Complete agenesis |
| Fornix | Normal | Thickening | ||
| Frontal lobes | Normal | Hypoplasia | ||
| Sum score min = 0, max = 8 | ||||
Delay of myelination, although observed in numerous patients, was not included in this score, as it shows a strong age dependency. Most patients with delayed myelination eventually reach a mature appearance, albeit later than healthy controls. Therefore, when MRI is performed later in life, this item would erroneously be scored as “normal”.
Genotype
Molecular genetic data were compiled from former clinical testing. As conducted previously by Mitter et al.7, we divided the patients into five genetic subgroups according to the type and location of their variant within the following five specific FOXG1 domains: (1) N‐terminal domain frameshift and nonsense variants (n = 16), (2) forkhead domain conserved site 1 missense variants (n = 8), (3) forkhead domain except conserved site 1 frameshift and nonsense variants (n = 3), (4) forkhead domain except conserved site 1 missense variants (n = 3), and (5) C‐terminal domain frameshift and nonsense variants (n = 4). This classification formed the basis for statistical analysis of genotype‐phenotype associations.
Mouse model
Foxg1+/− mice18 were maintained in a C56BL/6 background. All mouse experiments were approved by the animal welfare committees of the University Medical Center Göttingen and local authority (LAVES: Niedersächsisches Landesamt für Verbraucherschutz und Lebensmittelsicherheit) under the license numbers: 14/1636 and 16/2330.
Anesthesia and perfusion fixation
For immunohistochemical analysis of the adult mouse brain, good tissue preservation is necessary. The commonly used postmortem immersion fixation is in many cases not sufficient. For this purpose, tissue morphology can be achieved by in vivo perfusion fixation with 4% paraformaldehyde (PFA). The animals were under constant anesthesia with ∼3% isoflurane. The anesthesia is designed so that the animals do not wake up afterwards. The fixans is administered intracardially in anesthetized mice and transported directly via the vascular system.
Immunohistochemistry
Immunohistochemistry (IHC) was performed as previously described.19, 20 Briefly, brains from adult mice were perfused with 4% PFA and incubated overnight in 30% sucrose. Matched sections with 20 μm thickness from both wild type and mutant brain were incubated overnight with primary antibodies: MBP (Cat. MAB386, Chemicon, dilution 1:100), DARPP32 (Cat. AB1656, Chemicon, dilution 1:100) at 4°C after blocking with normal goat serum. Primary antibodies were detected with a fluorescent secondary antibody (Alexa Fluor, 1:400; Invitrogen). Sections were later counterstained with Vectashield mounting medium containing DAPI (Vector laboratories) to label nuclei. Images were acquired with standard Axio Imager M2 (Zeiss) fluorescence microscopes. Images were further analyzed with Adobe Photoshop and NeuroLucida/StereoInvestigator.
Relative quantification of mouse brain structures and statistical analysis
Parameters of mouse brain size were measured and analyzed as described previously.21, 22 Briefly, 20 μm thick coronal sections collected from the rostral to caudal parts (corresponding to the levels 1 to 4) of the fornix in adult mutant and control brains (n = 4) were selected for the cerebral phenotype analysis (Figs. 2 and 3). The immunostained sections spanning the entire fornix structure in WT and Foxg1+/− forebrain and their images were used for quantitative analyses (Figs. 2 and 3). Cortical thickness (Cx) as well as the area of striatum (Str, MBP+, DARPP32+), basal ganglia (BG, MBP+), fornix (F, MBP+), and corpus callosum (CC, MBP+) were measured and compared in brain section images of mutants and controls using the NIH ImageJ software.
Figure 2.
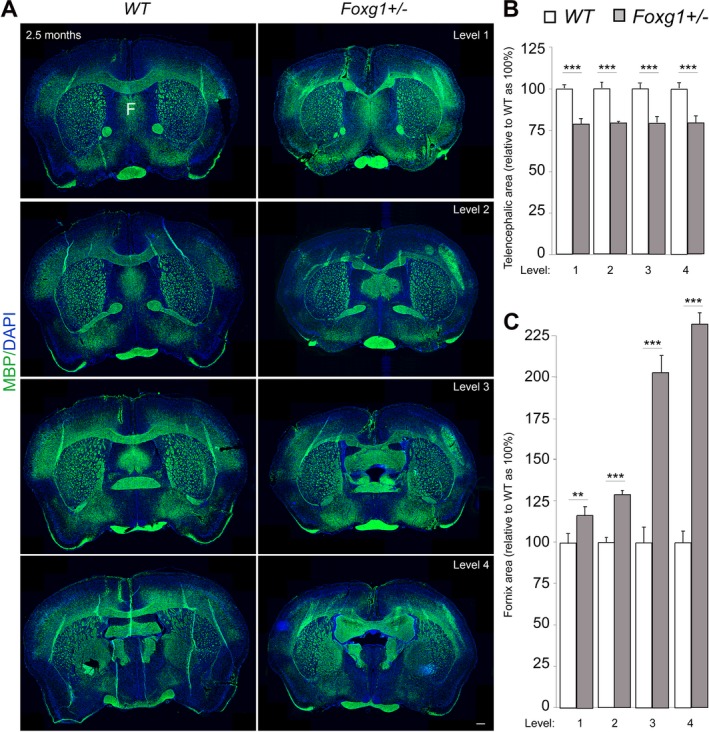
Heterozygous deletion of Foxg1 causes abnormal brain morphology in mice. (A) Immunostaining of MBP and DAPI in coronal sections at different levels (rostral‐caudal) of wild type (WT) and mutant (Foxg1+/−) adult (2.5 months) mouse brain to visualize cross‐section of the entire forebrain and white matter commissural structures like the corpus callosum and fornix (F). (B, C) Bar charts depicting summary of the quantitative analysis of the area of the entire adult mouse telencephalon and fornix, respectively. The cerebral area is significantly reduced (B) while the fornix is conspicuously expanded (C) in mutant brains as compared with controls. The fornix is consistently expanded across its entire structure from rostral to caudal (level 1‐4) (C). Values are presented as means ± SEMs (**P < 0.01, ***P < 0.005). Experimental replicates (n) = 4; Scale bar: 100 μm.
Figure 3.
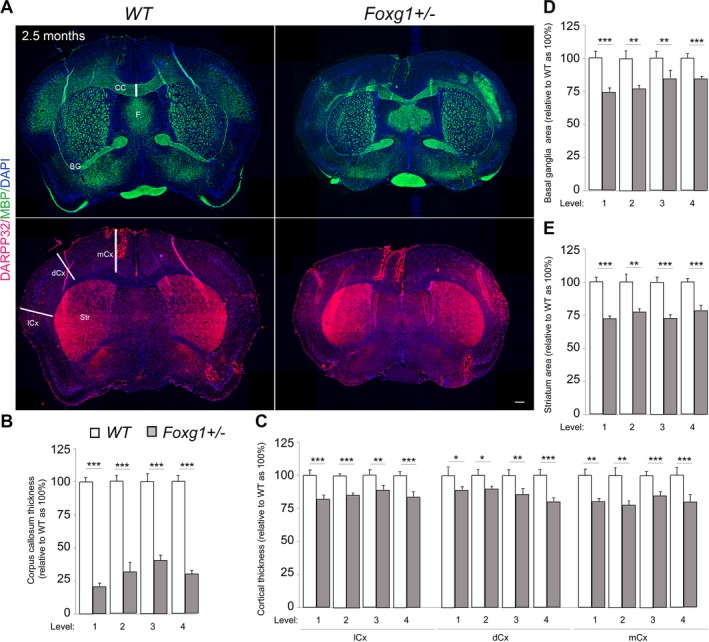
Further discrete cerebral anomalies in Foxg1+/− mouse brain sections. (A) Immunostaining of MBP, DARPP32 and DAPI in coronal sections of wild type (WT) and mutant (Foxg1+/−) adult (2.5 months) mouse brain to visualize gray matter areas such as the Cortex (Cx) and basal ganglia (BG) or Striatum (Str), and white matter commissural systems like the corpus callosum (CC) and fornix (F). (B–E) Bar charts showing summary of the quantitative analysis of forebrain structure alterations in mutants (Foxg1+/−) at various section levels (1‐4) as compared with controls. The thickness of the corpus callosum (B) and distinct cortical domains like the medial cortex (mCx) dorsal cortex (dCx), and lateral cortex (lCx) (C) are significantly reduced in mutants. The areas of the BG (D) and Str (E) are significantly reduced in mutant telencephalon as compared with that of controls. Values are presented as means ± SEMs (*P < 0.05, **P < 0.01, ***P < 0.005). Experimental replicates (n) = 4; Scale bar: 100 μm.
Statistical methods
Patient data were summarized by mean ± standard deviation as well as median (minimum, maximum) for continuous variables, and by absolute and relative frequencies for categorical variables. Binary variables were compared between mutation groups using logistic regression, whereas ordinal regression was used for corpus callosum anomaly comparison. The clinical score was tested for differences between the mutation groups using the nonparametric Kruskal‐Wallis‐Test in case of several mutation groups and using the Mann‐Whitney‐U test in case of two mutation groups. The MRI severity score was tested for differences between the mutation groups using one‐way ANOVA in case of several mutation groups and using the Student′s t‐test in case of two mutation groups.
The test for correlation was calculated based on the nonparametric Kendall's τ.
Statistical analysis of the histological data was done using Student's t‐test and related bar graphs are plotted as mean ± SEM. Details of statistical analysis for the histological data are presented in Supplementary Table 1.
The significance level was set to α = 5%. All analyses were performed within the statistical programming environment R (version 3.4.4, www.r-project.org), using the package ordinal to perform the ordinal regression.
Results
We compiled clinical and genetic data as well as MRI data sets from 34 patients with intragenic heterozygous FOXG1 variants. This cohort comprised 16 male and 18 female individuals, with ages at last clinical follow‐up ranging from 10 months to 17 years (mean 4 years 11 months) and ages at MRI ranging from 2 months to 16 years (mean 2 years 3 months). Clinical, genetic, and neuroimaging features are summarized in Table 3 and displayed in more detail in Supplementary Table 2 (accessible for direct download).
Table 3.
Genetic features, clinical severity scores and MRI severity scores in 34 patients with FOXG1 syndrome
| Pt. no. | No. in Mitter et al.7 | Sex | FOXG1 variant cDNA level | Protein level | Coding effect | FOXG1 domain | Mutat. group | Agea | FOXG1 CSS | Age MRI | MRI SS* |
|---|---|---|---|---|---|---|---|---|---|---|---|
| 1 | 1 | M | c.256delC | p.Q86Rfs*106 | Frameshift | N‐terminal | 1 | 40 | 0.94 | 12 | 8 |
| 2 | 2 | M | c.214C>T | p.Q72* | Nonsense | N‐terminal | 1 | 51 | 1.25 | 48 | 5 |
| 3 | 3 | M | c.406G>T | p.E136* | Nonsense | N‐terminal | 1 | 33 | 1.44 | 7 | 5 |
| 4 | 4 | F | c.460dupG | p.E154Gfs*301 | Frameshift | N‐terminal | 1 | 100 | 1.12 | 7 | 6 |
| 5 | 5 | F | c.385delG | p.E129Sfs*63 | Frameshift | N‐terminal | 1 | 23 | 1.24 | 36 | 1 |
| 6 | 6 | F | c.460delG | p.E154Rfs*38 | Frameshift | N‐terminal | 1 | 39 | 1.50 | 6 | 4 |
| 7 | 7 | M | c.460dupG | p.E154Gfs*301 | Frameshift | N‐terminal | 1 | 72 | 1.38 | 12 | 4 |
| 8 | 8 | F | c.460dupG | p.E154Gfs*301 | Frameshift | N‐terminal | 1 | 45 | 1.44 | 5 | 5 |
| 9 | 9 | M | c.460dupG | p.E154Gfs*301 | Frameshift | N‐terminal | 1 | 61 | 1.29 | 12 | 7 |
| 10 | 10 | F | c.517G>T | p.E173* | Nonsense | N‐terminal | 1 | 30 | 1.14 | 24 | 4 |
| 11 | 11 | M | c.543G>C | p.K181N | Missense | Forkhead cs | 2 | 82 | 0.24 | 60 | 5 |
| 12 | 13 | F | c.545C>A | p.P182Q | Missense | Forkhead cs | 2 | 85 | 0.71 | 24 | 0 |
| 13 | 14 | M | c.553A>T | p.S185C | Missense | Forkhead cs | 2 | 93 | 1.06 | 12 | 2 |
| 14 | 16 | F | c.561C>A | p.N187K | Missense | Forkhead cs | 2 | 62 | 1.60 | 12 | 4 |
| 15 | 18 | F | c.565C>T | p.L189F | Missense | Forkhead cs | 2 | 33 | 1.00 | 11 | 5 |
| 16 | 19 | F | c.581T>G | p.l194S | Missense | Forkhead cs | 2 | 72 | 1.25 | 10 | 5 |
| 17 | 20 | F | c.592_594delCCC | p.P198del | In frame del | Forkhead | 3 | 25 | 0.71 | 10 | 0 |
| 18 | 21 | M | c.609_616delGCTCAACG | p.L204Hfs*248 | Frameshift | Forkhead | 3 | 46 | 1.24 | 4 | 6 |
| 19 | 22 | M | c.624C>G | p.Y208* | Nonsense | Forkhead | 3 | 38 | 1.35 | 12 | 6 |
| 20 | 25 | M | c.974dupT | p.L325Ffs*130 | Frameshift | C‐terminal | 5 | 89 | 0.81 | 12 | 2 |
| 21 | 26 | F | c.1082dupG | p.L362Pfs*93 | Frameshift | C‐terminal | 5 | 31 | 1.29 | 12 | 4 |
| 22 | 27 | F | c.1141delG | p.A381Pfs*4 | Frameshift | C‐terminal | 5 | 204 | 0.47 | 192 | 0 |
| 23 | 28 | F | c.755G>A | p.G252D | Missense | Forkhead | 4 | 192 | 1.47 | 192 | 1 |
| 24 | 29 | F | c.921C>G | p.Y307* | Nonsense | C‐terminal | 5 | 33 | 1.29 | 6 | 6 |
| 25 | ‐ | M | c.561C>G | p.N187K | Missense | Forkhead cs | 2 | 68 | 1.18 | 2 | 3 |
| 26 | ‐ | F | c.460dupG | p.E154Gfs*301 | Frameshift | N‐terminal | 1 | 63 | 1.62 | 65 | 6 |
| 27 | ‐ | M | c.674G>C | p.W225S | Missense | Forkhead | 4 | 19 | 0.93 | 4 | 4 |
| 28 | ‐ | F | c.256delC | p.Q86Rfs*106 | Frameshift | N‐terminal | 1 | 132 | 1.19 | 60 | 5 |
| 29 | ‐ | F | c.256delC | p.Q86Rfs*106 | Frameshift | N‐terminal | 1 | 10 | 0.92 | 4 | 5 |
| 30 | ‐ | F | c.479delG | p.G160Afs*32 | Frameshift | N‐terminal | 1 | 32 | 1.06 | 6 | 3 |
| 31 | ‐ | M | c.688C>T | p.Arg230Cys | Missense | Forkhead | 4 | 24 | 0.62 | 3 | 4 |
| 32 | ‐ | F | c.460dupG | p.E154Gfs*301 | Frameshift | N‐terminal | 1 | 33 | 1.12 | 6 | 5 |
| 33 | ‐ | M | c.136dupC | p.Q46Pfs*75 | Frameshift | N‐terminal | 1 | 34 | 1.06 | 6 | 5 |
| 34 | ‐ | M | c.566T>C | p.L189P | Missense | Forkhead cs | 2 | 17 | 1.33 | 12 | 5 |
f = female; m = male; forkhead cs = forkhead conserved site; CSS = clinical severity score (mean), min = 0, max = 2; Agea = Age at last follow up (months); Age MRI = Age at MRI (months); MRI SS* = MRI severity score, min = 0, max = 8.
Genotype analysis
Genetic and clinical features of patients 1–24 were previously described.7 Among the 10 new patients, the heterozygous FOXG1 variant occurred de novo in eight patients. In two patients with FOXG1 variants reported previously, parents were not available for testing. There were five novel variants. Detailed genetic features are given in Table 3 and Supplementary Table 2 (accessible for direct download).
Neuroimaging features
Table 4 and Figure 1 display the results of standardized qualitative analysis of the 34 MRI data sets. Characteristic neuroimaging features ‐ ranked by descending frequency ‐ included corpus callosum anomalies (82%), thickening of the fornix (74%), simplified gyral pattern (56%), enlargement of inner CSF spaces (44%), hypoplasia of basal ganglia (compared with the thalami) (38%), and hypoplasia of frontal lobes (29%). Anomalies of the corpus callosum comprised complete agenesis in one patient, partial agenesis in 22 individuals, and thinning in five patients.
Table 4.
Neuroimaging features assorted by the five mutation groups
| Feature | Mutation group 1 | Mutation group 2 | Mutation group 3 | Mutation group 4 | Mutation group 5 |
|---|---|---|---|---|---|
| n | 16 | 8 | 3 | 3 | 4 |
| FOXG1 clinical severity score | |||||
| Mean ± SD | 1.2 ± 0.2 | 1 ± 0.42 | 1.1 ± 0.34 | 1 ± 0.43 | 0.97 ± 0.4 |
| Median (min; max) | 1.2 (0.92; 1.6) | 1.1 (0.24; 1.6) | 1.2 (0.71; 1.4) | 0.93 (0.62; 1.5) | 1 (0.47; 1.3) |
| Simplified gyral pattern, n (%) | 13 (81.2) | 2 (25.0) | 1 (33.3) | 2 (66.7) | 1 (25.0) |
| Hypoplasia of frontal lobes, n (%) | 2 (12.5) | 4 (50.0) | 2 (66.7) | 1 (33.3) | 1 (25.0) |
| Hypoplasia of basal ganglia, n (%) | 8 (50.0) | 3 (37.5) | 2 (66.7) | 0 (0.0) | 0 (0.0) |
| Enlargement of inner CSF spaces, n (%) | 9 (56.2) | 3 (37.5) | 1 (33.3) | 0 (0.0) | 2 (50.0) |
| Corpus callosum anomalies | |||||
| Thinning, n (%) | 3 (18.8) | 1 (12.5) | 1 (33.3) | 0 (0.0) | 0 (0.0) |
| Partial agenesis, n (%) | 11 (68.8) | 5 (62.5) | 1 (33.3) | 2 (66.7) | 3 (75.0) |
| Complete agenesis, n (%) | 1 (6.2) | 0 (0.0) | 0 (0.0) | 0 (0.0) | 0 (0.0) |
| Thickening of fornices, n (%) | 14 (87.5) | 5 (62.5) | 2 (66.7) | 2 (66.7) | 2 (50.0) |
| MRI severity score | |||||
| Mean ± SD | 4.6 ± 1.4 | 3.5 ± 1.8 | 3.7 ± 3.2 | 3 ± 1.7 | 3 ± 2.6 |
| Median (min; max) | 5 (1; 7) | 4 (0; 5) | 5 (0; 6) | 4 (1; 4) | 3 (0; 6) |
We observed a marked, filiform thinning of the rostrum as recurrent highly typical pattern of corpus callosum anomaly (Fig. 1L–W), in line with the findings of Kortüm et al.3 In addition, we detected distinct thickening of the fornix (Fig. 1I and K) as a characteristic feature in our cohort – a finding which was not reported previously in FOXG1 syndrome and which is uncommon in neurodevelopmental conditions.
MRI was normal in three patients, aged two (#17), seven (#12), and 16 years (#22) at MRI. These patients carry a missense variant in the forkhead domain conserved site 1 (mutation group 2, #17), an in frame deletion in the forkhead domain except conserved site 1 (mutation group 3, #12), and a frameshift variant in the C‐terminal domain (mutation group 5, #22).
Associations between genotype, clinical phenotype and neuroimaging features
Statistical analysis (Table 4) revealed two significant associations:
simplified gyral pattern occurred significantly more frequently in patients with pathogenic frameshift and nonsense variants in the N‐terminal domain (mutation group 1) compared to patients with other variants (mutation groups 2 to 5) (p = 0.008), and
more severe clinical phenotypes as assessed by the FOXG1 clinical severity score were significantly associated with more severe neuroimaging anomalies ascertained by the MRI severity score (Kendall's rank correlation tau: τ = 0.27; P = 0.03) (Fig. 4).
Figure 4.
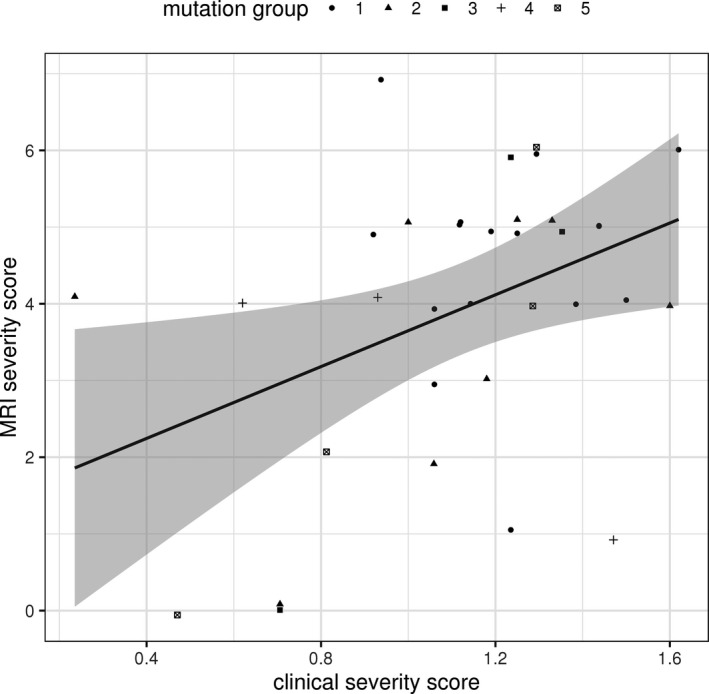
Correlation between clinical severity score and neuroimaging severity score. At the p < 0.05 level there was a significant association found between clinical severity score and neuroimaging severity score (Kendall's rank correlation tau: τ = 0.27; P = 0.03).
Beyond that, no statistically significant associations between genotype and neuroimaging phenotype were found, possibly partially due to small case numbers in the five different mutation groups. However, we found trends for more frequent occurrence of certain neuroimaging features in specific mutation groups. In comparison with mutation group 1, there were tendencies to more frequent occurrence of hypoplasia of the frontal lobes in all other mutation groups 2 to 5 taken together (p = 0.054), and especially in patients with forkhead domain conserved site 1 missense variants and forkhead domain except conserved site 1 frameshift and nonsense variants [mutation groups 2 (P = 0.060) and 3 (P = 0.067)]. On the other hand, we found a tendency for more frequent occurrence of thickening of the fornix in patients from mutation group 1 compared with all other mutation groups taken together (P = 0.096). Hypoplasia of basal ganglia, enlargement of inner CSF spaces and corpus callosum anomalies were evenly distributed over all five mutation groups.
Phenotype of Foxg1+/− mouse brain
To provide evidence that the structural brain anomalies observed in our patients are specifically linked to their FOXG1 variant, we examined telencephalic phenotypes of adult Foxg1+/− mice.18 As patients with FOXG1 syndrome display increased propensity toward enlarged fornix, we focused on the fornix system in our phenotype analysis of Foxg1+/− mouse brain (Figs. 2 and 3). Coronal sections from rostral to caudal aspects of the fornix of WT and Foxg1+/− forebrain were immunostained with antibodies against MBP and DARPP32 to visualize forebrain structures like the cortex (Cx), striatum (Str), basal ganglia (BG), fornix system (F), and corpus callosum (CC).23, 24, 25, 26 Overall, heterozygous loss of Foxg1 function resulted in discernable reduction in forebrain size or volume (Figs. 2 and 3).
Specifically, quantitative analysis revealed significant reduction in the area and/or thickness of the cortex (medial, dorsal, lateral), basal ganglia (striatum) and corpus callosum (Fig. 3). Interestingly, the Foxg1+/− mutant mouse brain also displayed obvious expansion of the fornix system as compared to that in wild type brain. As shown in Fig. 2, the observed abnormal enlargement of the fornix is consistent from the rostral to caudal aspects of the fornix system in mutant brains. Similarly, all other reported cerebral structure alterations were consistent at various coronal section levels of the Foxg1+/− mouse brain. Thus, heterozygous loss of Foxg1 function in mouse brain mimicked most of the cerebral morphologic anomalies observed in the brain MRI data set of our FOXG1 syndrome patients.
Discussion
Standardized evaluation of neuroimaging of 34 patients with pathogenic or likely pathogenic intragenic FOXG1 variants revealed a characteristic pattern of structural brain anomalies predominantly affecting the forebrain. In descending order, we found corpus callosum anomalies, thickening of the fornix, simplified gyral pattern, enlargement of inner CSF spaces, hypoplasia of basal ganglia, and hypoplasia of frontal lobes. While corpus callosum anomalies, simplified gyral pattern, enlarged ventricles, and hypoplasia of frontal lobes were described previously in patients with FOXG1 syndrome,3, 8, 9, 10, 11, 12, 13, 14 thickening of the fornix (in 25 out of 34 patients) and, less specifically, hypoplasia of basal ganglia (in 13 out of 34 patients) have not been reported before. Fornix thickening is thus a major highlight in this current investigation.
By employing mouse mutagenesis strategy, we used heterozygous mutation of the Foxg1 18 in mouse brain which reproduced the cardinal structural anomalies observed in the forebrain of our FOXG1 syndrome patients. Notably, Foxg1 has been reported to be distinctively expressed in cerebral structures, including the telencephalon.18 Since its first identification as a homologue of the HNF‐3/forkhead gene family,27 Foxg1 has been recognized as a key transcription factor which plays a central, nonredundant role in mammalian forebrain development.28 Together with other transcription factors, it induces emergence and expansion of the telencephalon and controls multiple steps of brain circuit formation comprising cell cycle control and neuronal differentiation which afford proper brain development.28
For these reasons, it is conceivable that any form of Foxg1 mutagenesis may result in disturbance of multiple brain structures and functions as reported in this study. The observed reduction in the size of cortical and subcortical structures in our mouse mutants is indicative of microcephaly which is a key feature in FOXG1 syndrome. Importantly, the reproducibility of fornix expansion anomaly in our Foxg1+/− mutant mice highlights this newly reported phenotype as a potential candidate characteristic for defining the FOXG1 syndrome.
Notably, our statistical analysis revealed a significant association between pathogenic frameshift and nonsense variants in the N‐terminal domain (mutation group 1) and simplified gyral pattern on MRI. Furthermore, we found a significant association between the overall clinical severity and general degree of structural brain anomalies, with more severe clinical phenotypes being linked to more pronounced MRI features. At first glance, the latter finding may seem a matter of course. However, regarding corpus callosum anomalies as the most frequent feature found in our cohort, it is well known that even complete agenesis of the corpus callosum occurs in a wide range of clinical conditions, from incidental finding in an individual with mild behavioral problems to sole or additional anomaly in patients with complex and severe neurological impairment.29, 30 Thus, the corpus callosum anomaly taken as an isolated feature does not exclusively account for the serious clinical phenotype in patients with FOXG1 syndrome.
We showed previously, in a larger cohort of patients with FOXG1 syndrome, that pathogenic frameshift and nonsense variants in the N‐terminal domain (mutation group 1) are significantly associated with a more severe overall clinical phenotype.7 We presume that the higher prevalence of simplified gyral pattern in patients from mutation group 1 will likely explain the significant association between degree of MRI features and clinical severity.
Fornix
The fornix is a white matter tract bundle constituted mostly by efferent and afferent fibers between the hippocampi and structures in the diencephalon and basal forebrain, especially the basal ganglia. In humans, the fornix consists of about 1.2 million fibers and is the most distinct hippocampal efferent system.31 Twelve out of the 13 patients with hypoplasia of the basal ganglia presented with thickened or expanded fornices. Functionally, abnormal fornices are known to be associated with episodic memory deficits and several neurocognitive pertubations.
While involvement of the fornix was observed in a wide range of acquired conditions including neoplasia, infection, multiple sclerosis, mesial temporal sclerosis, Wernicke encephalopathy, trauma, and infarction,32 reports of fornix anomalies in neurodevelopmental disorders are rare. For instance, congenital aplasia of the fornix was observed in holoprosencephaly.33 Also, cross‐sectional areas of the fornices and mammillary body volumes were found to be reduced in children with congenital central hypoventilation syndrome.34
Of note, hyperplastic fornix dorsalis as part of hyperplasia of midline structures was disclosed by autopsy of a physically and intellectually normally developed boy who had a resection of a lumbar myelomeningocele shortly after birth and a shunt for.35
Quite recently, a 9‐year‐old girl presented with moderate intellectual disability, thickening of CC, and hyperplastic fornix dorsalis detected by conventional MRI. Diffusion tensor imaging suggested alterations in fornix microstructure, attributable to higher fiber density.36
Asymmetrically or symmetrically thickened fornices were also observed in patients with hemimegalencephaly.37
Aside from these aforementioned reports, we have not come across any other brain conditions involving predisposition to thickening or hyperplasia of the fornix structure as observed in our FOXG1 syndrome patients and corroborated by the mouse model study.
Since standard neuroimaging does not allow for assessment of the fiber density in the fornices, it is indecisive that the observed fornix thickening is caused by hyperplasia. Nonetheless, as MRI signal intensities of the thickened fornices were normal in all patients, we exclude the possibility that the enlargement of the fornix in the brain of our patients is caused by swelling due to edema.
Simplified gyral pattern
Simplified gyral pattern (SGP) is originally a neuropathological term designating a reduction in gyrification complexity which is not pachygyria.38 It was reported in a wide range of genetic conditions, more frequently based on neuroimaging than on neuropathological findings. Defined as “a reduced number of gyri separated by shallow sulci”, it was first described in FOXG1 syndrome in 2011 in each of the 11 patients investigated.3 In the study reported here, standardized qualitative analysis of neuroimaging revealed SGP in 19 out of 34 patients (56%). This discrepancy may partially be owing to different subjective thresholds for denominating an MRI finding as SGP, as, due to the nature of this feature, strict quantitative criteria for SGP are lacking.
Given that the normal murine cortex is smooth or lissencephalic without recognizable gyrification, it was not possible to observe or replicate SGP as one of the reported clinical features seen in FOXG1 syndrome.3 However, although we did not focus on neuron migration patterns in the Foxg1+/− mouse cortex, it is known that loss of function of Foxg1 protein disrupts normal migration of cortical neurons.39, 40, 41
Neuronal migration is a crucial neurodevelopmental process that has been reported, at least in part, to contribute to gyrification of the cortex.42, 43, 44, 45, 46 This may partly provide some basis for the simplified cortical folding phenotype or pachygyria observed in the brain of patients with FOXG1 syndrome. Perhaps, using primates or primate‐like animal model may be useful in studying the gyral pattern phenotype associated to Foxg1 mutagenesis.
Corpus callosum
A large number of genes and processes are involved in callosal development, and the genetic causes of CC agenesis are exceedingly heterogeneous.29, 30, 47 Development of the CC may be disturbed by disruption of neurogenesis, telencephalic midline patterning, neuronal migration and specification, axon guidance, and postguidance development.30 Axonal projections leading to formation of the corpus callosum occur between 11th and 20th week of gestation.48
MRI investigations and mouse model studies provided conflicting results regarding the temporal sequence of axonal extension and formation of the four different parts of the CC: the rostrum, genu, body, and splenium, each connecting distinct areas of the cortex. However, there is some evidence that the lamina rostralis (a part of the rostrum) and the anterior region of the body are the first parts of the CC to develop, possibly pioneered by axons derived from the cingulated cortex and midline glial structures.48 Callosal axons of the caudal region, later forming the body of the CC, are in contrast supposed to follow the axons of the fornix and hippocampal commissure to cross the midline.48
It has been shown in some animal models that morphogenesis of the CC is critically determined by the proper patterning and establishment of midline telencephalic structures such as the midline zipper glia, glial wedge, and indusium griseum. These structures essentially provide guidance for the growth of callosal axons and prevent their detour to the ventral telencephalon during their projection trajectory.29
While these data indicate developmental connections between CC and structures ventral to it like the fornix, the details of these interactions are not yet understood. For instance, in agenesis of the CC, the fornices are usually not malformed.49 It is therefore interesting to observe enlargement of the fornix system in our patients and animal model displaying marked callosal hypogenesis consequent to FOXG1 variants.
Conclusion
Based on both, previous observations and the results presented here, a highly characteristic pattern of neuroimaging features in FOXG1 syndrome is emerging. The combination of corpus callosum anomaly with simplified gyral pattern and hyperplasia of the fornices is possibly pathognomonic for FOXG1 syndrome. All these three features were present in 16 (47%) of the 34 patients in this study, any two of them were found in further nine cases (26%).
Especially the combination of agenesis of the genu corporis callosi with fornix hyperplasia is pointing directly to FOXG1 syndrome. We therefore suggest that, when agenesis or thinning of the anterior parts of the corpus callosum are recognized on midsagittal MRI, the fornices should be specifically assessed subsequently; if found thickened, a strong suspicion of FOXG1 syndrome can be established radiologically.
On the other hand, MRI may exceptionally be completely normal, as it was in three patients in this study. Some of the additional MRI features, e.g. enlargement of inner CSF spaces, are rather unspecific and found in a wide range of neurodevelopmental disorders.
The characteristic clinical features of FOXG1 syndrome comprise primary or secondary microcephaly, impairment of somatic growth, severe global developmental delay, hyperkinetic‐dyskinetic movement disorder, and epilepsy. This phenotype is characteristic, but not specific, as several neurodevelopmental disorders show similar features. Therefore, currently most FOXG1 variants are being found using genetic screening tests including array CGH, multigene panels, or whole exome sequencing. Careful interpretation of neuroimaging in a child with severe developmental delay/intellectual disability may reveal the pattern outlined above and help in evaluation of FOXG1 variants.
Based on clinical reports and animal experimentations, the predominance of structural brain anomalies in patients with heterozygous pathogenic FOXG1 variants is reflective of the essential function of Foxg1 in orchestrating the normal morphogenesis of the brain. However, details of the pathogenesis of the particular cerebral malformations described here remain to be determined.
Future perspectives
As far as we know, MR tractography has not yet been performed in patients with FOXG1 syndrome. Such tractography studies may help clarifying the structural and functional consequences of FOXG1 deficiency in forebrain development. However, as most patients with FOXG1 syndrome are severely disabled and definitely need sedation for MRI, such studies implicate ethical issues if the MR tractography would be performed as an additional investigation subsequent to standard MRI in the course of patient care. Likewise, autoptic histo‐neuropathological investigations could further delineate neuroanatomic alterations associated with deficiency of FOXG1 protein function.
Conflicts of interest
Nothing to report.
Author contributions
M.P., D.M., G.K., M.S. and K.B. contributed to conception and design of the study; M.P., D.M., S.S., R.W., K.P., G.K., M.B., T.B., S.B., H.M.B., E.C., C.C., A.N.D., A.E., T.A.G., A.H‐W., M.H., K.H., A.M.K., S.K., T.K., G.C.K., B.K., R.E.L., H.O., S.P., H.P., K.R., T.R., A.R., M.S., R.W., F.M.Z., B.Z., P.A.U., G.S., T.T., A.L., M.S. and K.B. contributed to acquisition and analysis of data; S.S., P.A.U., G.S., T.T., A.L., M.S. and K.B. contributed to drafting the text and preparing the figures. M.P. and D.M. as well as M.S. and K.B. contributed equally to this work.
Supporting information
Table S1. Quantitative histological data of various cerebral structures in Foxg1+/− mouse model vs. wildtype (WT).
Table S2. Clinical, genetic and neuroimaging features in patients with FOXG1 syndrome.
Acknowledgments
We thank all participating families for their kind cooperation. We acknowledge L. Pham for her technical assistance, T. Huttanus and H. Fett for their expert animal care, J. M. Hebert and S. K. McConnell for providing Foxg1+/− mouse line. This work was supported by funding from the Niedersächsisches Ministerium für Wissenschaft und Kultur, grant no. 74ZN1284 (to KB) as well as by funding from the Research Center Molecular Physiology of the Brain (CNMPB), Deutsche Forschungsgemeinschaft, grant nos. TU432/1‐1, TU432/1‐3 and the Schram‐Stiftung (to TT).
Funding information
This work was supported by funding from the Niedersächsisches Ministerium für Wissenschaft und Kultur, grant no. 74ZN1284 (to KB) as well as by funding from the Research Center Molecular Physiology of the Brain (CNMPB), Deutsche Forschungsgemeinschaft, grant nos. TU432/1‐1, TU432/1‐3 and the Schram‐Stiftung (to TT)
Funding Statement
This work was funded by Niedersächsisches Ministerium für Wissenschaft und Kultur grant 74ZN1284; Research Center Molecular Physiology of the Brain (CNMPB) grant ; Deutsche Forschungsgemeinschaft grants TU432/1‐1 and TU432/1‐3; Schram‐Stiftung grant .
References
- 1. Ariani F, Hayek G, Rondinella D, et al. FOXG1 is responsible for the congenital variant of Rett syndrome. Am J Hum Genet 2008;83(1):89–93. [DOI] [PMC free article] [PubMed] [Google Scholar]
- 2. Mencarelli MA, Kleefstra T, Katzaki E, et al. 14q12 Microdeletion syndrome and congenital variant of Rett syndrome. Eur J Med Genet 2009;52:148–152. [DOI] [PubMed] [Google Scholar]
- 3. Kortüm F, Das S, Flindt M, et al. The core FOXG1 syndrome phenotype consists of postnatal microcephaly, severe mental retardation, absent language, dyskinesia, and corpus callosum hypogenesis. J Med Genet 2011;48:396–406. [DOI] [PMC free article] [PubMed] [Google Scholar]
- 4. Philippe C, Amsallem D, Francannet C, et al. Phenotypic variability in Rett syndrome associated with FOXG1 mutations in females. J Med Genet 2010;47:59–65. [DOI] [PubMed] [Google Scholar]
- 5. De Filippis R, Pancrazi L, Bjørgo K, et al. Expanding the phenotype associated with FOXG1 mutations and in vivo FoxG1 chromatin‐binding dynamics. Clin Genet 2012;82(4):395–403. [DOI] [PubMed] [Google Scholar]
- 6. Cellini E, Vignoli A, Pisano T, et al. The hyperkinetic movement disorder of FOXG1‐related epileptic‐dyskinetic encephalopathy. Dev Med Child Neurol 2016;58(1):93–97. [DOI] [PubMed] [Google Scholar]
- 7. Mitter D, Pringsheim M, Kaulisch M, et al. FOXG1 syndrome: Genotype‐phenotype association in 83 patients with FOXG1 variants. Genet Med 2018;20:98–108. [DOI] [PubMed] [Google Scholar]
- 8. Caporali C, Signorini S, De Giorgis V, et al. Early‐onset movement disorder as diagnostic marker in genetic syndromes: Three cases of FOXG1‐related syndrome. Eur J Paediatr Neurol 2018;22:336–339. [DOI] [PubMed] [Google Scholar]
- 9. Bahi‐Buisson N, Nectoux J, Girard B, et al. Revisiting the phenotype associated with FOXG1 mutations: Two novel cases of congenital Rett variant. Neurogenetics 2010;11:241–249. [DOI] [PubMed] [Google Scholar]
- 10. Le Guen T, Fichou Y, Nectoux J, et al. A missense mutation within the fork‐head domain of the forkhead box G1 Gene (FOXG1) affects its nuclear localization. Hum Mutat 2011;32(2):35. [DOI] [PubMed] [Google Scholar]
- 11. Mencarelli MA, Spanhol‐Rosseto A, Artuso R, et al. Novel FOXG1 mutations associated with the congenital variant of Rett syndrome. J Med Genet 2010;47:49–53. [DOI] [PubMed] [Google Scholar]
- 12. Takahashi S, Matsumoto N, Okayama A, et al. FOXG1 mutations in Japanese patients with the congenital variant of Rett syndrome. Clin Genet 2012;82(6):569–573. [DOI] [PubMed] [Google Scholar]
- 13. De Bruyn C, Vanderhasselt T, Tanyalçin I, et al. Thin genu of the corpus callosum points to mutation in FOXG1 in a child with acquired microcephaly, trigonocephaly, and intellectual developmental disorder: A case report and review of literature. Eur J Paediatr Neurol 2014;18(3):420–426. [DOI] [PubMed] [Google Scholar]
- 14. McMahon KQ, Papandreou A, Ma M, et al. Familial recurrences of FOXG1‐related disorder: Evidence for mosaicism. Am J Med Genet A 2015;167(12):3096–3102. [DOI] [PMC free article] [PubMed] [Google Scholar]
- 15. Eagleson KL, Schlueter McFadyen‐Ketchum LJ, Ahrens ET, et al. Disruption of Foxg1 expression by knock‐in of cre recombinase: Effects on the development of the mouse telencephalon. Neuroscience 2007;148:385–399. [DOI] [PMC free article] [PubMed] [Google Scholar]
- 16. Brockmann K. Acquisition of Rare Neurological Disorders in Childhood (Erhebung Seltener Neurologischer Erkrankungen im Kindesalter—ESNEK). Neuropediatrics 2014;45 ‐ fp036. [Google Scholar]
- 17. Richards S, Aziz N, Bale S, et al. Standards and guidelines for the interpretation of sequence variants: A joint consensus recommendation of the American College of Medical Genetics and Genomics and the Association for Molecular Pathology. Genet Med 2015;17(5):405–424. [DOI] [PMC free article] [PubMed] [Google Scholar]
- 18. Hebert JM, McConnell SK. Targeting of cre to the Foxg1 (BF‐1) locus mediates loxP recombination in the telencephalon and other developing head structures. Dev Biol 2000;222:296–306. [DOI] [PubMed] [Google Scholar]
- 19. Narayanan R, Pirouz M, Kerimoglu C, et al. Loss of BAF (mSWI/SNF) Complexes Causes Global Transcriptional and Chromatin State Changes in Forebrain Development. Cell Rep 2015;13:1842–1854. [DOI] [PubMed] [Google Scholar]
- 20. Nguyen H, Kerimoglu C, Pirouz M, et al. Epigenetic Regulation by BAF Complexes Limits Neural Stem Cell Proliferation by Suppressing Wnt Signaling in Late Embryonic Development. Stem Cell Rep 2018;10:1734–1750. [DOI] [PMC free article] [PubMed] [Google Scholar]
- 21. Tuoc TC, Boretius S, Sansom SN, et al. Chromatin Regulation by BAF170 Controls Cerebral Cortical Size and Thickness. Dev Cell 2013;25:256–269. [DOI] [PubMed] [Google Scholar]
- 22. Narayanan R, Pham L, Kerimoglu C, et al. Chromatin Remodeling BAF155 Subunit Regulates the Genesis of Basal Progenitors in Developing Cortex. iScience 2018;4:109–126. [DOI] [PMC free article] [PubMed] [Google Scholar]
- 23. Gow A, Friedrich VL Jr, Lazzarini RA. Myelin basic protein gene contains separate enhancers for oligodendrocyte and Schwann cell expression. J Cell Biol 1992;119:605–616. [DOI] [PMC free article] [PubMed] [Google Scholar]
- 24. Calamante F, Tournier JD, Kurniawan ND, et al. Super‐resolution track‐density imaging studies of mouse brain: Comparison to histology. NeuroImage 2012;59:286–296. [DOI] [PubMed] [Google Scholar]
- 25. Zhou YX, Pannu R, Le TQ, Armstrong RC. Fibroblast growth factor 1 (FGFR1) modulation regulates repair capacity of oligodendrocyte progenitor cells following chronic demyelination. Neurobiol Dis 2012;45:196–205. [DOI] [PMC free article] [PubMed] [Google Scholar]
- 26. Lee KM, Bang JH, Han JS, et al. Cardiotonic pill attenuates white matter and hippocampal damage via inhibiting microglial activation and downregulating ERK and p38 MAPK signaling in chronic cerebral hypoperfused rat. BMC Complement Altern Med 2013;13:334. [DOI] [PMC free article] [PubMed] [Google Scholar]
- 27. Tao W, Lai E. Telencephalon‐restricted expression of BF‐1, a new member of the HNF‐3/fork head gene family, in the developing rat brain. Neuron 1992;8:957–966. [DOI] [PubMed] [Google Scholar]
- 28. Kumamoto T, Hanashima C. Evolutionary conservation and conversion of Foxg1 function in brain development. Dev Growth Differ 2017;59:258–269. [DOI] [PubMed] [Google Scholar]
- 29. Paul LK, Brown WS, Adolphs R, et al. Agenesis of the corpus callosum: Genetic, developmental and functional aspects of connectivity. Nat Rev Neurosci 2007;8:287–299. [DOI] [PubMed] [Google Scholar]
- 30. Edwards TJ, Sherr EH, Barkovich AJ, Richards LJ. Clinical, genetic and imaging findings identify new causes for corpus callosum development syndromes. Brain 2014;137:1579–1613. [DOI] [PMC free article] [PubMed] [Google Scholar]
- 31. Ten Donkelaar HJ. Clinical Neuroanatomy. Brain Circuitry and Its Disorders. Berlin, Heidelberg: Springer, 2011. [Google Scholar]
- 32. Thomas AG, Koumellis P, Dineen RA. The fornix in health and disease: An imaging review. Radiographics 2011;31:1107–1121. [DOI] [PubMed] [Google Scholar]
- 33. Takahashi T, Kinsman S, Makris N, et al. Semilobar holoprosencephaly with midline ‘seam’: A topologic and morphogenetic model based upon MRI analysis. Cereb Cortex 2003;13:1299–1312. [DOI] [PubMed] [Google Scholar]
- 34. Kumar R, Lee K, Macey PM, et al. Mammillary body and fornix injury in congenital central hypoventilation syndrome. Pediatr Res 2009;66:429–434. [DOI] [PMC free article] [PubMed] [Google Scholar]
- 35. Friede RL, Briner J. Midline hyperplasia with malformation of the fornical system. Neurology 1978;28:1302–1305. [DOI] [PubMed] [Google Scholar]
- 36. Contarino VE, Bulgheroni S, Savoiardo M, et al. Constrained spherical deconvolution‐based tractography to depict and characterize a case of “hyperplastic fornix dorsalis”. Magn Reson Imaging 2014;32:1428–1433. [DOI] [PubMed] [Google Scholar]
- 37. Sato N, Ota M, Yagishita A, et al. Aberrant midsagittal fiber tracts in patients with hemimegalencephaly. AJNR Am J Neuroradiol 2008;29:823–827. [DOI] [PMC free article] [PubMed] [Google Scholar]
- 38. Peiffer A, Singh N, Leppert M, et al. Microcephaly with simplified gyral pattern in six related children. Am J Med Genet 1999;84:137–144. [DOI] [PubMed] [Google Scholar]
- 39. Miyoshi G, Fishell G. Dynamic FoxG1 expression coordinates the integration of multipolar pyramidal neuron precursors into the cortical plate. Neuron 2012;74:1045–1058. [DOI] [PMC free article] [PubMed] [Google Scholar]
- 40. Baek ST, Copeland B, Yun EJ, et al. An AKT3‐FOXG1‐reelin network underlies defective migration in human focal malformations of cortical development. Nat Med 2015;21:1445–1454. [DOI] [PMC free article] [PubMed] [Google Scholar]
- 41. Yang Y, Shen W, Ni Y, et al. Impaired Interneuron Development after Foxg1 Disruption. Cereb Cortex 2017;27:793–808. [DOI] [PubMed] [Google Scholar]
- 42. Gertz CC, Kriegstein AR. Neuronal Migration Dynamics in the Developing Ferret Cortex. J Neurosci 2015;35:14307–14315. [DOI] [PMC free article] [PubMed] [Google Scholar]
- 43. Nowakowski TJ, Pollen AA, Sandoval‐Espinosa C, Kriegstein AR. Transformation of the Radial Glia Scaffold Demarcates Two Stages of Human Cerebral Cortex Development. Neuron 2016;91:1219–1227. [DOI] [PMC free article] [PubMed] [Google Scholar]
- 44. De Juan Romero C, Borrell V. Genetic maps and patterns of cerebral cortex folding. Curr Opin Cell Biol 2017;49:31–37. [DOI] [PubMed] [Google Scholar]
- 45. Del Toro D, Ruff T, Cederfjall E, et al. Regulation of Cerebral Cortex Folding by Controlling Neuronal Migration via FLRT Adhesion Molecules. Cell 2017;169:621–635. [DOI] [PubMed] [Google Scholar]
- 46. Shinmyo Y, Terashita Y, Dinh Duong TA, et al. Folding of the Cerebral Cortex Requires Cdk5 in Upper‐Layer Neurons in Gyrencephalic Mammals. Cell Rep 2017;20:2131–2143. [DOI] [PubMed] [Google Scholar]
- 47. Dobyns WB. Absence makes the search grow longer. Am J Hum Genet 1996;58:7–16. [PMC free article] [PubMed] [Google Scholar]
- 48. Kamnasaran D. Corpus callosum: Agenesis In: Squire LR, ed. Encyclopedia of Neuroscience. Amsterdam: Elsevier, 2009:163–173. [Google Scholar]
- 49. Friede RL. Developmental Neuropathology, 2nd ed Berlin, New York: Springer, 1989. [Google Scholar]
Associated Data
This section collects any data citations, data availability statements, or supplementary materials included in this article.
Supplementary Materials
Table S1. Quantitative histological data of various cerebral structures in Foxg1+/− mouse model vs. wildtype (WT).
Table S2. Clinical, genetic and neuroimaging features in patients with FOXG1 syndrome.