

Abstract
The plain radiographic features of gout are well known; however, the sensitivity of plain radiographs alone for the detection of signs of gout is poor in acute disease. Radiographic abnormalities do not manifest until late in the disease process, after significant joint and soft tissue damage has already occurred. The advent of dual-energy computed tomography (DECT) has enabled the non-invasive diagnosis and quantification of gout by accurately confirming the presence and extent of urate crystals in joints and soft tissues, without the need for painful and often unreliable soft tissue biopsy or joint aspiration. Specific ultrasound findings have been identified and may also be used to aid diagnosis. Both ultrasound and magnetic resonance imaging (MRI) may be used for the measurement of disease extent, monitoring of disease activity or treatment response, although MRI findings are nonspecific. In this article we summarize the imaging findings and diagnostic utility of plain radiographs, ultrasound, DECT, MRI and nuclear medicine studies in the assessment as well as the implications and utility these tools have for measuring disease burden and therapeutic response.
Keywords: crystal arthropathy, diagnostic imaging, dual-energy computed tomography, gout, magnetic resonance imaging, ultrasound
Introduction
Gout is the most common form of inflammatory arthritis and both the prevalence and incidence have significantly increased in the United Kingdom (UK) population in recent years.1–3 However, despite its high prevalence, the diagnosis is often delayed resulting in increased morbidity, as early treatment is necessary to maintain normal activity and prevent disability. Gout is a form of inflammatory arthritis characterized by hyperuricemia and the subsequent formation of monosodium urate (MSU) crystals, which precipitate episodes of acute inflammation.
Asymptomatic hyperuricemia is the first stage of the disease and is a prerequisite for the precipitation of MSU crystals in soft tissues. This condition is related to environmental factors such as diet, conditions which alter purine metabolism and genetics.4,5 This asymptomatic stage of the disease precedes episodes of sterile inflammation and pain, also known as gout attacks or gout flares where MSU may crystalize in a range of tissues from synovial fluid, synovium, tendons, bursae, cartilage and bone. These inflammatory flares are acute and intermittent and are driven by an immune mediated response to the MSU crystals which trigger a cycle of necroinflamation.6
Periods of spontaneous resolution of inflammation and symptoms known as the ‘intercritical period’ usually follow acute attacks, despite the persistence of MSU crystals in the tissues.6 Over time and if inadequately treated, recurrent acute gout flares may progress and result in chronic, persistent rheumatological symptoms secondary to articular damage or chronic synovitis.
Gouty tophi result from a second pathophysiological mechanism of immune anergy and granuloma formation allowing the concurrent development of large nodular tophi which cause soft tissue remodelling and damage.6 These tophi consist of a fibrovascular matrix containing a core of MSU crystals, lipids and cellular debris, surrounded by a cellular ‘corona’ of granulation tissue.7
The disease presents as a mono-arthritis with an acute attack involving the first metatarsophalangeal joint (MTPJ) in approximately half of cases and demonstrates a predilection for peripheral joints. However, any joint can be involved, including large joints and those within the axial skeleton. Although the presenting clinical picture may be highly suggestive, the gold standard test for the diagnosis of gout is the identification of negatively birefringent MSU crystals from joint fluid or soft tissue however, obtaining a sample may be technically difficult, painful for the patient and the accuracy of the results may be affected by multiple factors.8,9 In cases where MSU crystals have not been documented, imaging has been shown to play a key role in the diagnosis of gout, either as part of a diagnostic algorithm, incorporating clinical, laboratory and imaging findings or as a standalone test.10 Plain radiographs have historically been the initial investigation of choice in patients presenting with gout like symptoms and may be useful both for the diagnosis and monitoring of disease progression. However, more recently, new applications for more advanced imaging techniques have been developed including ultrasound, dual-energy computed tomography (DECT), magnetic resonance imaging (MRI) and positron emission tomography (PET)/computed tomography (CT) which enable the disease process to be studied in much greater detail.11
Plain radiographs
Plain radiographs are often normal at the first presentation and the sensitivity of plain radiographs for the detection of gout is only around 30%.12 In some cases, radiographic abnormalities may take up to 15 years from the onset of disease to manifest.13 If abnormal, radiographs in the acute phase usually demonstrate nonspecific soft tissue swelling or a joint effusion. As the disease progresses, radiographic abnormalities reflecting the disease process become evident with soft tissue and then osseous changes. With recurrent bouts of inflammation and synovitis, the plain radiographic appearances are that of a nondemineralizing erosive arthropathy characterized by well-defined ‘punched out’ juxta-articular or intra-articular erosions with overhanging and sclerotic margins.14,15 The lack of periarticular osteopenia is characteristic and helps to differentiate the appearances of gout from those seen in rheumatoid arthritis.16 The erosions are usually caused by intraosseous extension of a soft tissue tophus and therefore usually affect the joint margins before they extend into the centre of the joint. Joint spaces are relatively well preserved until late in the disease when other ancillary features such as intraosseous calcifications and subchondral collapse may also be seen (Figure 1).17,18
Figure 1.
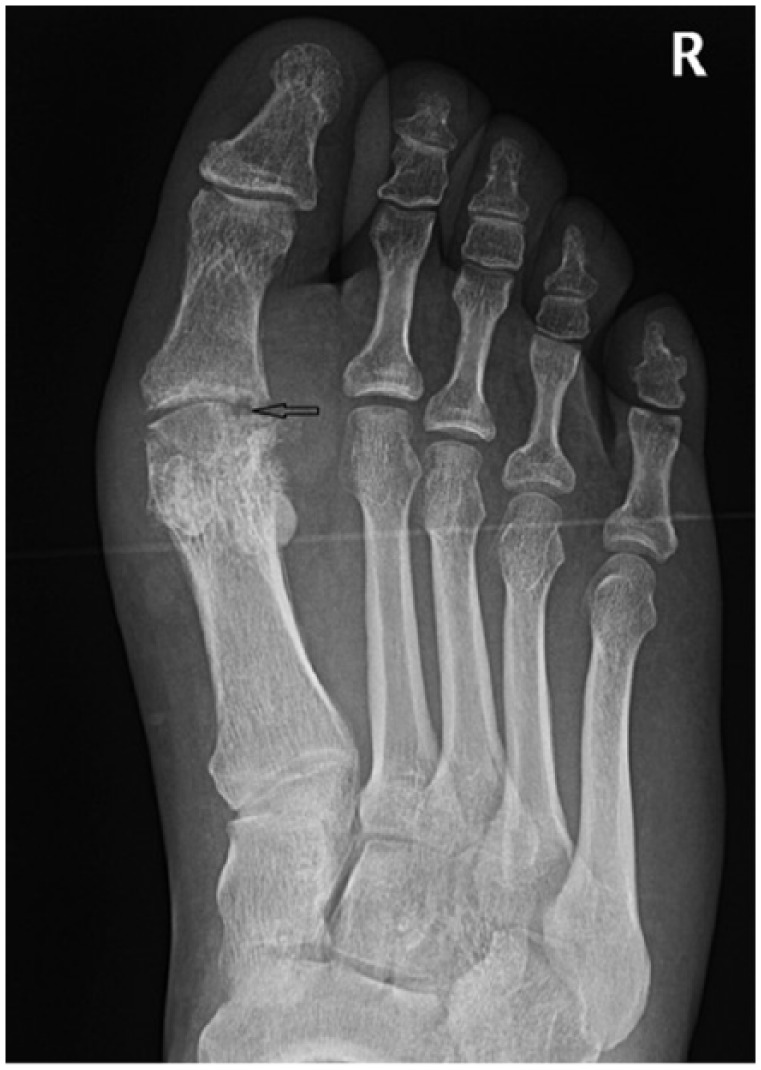
Podagra with soft tissue and intra-articular tophi. There is a well-defined ‘punched out’ erosion at the head of the first metatarsal (black arrow) with a paucity of peri-articular osteopenia.
The radiographic appearances of tophi reflect their histological composition and they appear as round or oval ill-defined mass lesions which demonstrate increased attenuation relative to normal soft tissue. They may be radiographically occult if less than 5–10 mm (Figure 2). Tophi are normally juxta-articular however may also arise within bone and result in well-defined ‘geographical’ expansile, lytic bone lesions with thin sclerotic borders, also known as pseudotumour of gout.19 Irregular periosteal reaction and chondrocalcinosis may also be seen.
Figure 2.

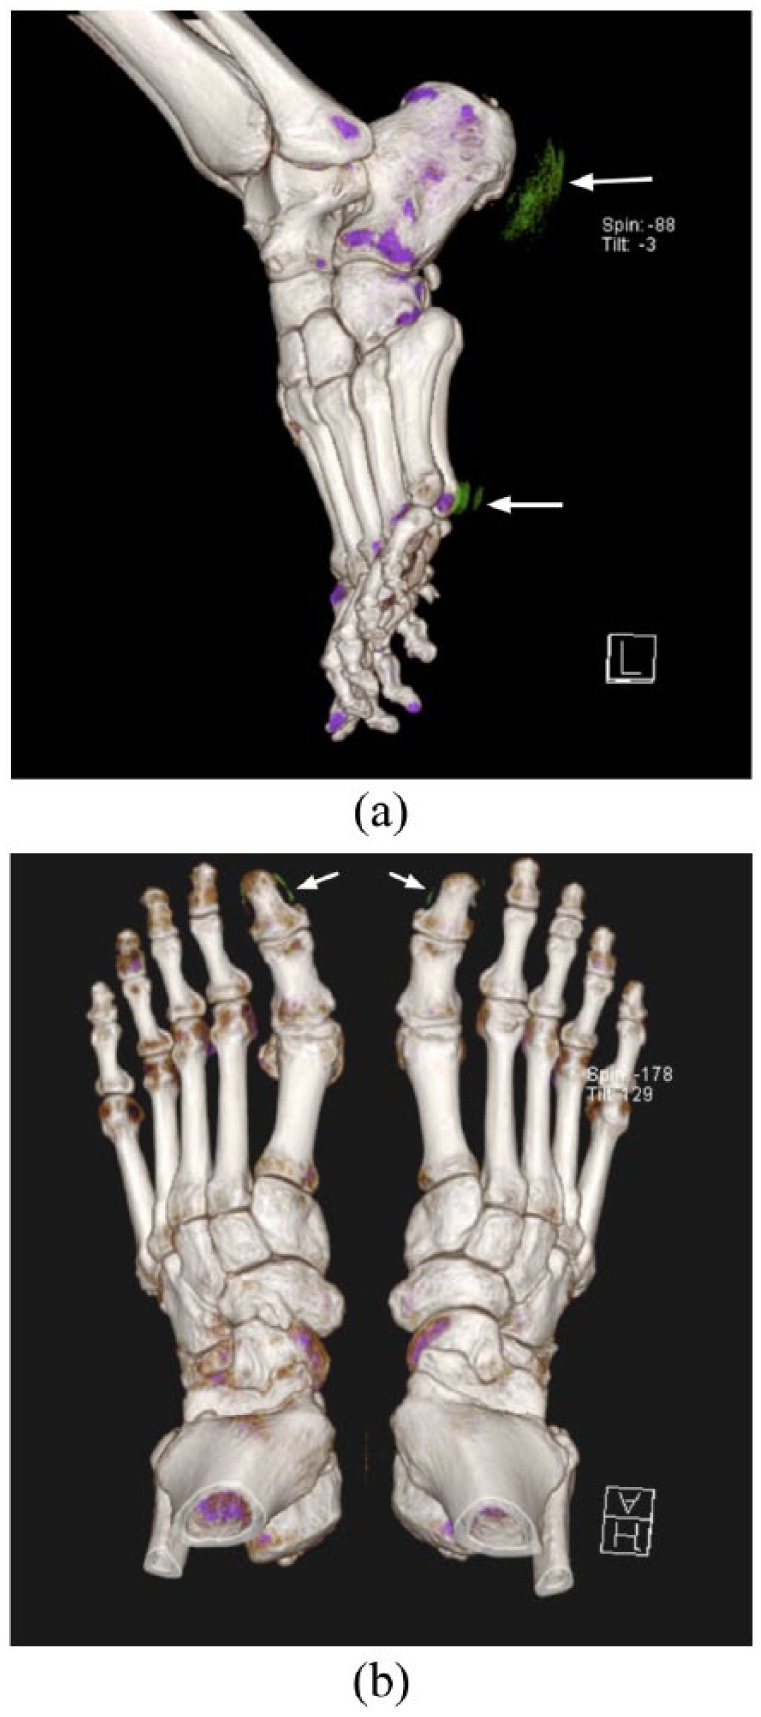
(a, b). Bilateral hand plain radiographs from the same patient demonstrating extensive high attenuation soft tissue foci representing large tophi. There is relative sparing of the joint spaces and articular surfaces with no osseous erosion or secondary degenerative articular changes. Apparent bilateral middle finger joint space narrowing is projectional.
(c). Three-dimensional DECT reconstruction demonstrating extensive urate deposition depicted by soft tissue lesions which, by convention are coloured green (white arrows). Deposits are seen within soft tissue tophus at the dorsum of both wrists, the index and little finger metacarpophalangeal joint of the right hand and the proximal interphalangeal joints of the index and middle fingers of the left hand.
(d). Axial noncontrast CT image demonstrating extensive hyper-dense soft tissue tophus overlying the distal ulna (white arrow).
CT, computed tomography; DECT, dual-energy computed tomography.
Previously developed radiological scoring systems based on radiographic findings are no longer widely used as the goal of modern imaging is to detect osseous, soft tissue and articular sequelae of gout earlier in the disease process, before plain radiographic findings manifest.20 Despite this, understanding of radiographic presentations of gout is important as the classic morphological changes seen are also seen with more advanced imaging techniques.
Advanced imaging
Ultrasound
The use of ultrasound in the assessment of rheumatologic conditions is increasing due to increasing availability, relative low cost, lack of ionizing radiation, dynamic and multiplanar imaging capability and high soft tissue resolution.21 Repeated examinations also facilitate the assessment of treatment response.22 Tophaceous deposits can be detected within soft tissues and ultrasound may be used to guide joint aspiration or soft tissue biopsy in order to identify urate crystals in the diagnosis of gout. Truly intraosseous tophi are not identifiable with ultrasound due to the inability of ultrasound to penetrate bone cortex. The use of Doppler ultrasound may also yield useful information relating to the activity of inflammation in patients with known gout.23 Ultrasound is however limited by both operator and patient factors and accuracy of the result is related to operator experience although studies have demonstrated good interobserver reliability for the detection of erosions and tophi among rheumatologists.24 Ultrasound also depends on the availability of a suitable acoustic window, which may be limited in obese patients or in joints of the axial skeleton.
The ultrasound findings in gout can be divided into generic findings associated with inflammatory arthritis and typical gouty ultrasound lesions which have been defined by the International Consensus for ultrasound lesions in gout.25 The generic features include synovitis and effusions. Synovial hypertrophy and hyperaemia are common findings but are nonspecific. The presence of microtophi within the synovium increases the specificity for gout. Hyperaemia may relate to the fibrovascular matrix of tophi or may be secondary to active inflammation. Hyperaemia may also be seen in asymptomatic hyperuricemia indicating subclinical inflammation which may reduce on serial ultrasound examinations following appropriate therapy.26
Joint effusions appear as a hypoechoic intra-articular collections which may be differentiated from synovial hypertrophy by their compressibility and lack of vascularity on Doppler assessment. Effusions may be simple and anechoic in early disease however, in more advanced disease, may contain mobile echogenic MSU crystals producing a ‘starry sky’ appearance.27 Turbulence within the joint fluid caused by gentle compression with the ultrasound probe followed by pressure release may cause crystals to swirl and produce a ‘snowstorm’ appearance.
Tophi
The three main constituents of tophi (crystal and debris core, fibrovascular matrix and peripheral granulation tissue) can be appreciated with ultrasound.28 Bright, echogenic crystals are seen centrally interspersed with hypoechoic fibrous septa which demonstrate vascularity on Doppler assessment (Figure 3). The surrounding granulation appears as a hypoechoic halo surrounding the lesion.29 Due to the heterogeneous crystal and debris core, sound waves are able to pass through the lesion enabling assessment of deeper structures. This contrasts with small, dense crystal deposits which may be completely reflective and cast a posterior acoustic shadow. Tophi have a preponderance to form in regions subject to mechanical stress such as adjacent to the entheses of the medial first MTPJ, distal Achilles tendon, proximal patella ligament and the olecranon and prepatellar bursae. Ultrasound has been shown to be highly specific (92%) and moderately sensitive (69%) for the detection of intratendinous tophi in patients with gout versus those with degenerative changes of osteoarthritis.30 Clusters of small MSU crystals which appear as heterogeneous hyperechoic foci which maintain their echogenicity at all scanning angles and even when gain is minimized, represent aggregates. These aggregates, which pathophysiologically represent clusters of microtophi, may occur within soft tissues such as tendon, joint capsule or synovium as well as within joint fluid where they appear as mobile echogenic foci.
Figure 3.
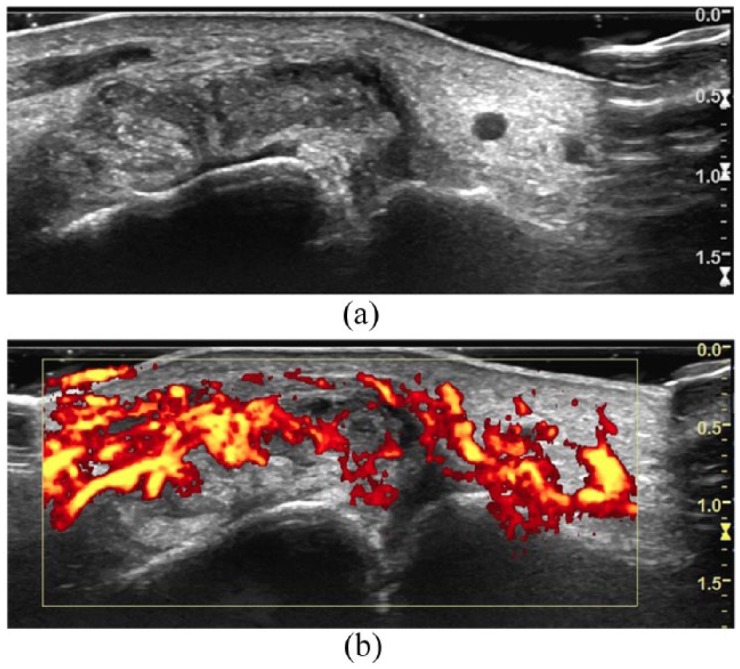
Ultrasound images of the first metatarsophalangeal joint in a patient presenting with an acute gout attack. Tophus is demonstrated by bright, echogenic crystals interspersed with hypoechoic septa (a) which demonstrate increased Doppler signal (b).
Double contour sign
Intra-articular MSU crystals may precipitate on the surface of hyaline cartilage and produce a curvilinear echogenic band which parallels the underlying subchondral bone plate, separated by a hypoechoic band of normal articular cartilage (Figure 4). The differential for these appearances includes calcific deposits which more commonly form within the cartilage, rather than on the surface and are more echogenic with no acoustic through transmission and posterior acoustic shadowing. Calcium pyrophosphate crystals may also form a true double contour sign however this is less common.31 The double contour sign has been included in the 2015 gout classification criteria by the American College of Rheumatology (ACR) and European League Against Rheumatism (EULAR) collaborative initiative and has been shown to have a high specificity although low sensitivity in studies comparing patients with gout or asymptomatic hyperuricemia with controls.32–34
Figure 4.
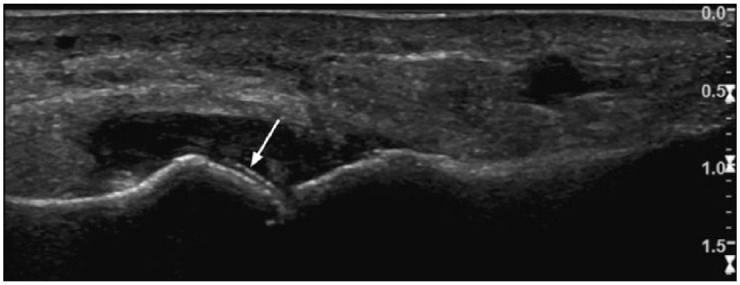
Ultrasound images of the first metatarsophalangeal joint in a patient presenting with an acute gout attack. The double contour sign is demonstrated by an echogenic line paralleling the subcortical bone plate of the head of the first metatarsal (white arrow).
Cortical bone erosions
Ultrasound appearances of erosions are defined as a cortical breech which is visible in at least two perpendicular planes. The classic gouty bone erosions, characterized by juxta-articular ‘punched out’ lesions with overhanging edges are often readily identifiable and ultrasound is also able to identify the associated soft tissue tophus which causes the erosion.
The sensitivity of ultrasound for detecting MSU deposition has been shown to be equivalent to that of DECT and evidence of crystal deposition may be seen in cases of asymptomatic hyperuricemia although ultrasound may be suboptimal in acute gout attacks.35–37
Dual-energy computed tomography
DECT is a technique which utilizes the effect of a material’s atomic number on its X-ray absorption characteristics at different energy levels. High atomic number materials such as calcium have a greater difference in attenuation when exposed to X-rays of two different energy levels. This is in contrast to materials of lower atomic number such as MSU which have a smaller difference in attenuation at different X-ray energy levels.38 By scanning tissue with X-ray beams at 80 kV and 140 kV a post-processing algorithm can be applied to the data to differentiate calcium from MSU and thus reveal sites of urate deposition. Urate deposition can be measured through the use of a region of interest and display of a histogram of the effective z value of the voxels. A characteristic peak at the effective z value of urate confirms urate deposition. Alternatively, image reconstructions can automatically display voxels containing urate, which by convention, are coloured green on two and three-dimensional images (Figure 5). In practice, this can be achieved through the use of a dual-source CT scanner to allow simultaneous acquisition of two data sets, by using a single-source CT scanner and scanning the patient twice or through the use of rapid voltage switching. The former enables faster scanning times and eradicated the potential for misregistration. Urate cannot simply be identified by its attenuation at a single X-ray energy level due to the variability in absolute Hounsfield units between different CT scanners.39 In addition, the algorithm used to identify urate from dual-energy data sets also requires fine calibration, tailored to the individual scanner, in order to minimize the rate of false positive or false negative results.40
Figure 5.

Two and three-dimensional DECT reconstructed images of the knee in a patient with gout affecting the extensor mechanism. (a). Red histogram displaying the effective z value of the material within the region of interest displayed on two-dimensional CT (black star). The characteristic urate peak (white arrow) is demonstrated indicating the presence of urate crystals in this region. A second region of interest has been placed in the quadriceps tendon (black arrow) and the associated yellow histogram reveals higher effective z values with no urate peak.
(b). Three-dimensional reconstructed images, which urate is displayed within the extensor mechanism and at the lateral joint margin.
CT, computed tomography; DECT, dual-energy computed tomography.
A recent meta-analysis involving seven studies with a relatively heterogeneous population of 413 patients including those with acute, intercritical and chronic tophaceous gout found the pooled sensitivity of DECT for the detection of gout was 84% (95% confidence interval 78–88%) and the specificity was 84% (95% confidence interval 77–89%). The heterogeneity of the sample was thought to reflect clinical practice and therefore provide a realistic representation of the diagnostic accuracy of DECT.41 The largest study within this meta-analysis included 90 patients with suspected gout, evaluated the diagnostic accuracy of DECT with a ‘composite gold standard’ test comprised of a combination of both joint aspiration or ACR clinico-radiographic criteria.42 Diagnostic accuracy of DECT was also compared with conventional radiography and noncontrast CT, which were both significantly inferior with sensitivities of 15% and 26% respectively. The sensitivity of DECT was higher when aspiration alone was the reference criteria (100% versus 82%) but specificity was lower (48% versus 97%). This reduction in specificity was due to an increase in the false positive rate, where urate was suggested on DECT in patients with a negative aspirate. This may be explained by the flawed nature of joint aspiration itself, as it is limited by sampling error and by the fact that up to 25% of cases may show an absence of crystals in acute gout.43,44 When the composite gold standard was used as a reference 44 of 54 cases were positively identified by DECT. The 10 false negative cases were in the acute or intercritical stages of the disease, when low volumes of crystalline MSU result in DECT missing some cases.35,45,46 This is not surprising as DECT requires MSU crystals to be present in concentrations of at least 12.5% in in vitro testing using CT phantom models.47 In clinical use, the threshold for detection requires tophus to be composed of at least 15% to 20% MSU by volume and for the tophus to be at least 2 mm in size for positive identification.45,47,48 This is reflected in results of other studies showing a reduction in the detection of MSU in acute and nontophaceous disease.49,50 There were 4 false positives, of which, all had ACR scores of 4 or 5 out of 12 (6/12 or more was considered positive) and 3 were treated clinically as gout, improving on urate lowering therapy.
The high sensitivity of DECT is also useful for detecting subclinical urate burden in asymptomatic patients with hyperuricemia. In a study by Dalbeth and colleagues, DECT detected MSU deposition in 24% of asymptomatic hyperuricaemic patients, although the volume of MSU was significantly lower than was seen in patients with early and late gout.51 MSU deposition in these asymptomatic hyperuricaemic patients was more often found in tendons and joints and in the absence of tophi, indicating concentration and extent of soft tissue precipitation of MSU can exceed the threshold for detection with DECT, before symptoms arise. DECT is also able to detect MSU crystals in normouricaemic patients with no palpable tophi taking long term allopurinol.52 Due to this high sensitivity and the three-dimensional nature of DECT data, this imaging modality can reliably be used to volumetrically quantify disease.53 As a result, DECT can be used for serial assessment of treatment response and has been found to outperform ultrasound in the assessment of disease burden following treatment, although ultrasound is able to better delineate nonurate, inflammatory disease components.54–56
DECT is subject to limitations and false positive results may be caused by artefacts. MSU may falsely be displayed up to 90% of investigations although is often easy to identify by its location in joints with significant osteoarthritis, on the surface of arthroplasties and in the skin and nail beds (Figure 6).57 MSU deposits have also been shown in the costal cartilages and intervertebral discs in healthy, normouricaemic middle-aged and elderly patients, but not in younger control patients, suggesting urate deposition in these locations may be physiological in older age.58
Figure 6.
(a). Artefactual urate image appearances at the skin/air interface over the heels and at the head of the 5th metatarsals bilaterally (white arrows).
(b). Artefactual urate deposition at the nail beds of the bilateral great toes (white arrows). The location of this apparent urate indicates that it is artefactual and should be distinguished from true soft tissue urate deposition.
DECT is also associated with increased radiation exposure in comparison with conventional radiography, ultrasound or MRI and may therefore become a concern if used repeatedly. However, the majority of patients with gout are middle aged or elderly and radiation doses are equivalent to those seen with conventional noncontrast CT, with a typical effective dose of less than 1 mSv.42
DECT differs from ultrasound and MRI in its quantification of gouty deposits as the latter demonstrate the noncrystalline tophus components with greater resolution.59 Despite this, DECT and ultrasound have similar sensitivities for the detection of tophus and DECT has the advantage of improved visualization of anatomical regions with poor acoustic windows, such as the popliteal fossa of the knee.60 Additionally, DECT is able to distinguish urate from other crystal arthropathies, such as Calcium Pyrophosphate Deposition Disease (CPPD).60
MRI
MRI is has become an important imaging investigation in the work up of rheumatology patients due to its superior soft tissue contrast resolution and its ability to demonstrate soft tissue inflammation, chondral damage, bone erosions, marrow oedema and deformity, without exposing the patient to ionizing radiation.61 Deeper structures can be visualized, unlike with ultrasound, and multiplanar imaging can be tailored to individual joints in order to best demonstrate pathology. With the administration of intravenous MRI contrast media and the use of post-contrast T1-weighted sequences, it is possible to differentiate active synovitis from synovial hypertrophy.41 Due to scarce MRI resources however, imaging is usually limited to symptomatic joints and thus subclinical evidence of gout in other joints may be missed.
Tophi demonstrate variable imaging appearances on MRI, reflecting their heterogeneous components and MSU crystals cannot be specifically identified (Figure 7). In a study of 40 patients with known gout, MRI had a sensitivity of 63% and a specificity of 98% for the detection of tophi when compared with DECT.62 Tophi are typically intermediate to low signal on T1-weighted sequences and highly variable in appearance on T2-weighted sequences, ranging from high signal to heterogeneously low signal, reflecting the heterogeneity of tophus composition and variation in the volume of calcium deposition.63 Fibrovascular septa within the tophus exhibit heterogeneous enhancement on post-contrast imaging.64 The typical location of a tophus, such as within the distal quadriceps tendon, may increase the suspicion of gout however further evaluation to demonstrate the presence of MSU, such as DECT or aspiration is often performed to confirm the diagnosis.
Figure 7.

Images of the knee in a patient with extensive tophus within the patella tendon. (a). Sagittal T2-weighted image with fat saturation. (b). Axial T2-weighted image with fat saturation. (c). Sagittal proton density-weighted image. (d). Sagittal noncontrast CT image. Tophus demonstrates heterogeneous signal characteristics however the location and presence of well-defined bone erosion (best seen on CT) are highly suggestive of the diagnosis of gout.
CT, computed tomography.
Bone erosions demonstrate their classic morphology with overhanging edges and are also characterized on MRI by a paucity of surrounding marrow oedema, except in the late stages of disease or in the context of concurrent osteomyelitis.65 Chondral surfaces are also relatively spared until the disease is advanced.66 These features help differentiate gout from rheumatoid arthritis, where erosions are usually accompanied by florid bone marrow oedema and articular cartilage damage.
The diagnostic performance of MRI in gout remains uncertain due to a lack of data and the relative lack of specific imaging findings and MRI findings are not included in the diagnostic criteria published by the ACR or EULAR.32 However, MRI is sensitive to the presence of the nonspecific findings of inflammation and erosions. Carter and colleagues demonstrated that in patients with known gout but normal radiographs, erosions were identified in 56% of patients with MRI but only 4% with ultrasound.67 In addition, MRI has been shown to be superior to a combination of clinical examination and plain radiographs in assessing disease extent in patients with tophaceous gout.68 As a result, and because of the lack of associated ionizing radiation, MRI is a useful tool to monitor both extent and progression of disease.69
Nuclear medicine
There are limited data demonstrating the utility of functional imaging in gout and radioisotope studies are not included in current diagnostic or imaging guidelines.32,69 Increased uptake of fluorodeoxyglucose (FDG) on PET/CT studies may be seen within tophi and in adjacent joints and soft tissues. Bone scans may show increase osteoblastic activity at sites of erosion however these findings are nonspecific and functional imaging is currently limited by the poor intrinsic image resolution.70 Rarely, these findings may add to the diagnostic picture in cases of uncertainty, particularly when tophi develop in unusual locations such as with the axial skeleton.71
Summary
The observation of MSU crystals is still required to provide an unequivocal diagnosis of gout however this is often not possible. Plain radiographs remain the initial imaging investigation of choice and the radiographic appearances of gout are well documented. Recent developments of advanced imaging techniques are enabling the disease to be diagnosed earlier, often without the need for invasive tissue sampling, thus facilitating earlier treatment. In addition, there are ongoing developments investigating the role these new imaging modalities can play in assessing disease burden and in monitoring response to therapy. This will become increasingly important as the incidence of gout continues to rise in order to minimize the morbidity and mortality associated with this chronic disease.
Footnotes
Funding: The author(s) received no financial support for the research, authorship, and/or publication of this article.
Conflict of interest statement: The author(s) declared no potential conflicts of interest with respect to the research, authorship, and/or publication of this article.
ORCID iDs: Joseph Davies  https://orcid.org/0000-0001-8700-0123
James Teh
https://orcid.org/0000-0002-6111-4269
Contributor Information
Joseph Davies, Radiology Department, Nuffield Orthopaedic Centre, Windmill Road, Oxford, OX3 7HE, UK.
Philipp Riede, Nuffield Orthopaedic Centre, Oxford, UK.
Kirsten van Langevelde, Nuffield Orthopaedic Centre, Oxford, UK.
James Teh, Nuffield Orthopaedic Centre, Oxford, UK.
References
- 1. Kuo C-F, Grainge MJ, Zhang W, et al. Global epidemiology of gout: prevalence, incidence and risk factors. Nat Rev Rheumatol 2015; 11: 649–662. [DOI] [PubMed] [Google Scholar]
- 2. Kuo C-F, Grainge MJ, Mallen C, et al. Rising burden of gout in the UK but continuing suboptimal management: a nationwide population study. Ann Rheum Dis 2015; 74: 661–667. [DOI] [PMC free article] [PubMed] [Google Scholar]
- 3. Zhu Y, Pandya BJ, Choi HK. Prevalence of gout and hyperuricemia in the US general population: The National Health and Nutrition Examination Survey 2007–2008. Arthritis Rheum 2011; 63: 3136–3141. [DOI] [PubMed] [Google Scholar]
- 4. Beyl RN, Hughes L, Morgan S. Update on importance of diet in gout. Am J Med 2016; 129: 1153–1158. [DOI] [PubMed] [Google Scholar]
- 5. Major TJ, Dalbeth N, Stahl EA, et al. An update on the genetics of hyperuricaemia and gout. Nat Rev Rheumatol 2018; 14: 341–353. [DOI] [PubMed] [Google Scholar]
- 6. Desai J, Steiger S, Anders H-J. Molecular pathophysiology of gout. Trends Mol Med 2017; 23: 756–768. [DOI] [PubMed] [Google Scholar]
- 7. Dalbeth N, Pool B, Gamble GD, et al. Cellular characterization of the gouty tophus: a quantitative analysis. Arthritis Rheum 2010; 62: 1549–1556. [DOI] [PubMed] [Google Scholar]
- 8. Segal JB, Albert D. Diagnosis of crystal-induced arthritis by synovial fluid examination for crystals: Lessons from an imperfect test. Arthritis Rheum 1999; 12: 376–380. [DOI] [PubMed] [Google Scholar]
- 9. Graf SW, Buchbinder R, Zochling J, et al. The accuracy of methods for urate crystal detection in synovial fluid and the effect of sample handling: a systematic review. Clin Rheumatol 2013; 32: 225–232. [DOI] [PubMed] [Google Scholar]
- 10. Newberry SJ, FitzGerald JD, Motala A, et al. Diagnosis of gout: a systematic review in support of an American College of Physicians clinical practice guideline. Ann Intern Med 2017; 166: 27. [DOI] [PubMed] [Google Scholar]
- 11. Omoumi P, Zufferey P, Malghem J, et al. Imaging in gout and other crystal-related arthropathies. Rheum Dis Clin North Am 2016; 42: 621–644. [DOI] [PubMed] [Google Scholar]
- 12. Rettenbacher T, Ennemoser S, Weirich H, et al. Diagnostic imaging of gout: comparison of high-resolution US versus conventional X-ray. Eur Radiol 2008; 18: 621–630. [DOI] [PubMed] [Google Scholar]
- 13. Nakayama DA, Barthelemy C, Carrera G, et al. Tophaceous gout: a clinical and radiographic assessment. Arthritis Rheum 1984; 27: 468–471. [DOI] [PubMed] [Google Scholar]
- 14. Perez-Ruiz F, Dalbeth N, Urresola A, et al. Gout. Imaging of gout: findings and utility. Arthritis Res Ther 2009; 11: 232. [DOI] [PMC free article] [PubMed] [Google Scholar]
- 15. Martel W. The overhanging margin of bone: a roentgenologic manifestation of gout. Radiology 1968; 91: 755–756. [DOI] [PubMed] [Google Scholar]
- 16. Choi MH, MacKenzie JD, Dalinka MK. Imaging features of crystal-induced arthropathy. Rheum Dis Clin North Am 2006; 32: 427–446, viii. [DOI] [PubMed] [Google Scholar]
- 17. Resnick D, Broderick TW. Intraosseous calcifications in tophaceous gout. AJR Am J Roentgenol 1981; 137: 1157–1161. [DOI] [PubMed] [Google Scholar]
- 18. Barthelemy CR, Nakayama DA, Carrera GF, et al. Gouty arthritis: a prospective radiographic evaluation of sixty patients. Skeletal Radiol 1984; 11: 1–8. [DOI] [PubMed] [Google Scholar]
- 19. Recht MP, Seragini F, Kramer J, et al. Isolated or dominant lesions of the patella in gout: a report of seven patients. Skeletal Radiol 1994; 23: 113–116. [DOI] [PubMed] [Google Scholar]
- 20. Dalbeth N, Clark B, McQueen F, et al. Validation of a radiographic damage index in chronic gout. Arthritis Rheum 2007; 57: 1067–1073. [DOI] [PubMed] [Google Scholar]
- 21. Filippucci E, Iagnocco A, Meenagh G, et al. Ultrasound imaging for the rheumatologist. Clin Exp Rheumatol 2016; 24: 1–5. [PubMed] [Google Scholar]
- 22. Thiele RG, Schlesinger N. Ultrasonography shows disappearance of monosodium urate crystal deposition on hyaline cartilage after sustained normouricemia is achieved. Rheumatol Int 2010; 30: 495–503. [DOI] [PubMed] [Google Scholar]
- 23. Plagou A, Teh J, Grainger A, et al. Recommendations of the ESSR arthritis subcommittee on ultrasonography in inflammatory joint disease. Semin Musculoskelet Radiol 2016; 20: 496–506. [DOI] [PubMed] [Google Scholar]
- 24. Terslev L, Gutierrez M, Christensen R, et al. Assessing elementary lesions in gout by ultrasound: results of an OMERACT patient-based agreement and reliability exercise. J Rheumatol 2015; 42: 2149–2154. [DOI] [PubMed] [Google Scholar]
- 25. Gutierrez M, Schmidt WA, Thiele RG, et al. International consensus for ultrasound lesions in gout: results of Delphi process and web-reliability exercise. Rheumatology 2015; 54: 1797–1805. [DOI] [PubMed] [Google Scholar]
- 26. Grassi W, Okano T, Filippucci E. Use of ultrasound for diagnosis and monitoring of outcomes in crystal arthropathies. Curr Opin Rheumatol 2015; 27: 147–155. [DOI] [PubMed] [Google Scholar]
- 27. Wakefield RJ, Balint P V, Szkudlarek M, et al. Musculoskeletal ultrasound including definitions for ultrasonographic pathology. J Rheumatol 2005; 32: 2485–2487. [PubMed] [Google Scholar]
- 28. Thiele RG. Role of ultrasound and other advanced imaging in the diagnosis and management of gout. Curr Rheumatol Rep 2011; 13: 146–153. [DOI] [PubMed] [Google Scholar]
- 29. Araujo EG, Manger B, Perez-Ruiz F, et al. Imaging of gout: new tools and biomarkers? Best Pract Res Clin Rheumatol 2016; 30: 638–652. [DOI] [PubMed] [Google Scholar]
- 30. Ventura-Ríos L, Sánchez-Bringas G, Pineda C, et al. Tendon involvement in patients with gout: an ultrasound study of prevalence. Clin Rheumatol 2016; 35: 2039–2044. [DOI] [PubMed] [Google Scholar]
- 31. Löffler C, Sattler H, Peters L, et al. Distinguishing gouty arthritis from calcium pyrophosphate disease and other arthritides. J Rheumatol 2015; 42: 513–520. [DOI] [PubMed] [Google Scholar]
- 32. Neogi T, Jansen TLTA, Dalbeth N, et al. 2015 Gout classification criteria: an American College of Rheumatology/European League against Rheumatism collaborative initiative. Arthritis Rheumatol 2015; 67: 2557–2568. [DOI] [PMC free article] [PubMed] [Google Scholar]
- 33. Filippucci E, Gutierrez M, Georgescu D, et al. Hyaline cartilage involvement in patients with gout and calcium pyrophosphate deposition disease. An ultrasound study. Osteoarthr Cartil 2009; 17: 178–181. [DOI] [PubMed] [Google Scholar]
- 34. De Miguel E, Puig JG, Castillo C, et al. Diagnosis of gout in patients with asymptomatic hyperuricaemia: a pilot ultrasound study: Table 1. Ann Rheum Dis 2012; 71: 157–158. [DOI] [PubMed] [Google Scholar]
- 35. Huppertz A, Hermann K-GA, Diekhoff T, et al. Systemic staging for urate crystal deposits with dual-energy CT and ultrasound in patients with suspected gout. Rheumatol Int 2014; 34: 763–771. [DOI] [PubMed] [Google Scholar]
- 36. Puig JG, de Miguel E, Castillo MC, et al. Asymptomatic hyperuricemia: impact of ultrasonography. Nucleosides Nucleotides Nucleic Acids 2008; 27: 592–595. [DOI] [PubMed] [Google Scholar]
- 37. Dalbeth N, Schauer C, Macdonald P, et al. Methods of tophus assessment in clinical trials of chronic gout: a systematic literature review and pictorial reference guide. Ann Rheum Dis 2011; 70: 597–604. [DOI] [PubMed] [Google Scholar]
- 38. Johnson TRC, Krauß B, Sedlmair M, et al. Material differentiation by dual energy CT: initial experience. Eur Radiol 2007; 17: 1510–1517. [DOI] [PubMed] [Google Scholar]
- 39. Levi C, Gray JE, McCullough EC, et al. The unreliability of CT numbers as absolute values. AJR Am J Roentgenol 1982; 139: 443–447. [DOI] [PubMed] [Google Scholar]
- 40. McQueen FMF, Doyle AJ, Reeves Q, et al. DECT urate deposits: now you see them, now you don’t. Ann Rheum Dis 2013; 72: 458–459. [DOI] [PubMed] [Google Scholar]
- 41. Buckens CF, Terra MP, Maas M. Computed tomography and MR imaging in crystalline-induced arthropathies. Radiol Clin North Am 2017; 55: 1023–1034. [DOI] [PubMed] [Google Scholar]
- 42. Ahmad Z, Gupta AK, Sharma R, et al. Dual energy computed tomography: a novel technique for diagnosis of gout. Int J Rheum Dis 2016; 19: 887–896. [DOI] [PubMed] [Google Scholar]
- 43. Hoskison TK, Wortmann RL. Advances in the management of gout and hyperuricaemia. Scand J Rheumatol 2006; 35: 251–260. [DOI] [PubMed] [Google Scholar]
- 44. Swan A, Amer H, Dieppe P. The value of synovial fluid assays in the diagnosis of joint disease: a literature survey. Ann Rheum Dis 2002; 61: 493–498. [DOI] [PMC free article] [PubMed] [Google Scholar]
- 45. Bongartz T, Glazebrook KN, Kavros SJ, et al. Dual-energy CT for the diagnosis of gout: an accuracy and diagnostic yield study. Ann Rheum Dis 2015; 74: 1072–1077. [DOI] [PMC free article] [PubMed] [Google Scholar]
- 46. Glazebrook KN, Kakar S, Ida CM, et al. False-negative dual-energy computed tomography in a patient with acute Gout. J Clin Rheumatol 2012; 18: 138–141. [DOI] [PubMed] [Google Scholar]
- 47. Diekhoff T, Kiefer T, Stroux A, et al. Detection and characterization of crystal suspensions using single-source dual-energy computed tomography. Invest Radiol 2015; 50: 255–260. [DOI] [PubMed] [Google Scholar]
- 48. Melzer R, Pauli C, Treumann T, et al. Gout tophus detection—A comparison of dual-energy CT (DECT) and histology. Semin Arthritis Rheum 2014; 43: 662–665. [DOI] [PubMed] [Google Scholar]
- 49. Manger B, Lell M, Wacker J, et al. Detection of periarticular urate deposits with dual energy CT in patients with acute gouty arthritis. Ann Rheum Dis 2012; 71: 470–472. [DOI] [PubMed] [Google Scholar]
- 50. Baer AN, Kurano T, Thakur UJ, et al. Dual-energy computed tomography has limited sensitivity for non-tophaceous gout: a comparison study with tophaceous gout. BMC Musculoskelet Disord 2016; 17: 91. [DOI] [PMC free article] [PubMed] [Google Scholar]
- 51. Dalbeth N, House ME, Aati O, et al. Urate crystal deposition in asymptomatic hyperuricaemia and symptomatic gout: a dual energy CT study. Ann Rheum Dis 2015; 74: 908–911. [DOI] [PubMed] [Google Scholar]
- 52. Dalbeth N, Nicolaou S, Baumgartner S, et al. Presence of monosodium urate crystal deposition by dual-energy CT in patients with gout treated with allopurinol. Ann Rheum Dis 2018; 77: 364–370. [DOI] [PMC free article] [PubMed] [Google Scholar]
- 53. Choi HK, Al-Arfaj AM, Eftekhari A, et al. Dual-energy computed tomography in tophaceous gout. Ann Rheum Dis 2009; 68: 1609–1612. [DOI] [PubMed] [Google Scholar]
- 54. Shi D, Xu J-X, Wu H-X, et al. Methods of assessment of tophus and bone erosions in gout using dual-energy CT: reproducibility analysis. Clin Rheumatol 2015; 34: 755–765. [DOI] [PubMed] [Google Scholar]
- 55. Rajan A, Aati O, Kalluru R, et al. Lack of change in urate deposition by dual-energy computed tomography among clinically stable patients with long-standing tophaceous gout: a prospective longitudinal study. Arthritis Res Ther 2013; 15: R160. [DOI] [PMC free article] [PubMed] [Google Scholar]
- 56. Modjinou DV., Krasnokutsky S, Gyftopoulos S, et al. Comparison of dual-energy CT, ultrasound and surface measurement for assessing tophus dissolution during rapid urate debulking. Clin Rheumatol 2017; 36: 2101–2107. [DOI] [PubMed] [Google Scholar]
- 57. Mallinson PI, Coupal T, Reisinger C, et al. Artifacts in dual-energy CT Gout protocol: a review of 50 suspected cases with an artifact identification guide. Am J Roentgenol 2014; 203: W103–W109. [DOI] [PubMed] [Google Scholar]
- 58. Carr A, Doyle AJ, Dalbeth N, et al. Dual-energy CT of urate deposits in costal cartilage and intervertebral disks of patients with tophaceous gout and age-matched controls. Am J Roentgenol 2016; 206: 1063–1067. [DOI] [PubMed] [Google Scholar]
- 59. Perez-Ruiz F, Naredo E. Imaging modalities and monitoring measures of gout. Curr Opin Rheumatol 2007; 19: 128–133. [DOI] [PubMed] [Google Scholar]
- 60. Gruber M, Bodner G, Rath E, et al. Dual-energy computed tomography compared with ultrasound in the diagnosis of gout. Rheumatology 2014; 53: 173–179. [DOI] [PubMed] [Google Scholar]
- 61. Cimmino MA, Zampogna G, Parodi M, et al. MRI synovitis and bone lesions are common in acute gouty arthritis of the wrist even during the first attack. Ann Rheum Dis 2011; 70: 2238–2239. [DOI] [PubMed] [Google Scholar]
- 62. McQueen FM, Doyle A, Reeves Q, et al. Bone erosions in patients with chronic gouty arthropathy are associated with tophi but not bone oedema or synovitis: new insights from a 3 T MRI study. Rheumatology 2014; 53: 95–103. [DOI] [PubMed] [Google Scholar]
- 63. Yu JS, Chung C, Recht M, Dailiana T, Jurdi R. MR imaging of tophaceous gout. AJR Am J Roentgenol 1997; 168: 523–527. [DOI] [PubMed] [Google Scholar]
- 64. Chen CKH, Yeh LR, Pan H-B, et al. Intra-articular gouty tophi of the knee: CT and MR imaging in 12 patients. Skeletal Radiol 1999; 28: 75–80. [DOI] [PubMed] [Google Scholar]
- 65. Poh YJ, Dalbeth N, Doyle A, et al. Magnetic resonance imaging bone edema is not a major feature of gout unless there is concomitant osteomyelitis: 10-year findings from a high-prevalence population. J Rheumatol 2011; 38: 2475–2481. [DOI] [PubMed] [Google Scholar]
- 66. Popovich I, Dalbeth N, Doyle A, et al. Exploring cartilage damage in gout using 3-T MRI: distribution and associations with joint inflammation and tophus deposition. Skeletal Radiol 2014; 43: 917–924. [DOI] [PubMed] [Google Scholar]
- 67. Carter JD, Kedar RP, Anderson SR, et al. An analysis of MRI and ultrasound imaging in patients with gout who have normal plain radiographs. Rheumatology 2009; 48: 1442–1446. [DOI] [PubMed] [Google Scholar]
- 68. Popp JD, Dean Bidgood W, Lawrence Edwards N. Magnetic resonance imaging of tophaceous gout in the hands and wrists. Semin Arthritis Rheum 1996; 25: 282–289. [DOI] [PubMed] [Google Scholar]
- 69. Grainger R, Dalbeth N, Keen H, et al. Imaging as an outcome measure in gout studies: report from the OMERACT Gout Working Group. J Rheumatol 2015; 42: 2460–2464. [DOI] [PMC free article] [PubMed] [Google Scholar]
- 70. Ito K, Minamimoto R, Morooka M, et al. A case of gouty arthritis to tophi on 18F-FDG PET/CT imaging. Clin Nucl Med 2012; 37: 614–617. [DOI] [PubMed] [Google Scholar]
- 71. Chowalloor PV, Siew TK, Keen HI. Imaging in gout: A review of the recent developments. Ther Adv Musculoskelet Dis 2014; 6: 131–143. [DOI] [PMC free article] [PubMed] [Google Scholar]