

Summary
Objective
The purpose of this study was to compare body composition measurements estimated by multi‐frequency bioelectrical impedance analysis (MF‐BIA) with air displacement plethysmography (ADP) in individuals with obesity.
Methods
Bariatric patients were recruited from Geisinger's Center for Nutrition and Weight Management Clinic in Danville, Pennsylvania. Sixty‐two participants (age = 52.4 ± 9.3 years; body mass index = 38.9 ± 8.0 kg m−2) reported for a same‐day testing visit. Body composition was measured using a common MF‐BIA analyzer (InBody 720, Biospace Co., Beverly Hills, CA) and ADP.
Results
Strong relationships were observed between MF‐BIA and ADP methods (r = 0.88–0.96, P < 0.001). There were no differences between MF‐BIA and ADP measures of per cent body fat, fat mass or fat‐free mass for the total sample or when examined by gender.
Conclusions
The InBody 720 MF‐BIA analyzer produced body composition measurements that were similar to ADP supporting the use of this technology in the obese population.
Keywords: Bioelectrical impedance analysis (BIA), body composition, obesity
Introduction
Body composition assessment is an important tool for identifying and assessing the health status of an individual 1. Conducting body composition assessments on obese and extremely obese individuals can be challenging because of altered or varying body hydration, fat‐free mass (FFM) composition and limitations based on physical size 2. To track weight loss change, various body composition methods are used in this population 1, 2, 3. Methods such as waist circumference measurements, dual‐energy X‐ray absorptiometry (DXA), air displacement plethysmography (ADP) and bioelectrical impedance analysis (BIA) are all used to measure body composition.
While there are multiple ways to measure body composition, not all methods are practical for the obese population or a bariatric clinical setting. Although DXA has been shown to provide accurate measurements in normal weight adults 4, limitations have been identified in other populations 5, 6, 7. For instance, DXA has been shown to significantly underestimate FFM and overestimate fat mass (FM) in the elderly and those with obesity 6, 7. In terms of practicality, DXA is not the most applicable method of assessment because of a high cost and need of a trained technician to conduct the test. ADP, a two‐component body densitometry method similar to underwater weighing, uses air rather than water displacement to determine body volume. Because ADP has been found to provide similar body composition measurements as underwater weighing 8, 9, it has been recognized as a valid method of assessment. ADP is fast and easy to operate and comes with preprogrammed multiple population‐specific body composition equations.
Bioelectrical impedance analysis is a rapid, portable and non‐invasive method of assessment that is less expensive than traditional laboratory methods (e.g. DXA and ADP). BIA devices do not require a high degree of technical skill to operate, leading to increasing popularity in variety of areas including nutrition, wellness and clinical settings 10, 11, 12, 13. The development of the contact electrode system has increased the ease of use compared with the traditional method of applying electrodes at designated anatomical landmarks. During the assessment, BIA analyzers introduce a small electrical current into the body and measure the resistance, or impedance, to current flow 14. FFM is composed of a high electrolyte and water content, which produces high conductivity, making it an excellent conductor of electrical current. Conversely, FM contains low electrolyte and water content, creating a higher impedance resulting in a low conduction of electrical current 14. Preprogrammed equations estimate per cent body fat (%BF) and provide estimations of FM and FFM during the assessment 14. Multi‐frequency bioelectrical impedance analysis (MF‐BIA) technology utilizes different electrical frequencies (1 to 1,000 kHz), to estimate extracellular water, intracellular water, total body water and FFM 15. MF‐BIA technology may be beneficial to weight loss clinics because of the ease of use, relatively short measurement time and maximum scale weighing properties 10.
Although previous investigations have reported significant correlations between MF‐BIA and ADP for the assessment of body composition in relatively healthy individuals 11, 16, an examination of this technology has not been conducted in the obese population. Therefore, the purpose of this study was to compare body composition measurements estimated by MF‐BIA with ADP, the reference method of assessment, in individuals with obesity.
Methods
Participants
Bariatric patients were recruited from Geisinger's Center for Nutrition and Weight Management Clinic in Danville, Pennsylvania. Prior to testing, each participant reviewed and signed an informed consent. The study was approved by the Geisinger Medical Center Institutional Review Board.
Study protocol for body composition
Each participant reported to the Metabolic Laboratory located in the Geisinger's Center for Nutrition and Weight Management Clinic for 1 d of testing. Height (cm) and weight (kg) were measured using a wall‐mounted stadiometer (Seca North America, Chino, CA) and digital scale (Tanita Corporation of America, Inc., Arlington Heights, IL).
Pretesting guidelines
All participants adhered to the following manufacturer‐recommended pretesting guidelines; (a) no physical exercise within 12 h of the scheduled test, (b) no eating or drinking within 2 h of the test, (c) empty bladder within 30 min of the test, (d) no alcohol consumption within 48 h of the test and (e) no diuretic medications within 7 d of the test.
Multi‐frequency bioelectrical impedance analysis
Multi‐frequency bioelectrical impedance analysis measurements were conducted using the InBody 720 (Biospace Co., Beverly Hills, CA). Participants wore shorts and a T‐shirt and wiped both hands and feet with an antibacterial electrode wipe for conduction as part of MF‐BIA pretesting guidelines. In ordinance with the manufacturer's recommendations, participants stood erect on the device with both arms extended and abducted from the trunk. The InBody 720 measured impedance at varying frequencies (1, 5, 50, 250, 500 and 1,000 kHz) across the legs, arms and trunk. All four extremities were in contact with the electrodes, and the participant stood with bare feet on the device until completion of test. Measurements of total body water, %BF, FM, FFM and lean body mass were obtained.
Air displacement plethysmography
Air displacement plethysmography measurements were conducted using the BodPod® (Life Measurement Instruments, Concord, CA). Participants changed into form‐fitting compression clothing and a Lycra(R) swim cap (TYR Sport, Inc., Huntington Beach, CA) per pretesting guidelines for assessment. Prior to each test, the BodPod was calibrated following the manufacturer's instructions using a cylinder of a known volume. After entering the chamber, the participant was instructed to breathe normally for two measurements of body volume, which lasted approximately 45 s each. If a difference of 150 mL or greater was produced by the two body volumes, a third measurement was performed. Thoracic gas volume was measured from standard plethysmographic technique in 21 and predicted using preprogrammed equations in 41 participants. McCrory et al. found no statistically significant difference between measured and predicted thoracic gas volumes 17. Following test completion, the computer automatically calculated %BF with the determined body density from the Brozek equation: % Fat = (4.57∕D b − 4.142) * 100 18. The Brozek equation was selected because the Siri equation has been shown to overestimate %BF by 2–4% in obese individuals 14 and produce relatively higher %BF estimates than the Brozek equation in individuals with over 30% of BF 19.
Statistical analyses
All data values are reported as mean ± standard deviation. Data were analysed using SigmaPlot 13 for Windows (Systat Software Inc., San Jose, CA). Paired sample t‐tests were used to compare mean %BF, FFM and FM between methods. The significance level was set a priori at P ≤ 0.05. Relationships between both assessment methods were examined for %BF, FFM and FM. Pearson correlations were calculated to determine the agreement between the two body composition devices. Bland–Altman plots were used to assess intra‐individual differences for %BF, FFM and FM.
Results
Participant characteristics of the 62 adults (37 women and 25 men) that participated in this investigation are presented in Table 1. All participants were classified as obese with an average body mass index (BMI) of 38.9 ± 8.0 kg m−2.
Table 1.
Participant characteristics
| Participants | Age (years) | Height (cm) | Body mass (kg) | BMI (kg m−2) |
|---|---|---|---|---|
| Total (n = 62) | 52.4 ± 9.3 | 164.9 ± 9.2 | 111.6 ± 24.0 | 38.9 ± 8.0 |
| Women (n = 37) | 50.7 ± 10.2 | 163.3 ± 5.2 | 109.1 ± 23.0 | 40.9 ± 8.5 |
| Men (n = 28) | 55.0 ± 7.0 | 179.1 ± 5.8 | 114.3 ± 24.3 | 35.4 ± 6.1 |
All values are mean ± standard deviation.
BMI, body mass index.
Table 2 presents the %BF data (means ± standard deviation) and the relationship between MF‐BIA and ADP for all participants and separately as a function of gender. No differences were observed in %BF for the total sample or when examined by gender (Table 2). Strong relationships were also observed between methods (r = 0.88–0.96, P < 0.001), and standard error of estimate (SEE) values were rated according to Lohman 20 as ‘very good’ (range = 2.6–2.8%; Table 2). A Bland–Altman plot of the individual agreement in %BF between ADP and MF‐BIA is depicted in Figure 1. No systematic bias was observed for the total sample. Seventy‐two per cent of men and 84% of women were within the ±3.5% minimally acceptable standard for accuracy (Figure 1).
Table 2.
Comparison of per cent body fat between MF‐BIA and ADP
| Participant and method | Body fat (%) | r | MD (%) | SEE (%) | Subjective SEE rating |
|---|---|---|---|---|---|
| Total (n = 62) | |||||
| ADP | 43.3 ± 9.1 | ||||
| MF‐BIA | 43.4 ± 9.7 | 0.96* | −0.1 ± 2.8 | 2.6 | Very good |
| Women (n = 37) | |||||
| ADP | 48.6 ± 5.4 | ||||
| MF‐BIA | 49.2 ± 5.0 | 0.88* | −0.6 ± 2.6 | 2.6 | Very good |
| Men (n = 25) | |||||
| ADP | 35.9 ± 7.6 | ||||
| MF‐BIA | 34.8 ± 8.4 | 0.93* | 0.7 ± 3.0 | 2.8 | Very good |
All values are mean ± standard deviation.
ADP, air displacement plethysmography; MD, mean difference; MF‐BIA: multi‐frequency bioelectrical impedance analysis; SEE, standard error of estimate.
Significant at P < 0.001.
Figure 1.
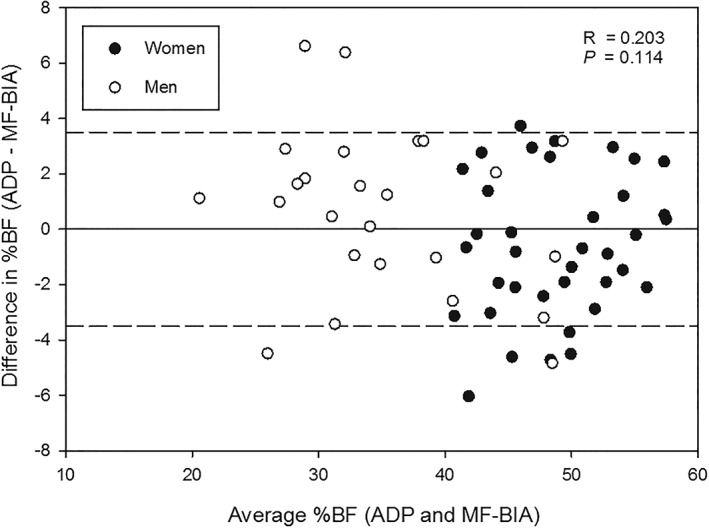
Bland–Altman plot exploring for individual differences in percent body fat (%BF) estimated by air displacement plethysmography (ADP) and multi‐frequency bioelectrical impedance analysis (MF‐BIA). The difference between the two methods is plotted against the average %BF by the two methods in the women (•) and men (◦). The solid line represents no difference between methods, and the dashed lines represent the minimal acceptable standard for prediction errors set at ±3.5%.
The relationship for FM between MF‐BIA and ADP in all participants and separately as a function of gender is presented in Table 3. No differences were observed in FM for the total sample or when examined relative to gender (Table 3). Strong relationships were observed between MF‐BIA and ADP (r = 0.99, P < 0.001), and SEE ranged from 2.8 to 3.2 kg (Table 3). A Bland–Altman plot for individual agreement in FM between ADP and MF‐BIA measurements is depicted in Figure 2. No systematic bias was observed in this sample (Figure 2).
Table 3.
Comparison of FM between MF‐BIA and ADP
| Participant and method | FM (kg) | r | MD (kg) | SEE (kg) |
|---|---|---|---|---|
| Total (n = 62) | ||||
| ADP | 49.2 ± 18.1 | |||
| MF‐BIA | 49.5 ± 18.9 | 0.99* | −0.3 ± 3.2 | 3.0 |
| Women (n = 37) | ||||
| ADP | 53.9 ± 16.8 | |||
| MF‐BIA | 54.7 ± 16.6 | 0.99* | −0.8 ± 2.8 | 2.8 |
| Men (n = 25) | ||||
| ADP | 42.3 ± 18.1 | |||
| MF‐BIA | 41.9 ± 19.7 | 0.99* | 0.4 ± 3.7 | 3.2 |
All values are mean ± standard deviation.
ADP, air displacement plethysmography; FM, fat mass; MD, mean difference; MF‐BIA: multi‐frequency bioelectrical impedance analysis; SEE, standard error of estimate.
Significant at P < 0.001.
Figure 2.
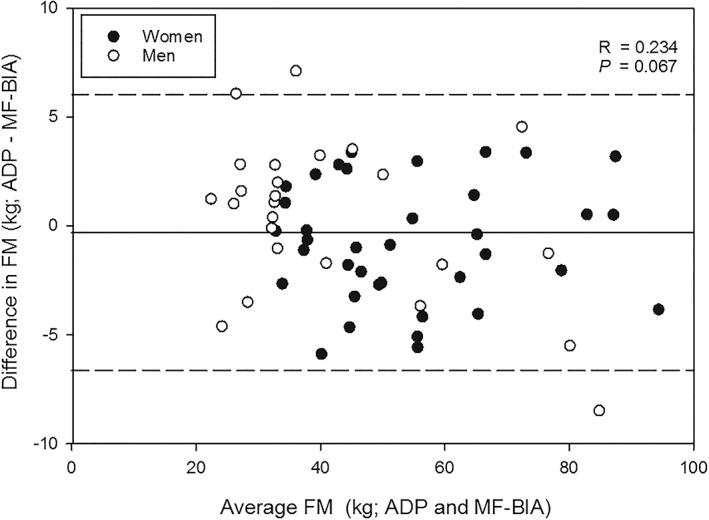
Bland–Altman plot exploring for individual differences in fat mass (FM) estimated by air displacement plethysmography (ADP) and multi‐frequency bioelectrical impedance analysis (MF‐BIA). The difference between the two methods is plotted against the average FM by the two methods in the women (•) and men (◦). The solid line represents the mean difference between methods for the total sample, and the dashed lines represent ±2 standard deviations from the mean.
Table 4 presents FFM between both devices. No differences were observed in FFM for the total sample or when examined relative to gender when MF‐BIA was compared with ADP (Table 4). Strong relationships were observed between MF‐BIA and ADP (r = 0.93–0.97, P < 0.001), and SEE values were rated according to Lohman 20 as ‘good’ (range = 2.9–3.5 kg) (Table 4). A Bland–Altman plot for individual agreement in FFM between ADP and MF‐BIA measurements can be seen in Figure 3. No systematic bias was observed in this sample.
Table 4.
Comparison of FFM between MF‐BIA and ADP
| Participant and method | FFM (kg) | r | MD (%) | SEE (%) | Subjective SEE rating |
|---|---|---|---|---|---|
| Total (n = 62) | |||||
| ADP | 62.3 ± 12.4 | ||||
| MF‐BIA | 62.3 ± 12.2 | 0.97* | 0.02 ± 3.2 | 3.2 | N/A |
| Women (n = 37) | |||||
| ADP | 55.1 ± 7.6 | ||||
| MF‐BIA | 54.6 ± 7.2 | 0.93* | 0.5 ± 2.8 | 2.9 | Good |
| Men (n = 25) | |||||
| ADP | 72.9 ± 10.2 | ||||
| MF‐BIA | 73.7 ± 8.6 | 0.94* | −0.7 ± 3.6 | 3.5 | Good |
All values are mean ± standard deviation.
ADP, air displacement plethysmography; FFM, fat‐free mass; MD, mean difference; MF‐BIA: multi‐frequency bioelectrical impedance analysis; N/A, not applicable; SEE, standard error of estimate.
Significant at P < 0.001.
Figure 3.
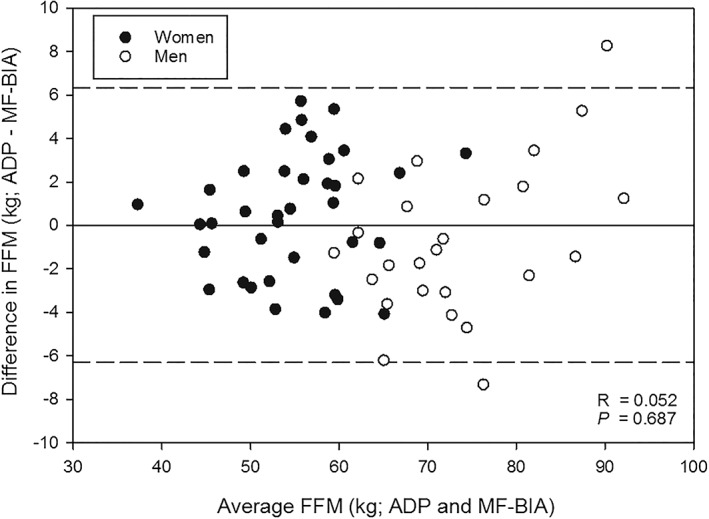
Bland–Altman plot exploring for individual differences in fat‐free mass (FFM) estimated by air displacement plethysmography (ADP) and multi‐frequency bioelectrical impedance analysis (MF‐BIA). The difference between the two methods is plotted against the average FFM by the two methods in the women (•) and men (◦). The solid line represents the mean difference between methods for the total sample, and the dashed lines represent ±2 standard deviations from the mean.
Discussion
The primary purpose of this study was to compare MF‐BIA (InBody 720) with ADP (BodPod) in obese patients. No significant differences were found for %BF, FM and FFM between the two body composition devices in this population.
Previous research exploring the validity of MF‐BIA has reported a consistent underestimation when comparing this technology with ADP and DXA. Hurst and colleagues found that MF‐BIA significantly underestimated %BF (≈2%) when compared with ADP in participants with an average BMI of 25.5 kg m−2 16. Faria and colleagues found that MF‐BIA (InBody 720) underestimated %BF (≈1.6%) when compared with DXA in an obese population (BMI of 40.2 kg m−2) 1. In another comparison study of MF‐BIA with DXA in overweight participants, Sun and colleagues compared devices for 591 participants with an average BMI of 26.3 kg m−2, which produced a ≈1.8% underestimation in %BF 21. To our knowledge, a comparison of MF‐BIA and ADP body composition values has not been conducted in a homogeneous obese population (BMI > 30.0 kg m−2). In the current investigation, we found no difference in %BF when MF‐BIA was compared with ADP. In addition, there were significant correlations and low SEE values. In this obese population, the InBody 720 produced %BF estimations similar to ADP.
Previously, Pateyjohns and colleagues reported that MF‐BIA (ImpediMed SFB7 version 6; ImpediMed, Ltd., Eight Mile Plains, Queensland, Australia) underestimated FM (≈6.6 kg) and overestimated FFM (≈8.0 kg) when compared with DXA in 43 overweight and obese men 22. Similarly, Benton and colleagues found that MF‐BIA (Bodystat Quadscan 400, Body Stat Ltd., Isle of Man, British Isles) underestimated FM (≈1.6 kg) and overestimated FFM (≈1.8 kg) when compared with ADP in women with a BMI of 25.7 ± 0.8 kg m−2 11. The current investigation found no differences between MF‐BIA and ADP FM or FFM body composition values. Studies by Benton et al. and Hurst et al. examining MF‐BIA have classified their participants according to BMI standards. However, in contrast to the current study, previous participants had an average BMI of approximately 25.5–25.7 kg m−2 considered to be average or underweight 11, 16. Patients in the present investigation were only included if they met the obese criteria of a BMI of ≥30.0 kg m−2.
Direction comparisons of our findings with previous research are difficult because of the different types of MF‐BIA devices used and varying participant characteristics. Each MF‐BIA analyzer uses different preprogrammed prediction equations to produce body composition estimates. None of the previous studies mentioned used the same MF‐BIA analyzer (InBody 720) or a strict obese population for their sample.
Laboratory methods of body composition assessment such as DXA or ADP are not always practical in obese populations or bariatric clinical settings. DXA, which is considered to be a reliable and valid device, has been used as a criterion measure in some studies with adults with average body composition values. However, in order to accommodate larger individuals with the standard DXA exam table, testing must be performed in segments or mirrored, which may cause discomfort for patients. ADP assessment using the BodPod can also be uncomfortable for larger individuals because pretesting guidelines require tight, spandex clothing for accurate results as well as sitting in the confined chamber of the pod. Both the DXA and the BodPod require a skilled technician and are costly and space inefficient. Therefore, in terms of practicality for factors such as time and cost, as well as comfortability of the patients, these two devices are often considered impractical in clinical settings.
In clinics, efficiency is key to obtaining providers to see as many patients within a reasonable amount of time. Ultimately, patient‐centred care and time management skills help to improve the number of patients seen in a clinic. Our findings indicate that MF‐BIA produces similar body composition values as ADP. Therefore, utilizing a device such as the InBody 720 will increase the number of patients to be tested, decrease the time to assess each patient, eliminate time spent changing into recommended testing attire and improve patient satisfaction 1. In conclusion, the InBody 720 MF‐BIA analyzer can provide a time‐efficient alternative to ADP in clinical settings where the assessment of body composition in obese patients is a component of treatment.
Conflict of Interest Statement
No conflict of interest was declared.
Sullivan, P. A. , Still, C. D. , Jamieson, S. T. , Dixon, C. B. , Irving, B. A. , and Andreacci, J. L. (2019) Evaluation of multi‐frequency bioelectrical impedance analysis for the assessment of body composition in individuals with obesity. Obesity Science & Practice, 5: 141–147. 10.1002/osp4.321.
References
- 1. Faria SL, Faria OP, Cardeal MD, Ito MK. Validation study of multi‐frequency bioelectrical impedance with dual‐energy X‐ray absorptiometry among obese patients. Obes Surg 2014; 24: 1476–1480. [DOI] [PubMed] [Google Scholar]
- 2. Das SK, Roberts SB, McCrory MA, et al. Long‐term changes in energy expenditure and body composition after massive weight loss induced by gastric bypass surgery. Am J Clin Nutr 2003; 78: 22–30. [DOI] [PubMed] [Google Scholar]
- 3. Huettner F, Rammos CK, Dynda DI, et al. Body composition analysis in bariatric surgery: use of air displacement plethysmograph. Am Surg 2012; 78: 698–701. [PubMed] [Google Scholar]
- 4. Heymsfield SB, Lohman TG, Wang Z, Going SB. Human Body Composition. Human Kinetics: Champaign, IL, 2005, pp. 63–78. [Google Scholar]
- 5. Tataranni PA, Ravussin E. Use of dual‐energy X‐ray absorptiometry in obese individuals. Am J Clin Nutr 1995; 62: 730–734. [DOI] [PubMed] [Google Scholar]
- 6. Levenhagen DK, Borel MJ, Welch DC, et al. A comparison of air displacement plethysmography with three other techniques to determine body fat in healthy adults. J Parenter Enteral Nutr 1999; 5: 293–299. [DOI] [PubMed] [Google Scholar]
- 7. Minderico CS, Silva AM, Teixeira PJ, Sardinha LB, Hull HR, Fields DA. Validity of air‐displacement plethysmography in the assessment of body composition changes in a 16‐month weight loss program. J Clin Nutr Metab 2006; 1: 32. [DOI] [PMC free article] [PubMed] [Google Scholar]
- 8. Demerath EW, Guo SS, Chumlea WC, Towne B, Roche AF, Siervogel RM. Comparison of percent body fat estimates using air displacement plethysmography and hydrodensitometry in adults and children. Int J Obes Relat Metab Disord 2002; 26: 389–397. [DOI] [PubMed] [Google Scholar]
- 9. Dempster P, Aitkens S. A new air displacement method for the determination of human body composition. Med Sci Sports Exerc 1995; 27: 1692–1697. [PubMed] [Google Scholar]
- 10. Bedogni G, Agosti F, De Col A, Marazzi N, Tagliaferri A, Sartorio A. Comparison of dual‐energy X‐ray absorptiometry, air displacement plethysmography and bioelectrical impedance analysis for the assessment of body composition in morbidly obese women. Eur J Clin Nutr 2013; 67: 1129–1132. [DOI] [PubMed] [Google Scholar]
- 11. Benton MJ, Swan PD, Schlairet MC, Sanderson S. Comparison of body composition measurement with whole body multifrequency bioelectrical impedance and air displacement plethysmography in healthy middle‐aged women. Health Care Women Int 2011; 32: 1068–1078. [DOI] [PubMed] [Google Scholar]
- 12. Nicoletti CF, Camelo JS, dos Santos JE, Marchini JS, Salgado W, Nonino CB. Bioelectrical impedance vector analysis in obese women before and after bariatric surgery: changes in body composition. Nutr J 2014; 30: 569–574. [DOI] [PubMed] [Google Scholar]
- 13. Savastano S, Belfiore A, Di Somma C, et al. Validity of bioelectrical impedance analysis to estimate body composition changes after bariatric surgery in premenopausal morbidly women. Obes Surg 2010; 20: 332–339. [DOI] [PubMed] [Google Scholar]
- 14. Heyward VH, Wagner DR. Applied Body Composition Assessment. Human Kinetics: Champaign, IL, 2004. [Google Scholar]
- 15. Anderson LJ, Erceg DN, Schroeder ET. Utility of multi‐frequency bioelectrical impedance compared to deuterium dilution for assessment of total body water. Nutr Diet 2015; 72: 183–189. [Google Scholar]
- 16. Hurst PR, Walsh DC, Conlon CA, Ingram M, Kruger R, Stonehouse W. Validity and reliability of bioelectrical impedance analysis to estimate body fat percentage against air displacement plethysmography and dual‐energy X‐ray absorptiometry. Nutr Diet 2016; 73: 197–204. [Google Scholar]
- 17. McCrory MA, Molé PA, Gomez TD, Dewey KG, Bernauer EM. Body composition by air‐displacement plethysmography by using predicted and measured thoracic gas volumes. J Appl Physiol 1998; 84: 1475–1479. [DOI] [PubMed] [Google Scholar]
- 18. Brozek J, Grande F, Anderson JT, Keys A. Densitometric analysis of body composition: revision of some quantitative assumptions. Ann N Y Acad Sci 1963; 110: 113–140. [DOI] [PubMed] [Google Scholar]
- 19. Deurenberg P, Leenen R, der Kooy VK, Hautvast JG. In obese subjects the body fat percentage calculated with Siri's formula is an overestimation. Eur J Clin Nutr 1989; 43: 569–575. [PubMed] [Google Scholar]
- 20. Lohman TG. Advances in Body Composition Assessment. Human Kinetics: Champaign, IL, 1992, pp. 3–4. [Google Scholar]
- 21. Sun G, French CR, Martin GR, et al. Comparison of multifrequency bioelectrical impedance analysis with dual‐energy X‐ray absorptiometry for assessment of percentage body fat in a large, healthy population. Am J Clin Nutr 2005; 81: 74–78. [DOI] [PubMed] [Google Scholar]
- 22. Pateyjohns IR, Brinkworth GD, Buckley JD, Noakes M, Clifton PM. Comparison of three bioelectrical impedance methods with DXA in overweight and obese men. J Obes 2006; 14: 2064–2070. [DOI] [PubMed] [Google Scholar]