

SUMMARY
Receptor-mediated oscillations in cytosolic Ca2+ concentration ([Ca2+]i) could originate either directly from an autonomous Ca2+ feedback oscillator at the inositol 1,4,5-trisphosphate (IP3) receptor or as a secondary consequence of IP3 oscillations driven by Ca2+ feedback on IP3 metabolism. It is challenging to discriminate these alternatives, because IP3 fluctuations could drive Ca2+ oscillations or could just be a secondary response to the [Ca2+]i spikes. To investigate this problem, we constructed a recombinant IP3 buffer using type-I IP3 receptor ligand-binding domain fused to GFP (GFP-LBD), which buffers IP3 in the physiological range. This IP3 buffer slows hormone-induced [IP3] dynamics without changing steady-state [IP3]. GFP-LBD perturbed [Ca2+]i oscillations in a dose-dependent manner: it decreased both the rate of [Ca2+]i rise and the speed of Ca2+ wave propagation and, at high levels, abolished [Ca2+]i oscillations completely. These data, together with computational modeling, demonstrate that IP3 dynamics play a fundamental role in generating [Ca2+]i oscillations and waves.
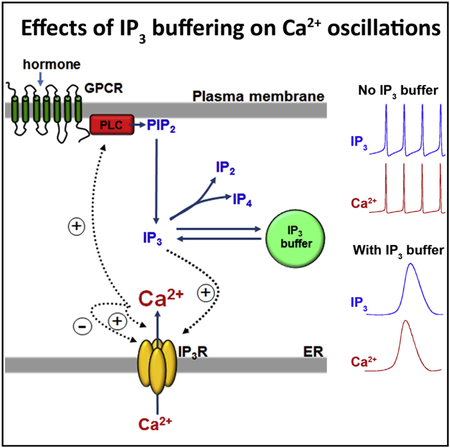
Graphical Abstract
In Brief
Gaspers et al. use a genetically encoded IP3 buffer to suppress IP3 dynamics during hormonal stimulation. Using this approach, they find that positive feedback of Ca2+ on IP3 formation is an essential component, generating long-period, baseline-separated Ca2+ oscillations and intracellular Ca2+ waves.
INTRODUCTION
Oscillatory Ca2+ signaling is a fundamental control process utilized by hormones and other agonists linked to the second messenger inositol 1,4,5-trisphospate (IP3). Stimulus strength is typically encoded by increasing the frequency of cytosolic Ca2+ ([Ca2+]i) oscillations. For example, in hepatocytes, baseline-separated [Ca2+]i oscillations with an extended frequency range (seconds to many minutes) provide fine control of metabolic output over log-order hormone dose ranges (Bartlett et al., 2014; Hajnóczky et al., 1995; Rooney et al., 1989; Woods et al., 1986). Despite their critical importance, the mechanisms underlying IP3-dependent [Ca2+]i oscillations have not been fully elucidated (Berridge, 1993; Dupont et al., 2011; Meyer and Stryer, 1988; Thomas et al., 1996; Thurley and Falcke, 2011). There are two distinct classes of apparently opposing hypotheses that are very difficult to distinguish experimentally: Ca2+ excitability models in which Ca2+ oscillations occur independent of IP3 oscillations and cross-coupling models whereby IP3 oscillations are required to drive periodic Ca2+ release and reuptake.
In Ca2+ excitability hypotheses, feedback regulation by Ca2+ release from the ER gives rise to oscillations in [Ca2+]i, with IP3 serving as an upstream trigger that does not need to oscillate itself (i.e., [Ca2+]i oscillations can occur at constant [IP3]). The complex regulatory properties of the IP3 receptor Ca2+ release channel (IP3R) provided a specific mechanism for Ca2+ excitability of the ER (De Young and Keizer, 1992; Hajnóczky and Thomas, 1997). Feedback activation through [Ca2+]i can causethe coordinated opening of IP3Rs and regenerative Ca2+ release from the ER via a Ca2+-induced Ca2+ release (CICR) mechanism, whereas delayed negative feedback by Ca2+ can result in the subsequent closing of IP3Rs and the return of [Ca2+]i to baseline through the action of Ca2+ pumps (Dupont and Goldbeter, 1993; Thomas et al., 1996; Wakui et al., 1989). Thus, the sequential Ca2+-dependent activation and inactivation of IP3Rs can give rise to an autonomous oscillator that generates periodic [Ca2+]ispikes. Mathematical models based solely on IP3R kinetics yield [Ca2+]i oscillations that occur at high frequency (seconds) and within a limited range of [IP3] or phospholipase-C (PLC) activity (De Young and Keizer, 1992). Experimental evidence supports the existence of such a fast [Ca2+]i oscillator mechanism in some cell types, activated by a static increase in average [IP3](Keizer et al., 1995; Lechleiter and Clapham, 1992; Sneyd et al., 2006).
In many other cell types, however, [Ca2+]i signals evoked with physiologically relevant agonist doses have much lower frequencies (of the order of minutes) than the oscillations based on periodic IP3R opening (Bartlett et al., 2014; Harootunian et al., 1991; Osipchuk et al., 1990; Politi et al., 2006; Rooney et al., 1989; Woods et al., 1986). In hepatocytes, the slow [Ca2+]i oscillations observed in hormone-stimulated intact cells revert to a higher frequency spiking pattern when studied at fixed [IP3] after cell permeabilization (Hajnóczky and Thomas, 1997). Thus, other mechanisms may be superimposed on the basic Ca2+ excitability model to produce the broad distribution of agonist-evoked [Ca2+]i oscillation frequencies observed experimentally. This can provide more efficient encoding of the strength of the extracellular stimulus into intracellular Ca2+ signaling (Politi et al., 2006).
Cross-coupling hypotheses postulate that the dynamics of IP3 and Ca2+ are mutually destabilizing, resulting in coupled oscillations of both messengers. In the most widely discussed model, stimulation of PLC by Ca2+ provides the positive feedback to generate a rapid burst of IP3 formation (Harootunian et al., 1991; Meyer and Stryer, 1988; Politi et al., 2006; Woods et al., 1986). Termination of Ca2+ release can occur by negative feedback processes such as Ca2+ inactivation of IP3R, elimination of IP3 by Ca2+activation of inositol 1,4,5-trisphosphate 3-kinase (ITPK), or inhibition of receptor-stimulated PLC by protein kinase C (PKC). Thus, Ca2+-dependent feedback on either PLC, ITPK, or PKC, alone or in combination, has the potential to generate oscillations in [IP3] and drive [Ca2+]i spiking (Politi et al., 2006).
Consistent with cross-coupling models, [Ca2+]i spiking has been shown to be accompanied by synchronous fluctuations in IP3 or phosphatidylinositol 4,5-bisphosphate levels in intact cells (Harootunian et al., 1991; Hirose et al., 1999; Matsu-ura et al., 2006; Várnai and Balla, 1998). This may be an indication that IP3-Ca2+ cross-coupling is involved in the regulation of [Ca2+]i oscillations. However, an alternative interpretation would be that the IP3 fluctuations are an epiphenomenon mediated by Ca2+-dependent changes in IP3 metabolism and are nonessential for generating [Ca2+]i oscillations (Dupont et al., 2003; Tanimura et al., 2009). We have taken a different approach from trying to measure IP3 oscillations and correlate [IP3] changes with [Ca2+]i oscillations, focusing instead on modifying IP3 dynamics with a genetically encoded IP3 buffer designed to function within the physiological range of [IP3]. The recombinant cytosolic IP3 buffer was constructed by the in-frame fusion of the N-terminal 620 amino acids of the type-I IP3R to the C terminus of green or red fluorescent protein (GFP-LBD or DsRed-LBD). Previous studies have shown that the N terminus of the IP3R expressed in E. coli can bind to IP3 with similar affinity to native IP3R (Yoshikawa et al., 1996).
Chemical Ca2+ buffers and recombinantly expressed Ca2+-binding proteins have been successfully employed to investigate the role of Ca2+ dynamics in numerous processes. IP3-binding proteins should prove equally useful to probe the role of IP3 dynamics in generating Ca2+ spikes. The expression of GFP-LBD is expected to slow the kinetics of agonist-evoked IP3 turnover without modifying the free steady-state [IP3]. Moreover, our modeling studies demonstrate that an IP3 buffer allows us to go beyond determining the causality between [IP3] and [Ca2+]i oscillations; it is also an ideal experimental tool to distinguish between positive- versus negative-feedback effects of Ca2+ on IP3 metabolism in controlling the generation of oscillatory Ca2+ signals (Politi et al., 2006).
The data presented here show that GFP-LBD can bind IP3 and decrease the rate of IP3 rise during agonist stimulation, which disrupts [Ca2+]i spikes in COS cells and primary hepatocytes. This perturbation of Ca2+ signaling was due to the ability of GFP-LBD to bind IP3, because a mutant that does not bind IP3 had no effect on agonist-induced [Ca2+]i responses. Increasing the level of GFP-LBD expression correlated with a loss of repetitive Ca2+ spiking and the appearance of distorted [Ca2+]i responses with slower kinetics and smaller amplitudes. These data suggest that [IP3] increased to a level sufficient to activate the IP3R but lacked a self-amplifying mechanism required for robust spikes of Ca2+ release and propagation of intracellular [Ca2+]i waves. Finally, introducing an IP3 buffer into a mathematical model based on the positive feedback of Ca2+ on PLC reproduced the experimental data. Taken together, these findings provide strong evidence that dynamic fluctuations of IP3 are an essential component in the generation of [Ca2+]i spikes and propagation of intracellular Ca2+ waves.
RESULTS
Expression of GFP-LBD in COS Cells
The properties of GFP-LBD were determined in COS cells transiently transfected with either GFP alone, GFP-LBD, or a nonbinding mutant of GFP-LBD, with a single amino acid substitution in the IP3-binding site (GFP-R265QLBD; Yoshikawa et al., 1996). Western blot analysis of cells transfected with GFP-LBD or GFP-R265QLBD revealed a band at~100 kDa, which corresponds to the full-length fusion protein(Figure S1A). Confocal images of COS cells expressing GFP-LBD or GFP-R265QLBD revealed a cytosolic distribution, similar to that observed with GFP (Figure S1B). Permeabilization of the plasma membrane with digitonin resulted in rapid loss of the GFP fusion proteins, suggesting they are not bound to cytoskeletal elements or organelles.
Although GFP-LBD appeared to be freely diffusible, it could potentially interact with endogenous proteins, including plasma membrane and intracellular ion channels, and thereby modify agonist-induced Ca2+ influx and/or ER Ca2+ content. To test these possibilities, COS cells expressing GFP, GFP-LBD, or GFP-R265QLBD were incubated in Ca2+-free medium and the ER Ca2+ stores were released by treatment with 50 μM cyclopiazonic acid (CPA), followed by addition of 1.5 mM CaCl2 to measure store-operated Ca2+ influx (Figures S1C–S1E). GFP-LBD did not affect the size of the Ca2+ store, monitored by the rate and magnitude of CPA-induced Ca2+ release, and did not alter the rate or amplitude of Ca2+ influx elicited by subsequent Ca2+ add back (Figures S1C–S1E). Similar results were obtained with the purinergic agonist ATP. GFP-R265QLBD also had no effect on intracellular Ca2+ release or Ca2+ influx (Figures S1F and S1G). Finally, there was no effect of GFP-LBD on resting [Ca2+]i, indicating that it did not alter basal [Ca2+]i homeostasis in the absence or presence of extracellular Ca2+ (Figures S1D and S1H). Similar results were obtained in hepatocytes (Figure S2A).
Because the intracellular concentration of the IP3 buffer is an important parameter for our analysis, we used a standard curve constructed with recombinant GFP to estimate the cytoplasmic concentration of each fusion protein on a cell-by-cell basis, as described previously (Politi et al., 2006). The mean levels of intracellular expression in COS cells for GFP-LBD and GFP-R265QLBD were similar (13 ± 1 μM and 12 ± 1 μM, respectively), whereas GFP alone was expressed at somewhat higher levels (22 ± 1 μM; see Table S1). As expected, there was an increase in the amount of total IP3 binding measured in lysates prepared from populations of COS cells transfected with GFP-LBD compared to GFP alone (79 ± 6 versus 20 ± 1 fmoles of IP3/mg cell protein, respectively, at 9.6 nM 3H-IP3).
These data demonstrate that the ligand-binding domain of GFP-LBD is expressed in the correct confirmation and is able to bind IP3. In addition, GFP-LBD does not modify the activity of plasma membrane Ca2+ channels, the size of internal Ca2+ stores, or the basal levels of [Ca2+]i.
GFP-LBD Blocks Agonist-Induced [Ca2+]i Oscillations in COS Cells
COS cells were transiently transfected with either GFP-LBD or GFP, and the [Ca2+]i responses to ATP stimulation at submaximal (1 μM) and then maximal (100 μM) doses were monitored with fura-2. Data from both expressing and nonexpressing cells were recorded simultaneously from the same microscope field. Figure 1 shows representative single-cell Ca2+ traces from coverslips transfected with either GFP (Figures 1A and 1B) or GFP-LBD (Figures 1C and 1D); in each case, the top panels show responses for untransfected cells from the same field as the transfected cell responses shown in the middle panels. Data are summarized in Figures 1E and 1F. The addition of 1 μM ATP elicited periodic, baseline-separated [Ca2+]i oscillations in >90% of the COS cells that did not express the transgene (Figures 1A and 1C) or expressed only GFP (Figure 1B). The kinetics and amplitude of these [Ca2+]i oscillations remained constant for the 10 min stimulation period and were not affected by the expression of GFP. By contrast, expression of GFP-LBD eliminated baseline-separated [Ca2+]i oscillations in response to submaximal ATP; instead, a slow monophasic increase in [Ca2+]i was observed (Figure 1D). The amplitude (Figure 1E) and rate of [Ca2+]i increase (Figure 1F) in these cells were significantly lower following submaximal ATP stimulation when compared to nonexpressing or GFP-positive cells.
Figure 1. Effects of GFP-LBD and GFP-R265QLBD on Agonist-Induced Ca2+ Signals in COS Cells.

COS cells transfected with GFP, GFP-LBD, or GFP-R265QLBD were loaded with fura-2 and then stimulated with ATP (arrowheads).
(A–D) Traces are typical ATP-induced [Ca2+]i responses in nonexpressing (A and C) and expressing (B and D) cells on the same coverslips.
(E and F) The amplitude (E) and rate of rise (F) of [Ca2+]i spikes induced by submaximal and maximal ATP are summarized for cells expressing GFP, GFP-LBD, or nonexpressing cells (none). Data are mean ± SEM from six separate experiments (n = 10–14 cells/group). *p < 0.05.
(G–I) Bottom traces show [Ca2+]i responses to stepwise increases in ATP in cells expressing nothing (G), GFP-LBD (H), or GFP-R265QLBD (I).
Maximal ATP concentrations (100 μM) evoked a sustained increase in [Ca2+]i in both expressing and nonexpressing COS cells transfected with either GFP or GFP-LBD (Figure 1). The mean amplitude and rate of rise of these [Ca2+]i increases were larger than those observed with 1 μM ATP (Figures 1E and 1F). There were no significant differences between any of the groups in the amplitude of the [Ca2+]i increase at 100 μM ATP, indicating that, with sufficient stimulation, enough IP3 could be generated to overcome the effect of the recombinant IP3 buffer. The mean rate of [Ca2+]i increase in GFP-LBD-expressing cells was slower than any of the control groups, but this parameter was variable in the presence of GFP-LBD and was not statistically significant.
To test whether the lack of baseline-separated [Ca2+]i oscillations in GFP-LBD-expressing COS cells was due to a shift in the effective ATP sensitivity, we carried out dose-response studies in these cells (Figure 1H). However, [Ca2+]i oscillations were not observed at any dose of ATP up to the maximum that gave a sustained [Ca2+]i increase equivalent to that in control cells. Instead, low-amplitude monophasic [Ca2+]i in creases were observed, the amplitude of which increased in a dose-dependent manner. Frequency-modulated [Ca2+]i oscillations with similar amplitude and kinetics to control cells were observed over the effective ATP dose range in nonexpressing COS cells and cells expressing the nonbinding mutant R265QLBD (Figures 1G and 1I). Thus, the suppression of agonist-induced [Ca2+]i oscillations is a fundamental consequence of IP3 binding by GFP-LBD and not just due to a shift in the effective free [IP3].
Taken together, these data demonstrate that GFP-LBD does not prevent agonist-induced mobilization of Ca2+ from intra-cellular stores, even though it eliminates the ability of COS cells to generate [Ca2+]i oscillations. The monotonic [Ca2+]i increase evoked by agonist stimulation (Figures 1D and 1H) indicates that IP3 levels were sufficient to activate the IP3R but lacked a positive feedback mechanism required for rapid Ca2+ mobilization.
GFP-LBD Suppresses [Ca2+]i Oscillationsin Hepatocytes
Hepatocytes provide one of the most well-characterized examples of frequency-modulated [Ca2+]i oscillations in primary cells and tissues, where they play a key role in the regulation of hepatic metabolism (Bartlett et al., 2014; Hajnóczky et al., 1995; Thomas et al., 1996). Figure 2 shows the effects of GFP-LBD expression on hormone-stimulated [Ca2+]i signaling in primary cultures of rat hepatocytes. Figure 2A shows representative single-cell [Ca2+]i traces from hepatocytes expressing GFP or different levels of GFP-LBD. GFP-LBD-positive cells were divided into low- and high-expressing cells using a cutoff that corresponded to a calculated intracellular GFP concentration of 10 μM. The effects of GFP or GFP-LBD on the pattern of hormone-evoked [Ca2+]i responses are summarized in Figure 2B.
Figure 2. Effects of GFP-LBD on Hormone-Induced Ca2+ Signals in Hepatocytes.

Hepatocytes transfected with GFP or GFP-LBD were loaded with fura-2.
(A) VP-induced [Ca2+]i increases in cells expressing GFP and low or high levels of GFP-LBD ([GFP] given under plots; see Table S1 for mean data).
(B) Percentage of cells showing the indicated Ca2+ response to submaximal hormone; n = 6 cell preparations.
(C) Mean width of VP-induced [Ca2+]i spikes at half peak height as a function of [GFP].
(D) Green and red traces show [Ca2+]i spikes at proximal and distal subcellular regions along the Ca2+ wave-propagation vector during 2 nM VP stimulation; vector lengths were 15.5 mm (i), 16.8 mm (ii), and 19.2 mm (iii). Fluorescence was normalized to initial and peak intensity.
(E and F) Effects of GFP-LBD on rates of Ca2+ wave propagation and [Ca2+]i rise in response to submaximal and maximal hormone. Data are mean ± SEM (six cell preparations). *Significantly different from GFP-expressing cells; black diamond, significantly different from GFP and low-GFP-LBD-expressing cells; p < 0.05.
Stimulation of GFP-expressing hepatocytes with vasopressin (VP) induced repetitive [Ca2+]i spiking that increased in frequency in a dose-dependent manner until a sustained plateau of [Ca2+]i was achieved (Figure 2A), consistent with the frequency modulation reported in previous studies (Rooney et al., 1989; Woods et al., 1986). Submaximal VP (3 nM) evoked repetitive [Ca2+]i spiking in 60% of the GFP-positive hepatocytes (Figure 2B) with similar kinetic properties to those observed in untransfected hepatocytes (Rooney et al., 1989). In both GFP- and GFP-LBD-expressing cells, the full scope of hormone-evoked Ca2+ responses was observed after hormone treatment, ranging from no response through repetitive oscillations to peak and plateau maximal increases in [Ca2+]i (Figure 2B). Importantly, in hepatocytes, baseline-separated [Ca2+]i spiking could be elicited by VP in the presence of GFP-LBD. However, with increasing expression levels, GFP-LBD reduced the percentage of cells exhibiting repetitive baseline-separated [Ca2+]i spikes (Figure 2B). In addition, there was a marked broadening of the individual [Ca2+]i transients with increasing levels of the GFP-LBD IP3 buffer (Figure 2). In control (GFP-expressing) hepatocytes, the widths of consecutive spikes remained constant, averaging 22 ± 1 s (n = 27 cells). The spike duration was significantly longer in GFPLBD-expressing hepatocytes, averaging 50 ± 7 s (p < 0.05; n = 21 cells). Moreover, the spike width in individual hepatocytes correlated positively with the calculated GFP-LBD concentrations (R2 = 0.58), whereas there was no correlation between spike width and GFP expression (R2 = 0.001; Figure 2C).
In the presence of high GFP-LBD (>10 μM), VP (1–3 nM) often evoked a single, broad [Ca2+]i transient with a dramatically slower rising phase (Figure 2A). The mean amplitude of these single-phasic [Ca2+]i increases in the presence of GFP-LBD was not significantly different from GFP or nonexpressing controls (Figure S2A). Stepwise increases in VP concentration did not induce amplitude-modulated [Ca2+]i increases in GFP-LBD-expressing hepatocytes similar to those observed in COS cells (Figure 1). Nevertheless, the broadening of the [Ca2+]i oscillations, slower rate of rise (see below), and switch to a slow single-phasic transient in the presence of GFP-LBD all provide evidence that IP3 dynamics are a component of the Ca2+ oscillator that generates baseline-separated Ca2+ spiking in hepatocytes.
In contrast to the baseline-separated [Ca2+]i spikes in hepatocytes and COS cells, ATP stimulation of MDA MB231 breast cancer cells causes high-frequency sinusoidal-like Ca2+ oscillations (Figure S3). Expression of LBD in these cells did not affect the [Ca2+]i oscillation frequency but did reduce the amplitude of both the initial spike and subsequent oscillations (Figure S3). Similar results were observed in the absence of extracellular Ca2+, showing that the effects were not secondary to Ca2+ influx. These data in MDA MB231 cells are consistent with the predicted effects of LBD on fast Ca2+ oscillations that can occur under conditions of constant [IP3], which typically occurs at high levels of PLC activation (Politi et al., 2006). Thus, the effect of IP3 buffering to suppress [Ca2+]i oscillations is primarily associated with long-period, baseline-separated Ca2+ spiking, although this does not exclude a role for Ca2+ feedback on IP3 dynamics during faster oscillations.
The Effect of GFP-LBD on Intracellular [Ca2+]i Waves
In many cell types, [Ca2+]i oscillations are organized as intracellular Ca2+ waves. In hepatocytes, the Ca2+ waves begin at a discrete subcellular locus associated with the apical membrane and then propagate through the cell with constant velocity and amplitude (Rooney et al., 1990). Figure 2D shows time courses of [Ca2+]i increase at discrete subcellular sites following VP stimulation in GFP-, low-GFP-LBD, or high-GFP-LBD-expressing hepatocytes. In each case, the green and red traces are the [Ca2+]i increases from two subcellular regions in the same cell, separated by similar distances (see legend). The effects of GFP or GFP-LBD expression on the rates of Ca2+ wave propagation and rates of [Ca2+]i rise are summarized in Figures 2E and 2F. Submaximal agonist concentrations were defined as those that evoked oscillatory [Ca2+]i responses in GFP and low-GFP-LBD-expressing cells, whereas maximal hormone doses evoked a peak and plateau [Ca2+]i increase in all cells. In the GFP-expressing control cells, the rates of Ca2+ wave propagation and rates of Ca2+ rise were not significantly different between sub-maximal and maximal hormone concentrations (Figures 2E and S2C), consistent with our previous work showing that Ca2+ wave rates are independent of agonist dose (Rooney et al., 1990). Increasing GFP-LBD expression from low to high levels progressively slowed the rates of Ca2+ wave propagation and decreased rates of Ca2+ rise elicited by submaximal hormone stimulation (Figure 2). Maximal VP overcame the actions of low levels of GFP-LBD expression on both [Ca2+]i oscillation parameters but only partially reversed the effects of high GFP-LBD expression (Figures 2E and 2F). We also examined the effects of LBD on the kinetics of Ca2+ waves using a recombinant Ca2+-sensitive fluorescent protein, RGECO1 (Zhao et al., 2011). This protein-based Ca2+ indicator is more slowly diffusible with lower buffering capacity compared to fura-2, so it should minimize alterations in Ca2+ wave kinetics that might derive from indicator effects on Ca2+ diffusion. Nevertheless, the expression of GFP-LBD still reduced Ca2+ wave velocity in a stimulus-strength-dependent manner in our studies using RGECO1 (Figures S2B and S2C). Thus, similar results were obtained with fura-2 and RGECO1: LBD decreased the rate of [Ca2+]i rise even at subcellular resolution and slowed the propagation of Ca2+ waves. If [Ca2+]i oscillations and waves were dependent only on Ca2+-feedback effects on Ca2+ release and reuptake, independent of oscillations in IP3, the Ca2+ dynamics should not be affected by the IP3 buffering effect of GFP-LBD.
Effect of LBD Expression on Ca2+ Responses Elicited by Slow Release of Caged IP3
In order to further investigate whether the effects of IP3 buffering on hormone-induced [Ca2+]i oscillations are indicative of a causative role for IP3 oscillations, we examined the response to a slow, continuous uncaging of IP3. Progressive uncaging of IP3 with low-intensity UV illumination in the absence of hormone resulted in a monophasic [Ca2+]i rise after a brief delay, followed by a slow return to basal. Figure 3 shows representative traces from GFP- and GFP-LBD-expressing hepatocytes coexpressing RGECO1 for [Ca2+]i measurement. Importantly, there was no effect of LBD on the rate of rise (Figure 3C) or the peak amplitude (Figure 3D) of the [Ca2+]i increase elicited by uncaging IP3. One interpretation of these data is that once the [IP3] crosses a critical threshold, the primary driver of [Ca2+]i increase is CICR, yielding a Ca2+ transient that is essentially autonomous from the slowly rising IP3 level. Despite the lack of effect of LBD on the rising phase, it significantly prolonged the [Ca2+]i spike width (Figure 3E), perhaps because it slows IP3 degradation. Once the [Ca2+]i response to IP3 uncaging had returned to basal, the hepatocytes were subsequently challenged with 1 nM VP. In contrast to the results with IP3 uncaging, the rates of rise and peak amplitude of VP-induced Ca2+ transients were significantly decreased in the presence of LBD (Figures 3C and 3D). These data demonstrate that the effect of the IP3 buffer is not simply a consequence of the rate of delivery of IP3 to the IP3R or the relative rates of IP3 R Ca2+ activation and inactivation. Instead, the data support a role for rapid dynamic modulation of IP3 levels specifically during hormone-induced [Ca2+]i oscillations.
Figure 3. Effect of GFP-LBD on [Ca2+]i Response to Slow Uncaging of IP3.

(A and B) Hepatocytes cotransfected with RGECO1 and either GFP (A) or GFP-LBD (B) were loaded with caged IP3 (2 μM; 1 hr). The gray area shows the duration of slow IP3 uncaging elicited by low-intensity UV illumination (50 ms exposures at 2 Hz). VP was added at the arrow 5 min after stopping UV illumination.
(C–E) Summary of the effects of GFP and GFPLBD on the rate of Ca2+ rise (C), peak amplitude (D), and spike width (E). Data are mean ± SEM (n R 50 cells from four separate experiments). *Significantly different from GFP-expressing cells (p < 0.05); #significantly different from control (GFP) VP response; p < 0.05.
Effect of GFP-LBD on Agonist-Induced IP3 Increases
The effects of GFP-LBD expression on intracellular IP3 levels were measured in populations of COS cells using an IP3 mass assay. Stimulation with submaximal ATP (1 μM) for 60 s increased total intracellular IP3 by 30% ± 1% above basal in control GFP-expressing cells, whereas IP3 accumulation in GFP-LBD-expressing cells was significantly greater at 69% ± 5% above basal (p < 0.001). No significant difference in the basal levels of IP3 could be detected between the two cell populations. The higher accumulation of total IP3 in the presence of GFP-LBD is an expected consequence of IP3 buffering, because the IP3 buffer creates an additional cellular pool of sequestrated IP3.
To directly measure agonist-induced [Ca2+]i and IP3 changes simultaneously by single-cell imaging, we used the recombinant IP3-sensitive biosensor IRIS-1 (Matsu-ura et al., 2006) together with the chemical Ca2+ indicator Indo-1. More than 90% of nontransfected COS cells responded to increasing ATP concentrations with frequency-modulated [Ca2+]i spiking, whereas ATP induced only sporadic [Ca2+]i spikes in the presence of IRIS-1 (Figure S4). This presumably reflects the effect of IP3 binding by IRIS-1 and is consistent with the sensitivity of COS cells to the IP3 buffering effects of GFP-LBD shown in Figure 1. In order to examine the effect of the LBD buffer on IP3 dynamics, a DsRed-LBD construct was used so that IRIS-1 and LBD could be discriminated in cotransfected cells. Stimulation with maximal ATP caused a sustained increase in [Ca2+]i and a robust rise in the IRIS-1 emission ratio in both DsRed and DsRed-LBD-expressing cells (Figure S4C). DsRed-LBD did not alter the magnitude of [IP3] increase induced by maximal ATP but slowed the rate of IP3 rise by about 5-fold (Figures S4D and S4E). As with our measurements of total IP3 formation, this is what is predicted for an IP3 buffer and serves to validate our approach using the LBD-expression constructs to modify the kinetics of IP3. In common with GFP-LBD, DsRed-LBD completely eliminated the occurrence of ATP-induced [Ca2+]i oscillations in COS cells. Therefore, it was not possible to determine the effect of LBD on [IP3] dynamics during [Ca2+]i spiking in these cells.
We also used IRIS-1 to examine the effects of DsRed-LBD expression on IP3 and [Ca2+]i dynamics in hormone-stimulated hepatocytes (Figure 4). At low levels of expression, IRIS-1 did not block [Ca2+]i oscillations induced by submaximal VP but slowed the rising phase of the [Ca2+]i spike (compare DsRed to None in Figure 4C). This is expected because IRIS-1 is itself an IP3 buffer, but fortunately, its buffering effect is not sufficient to prevent the [Ca2+]i oscillations in hepatocytes. Importantly, for each [Ca2+]i spike, there was a parallel transient increase in the IRIS-1 emission ratio, indicating that Ca2+ and IP3 oscillations are synchronized in hepatocytes (Figure 4A). The onset of the [Ca2+]i and IP3 spikes appeared to occur simultaneously, whereas peak [Ca2+]i was achieved while the IP3 level was still rising (Figure 4B). The declining phase of the IP3 oscillations clearly lagged behind the relaxation of the [Ca2+]i spike, and this was also apparent in the longer peak duration for IP3 (Figures 4B and 4D). These data are consistent with positive feedback of Ca2+ on IP3 generation (Politi et al., 2006). Coexpression of the IP3 buffer DsRed-LBD with IRIS-1 slowed the rate of rise of [IP3], and this was accompanied by a slowing and broadening of the [Ca2+]i spike (Figure 4), similar to that observed with GFP-LBD (Figures 2 and 3). Although DsRed-LBD expression slowed the rates of [IP3] increase evoked by both submaximal and maximal hormone stimulation, it did not alter the magnitude of these IP3 increases (Figures 4E and 4F).
Figure 4. Effect of LBD on [Ca2+]i and IP3 Dynamics in Hepatocytes.

Hepatocytes cotransfected with IRIS-1 and either DsRed or DsRed-LBD were loaded with Indo-1 and then stimulated with submaximal (1–5 nM VP) or maximal (100 nM VP or 100 μM ATP) agonist.
(A) Simultaneous measurement of IP3 and [Ca2+]i oscillations.
(B) Expanded time course of single IP3 and [Ca2+]i transients in the presence of DsRed or DsRed-LBD.
(C and D) Kinetics of VP-induced [Ca2+]i oscillations in cells expressing IRIS-1 plus DsRed (DsRed) or IRIS-1 plus DsRed-LBD (LBD), compared to nonexpressing cells on the same coverslips (None).
(E and F) Effect of DsRed-LBD on the rate and magnitude of IP3 formation measured with IRIS-1 in cells stimulated with submaximal and maximal agonist. Data are mean ± SEM; n = 4–7 cells from five separate experiments. *Significantly different from nonexpressing cells; black diamond, significantly different from DsRed and nonexpressing cells; black triangle, significantly different from DsRed-expressing cells; p < 0.05.
The data presented above demonstrate that the IP3 buffers DsRed-LBD and GFP-LBD act to suppress [Ca2+]i oscillations by slowing the rate of increase in free IP3 and not by inhibiting IP3 formation. This is consistent with a key role for IP3 dynamics in driving [Ca2+]i oscillations. It should be noted that IRIS-1 also partially inhibited agonist-induced [Ca2+]i oscillations, even though it has a lower affinity for IP3 than the type-I IP3R used to derive the LBD-based IP3 buffers (Kd of 500 nM versus 40 nM, respectively; Matsu-ura et al., 2006; Yoshikawa et al., 1996). These findings indicate that IRIS-1 (and presumably other IP3 indicators) can interfere with Ca2+ dynamics by buffering agonist-induced changes in IP3.
Mathematical Modeling of IP3 Buffer Effects on IP3-Induced Ca2+ Oscillators
The data presented here provide evidence that oscillations of IP3 are essential for the generation of [Ca2+]i spiking in many cell types. Different mechanisms for feedback regulation of IP3 levels by Ca2+ ions have been proposed that can result in coupled oscillations of [IP3] and [Ca2+]i: (1) inhibition of IP3 generation through PKC-mediated inactivation of agonist receptors or PLC; (2) Ca2+-mediated activation of IP3 removal by ITPK; and (3) activation of PLC by Ca2+ (see Politi et al., 2006 and Sneyd et al., 2006). We have investigated how a molecular IP3 buffer (e.g., GFP-LBD) is predicted to affect these oscillator mechanisms by analyzing prototypical mathematical models for each mechanism. The models incorporate the regulatory properties of the IP3R (stimulation by IP3 and activation and delayed inhibition by [Ca2+]i) together with one of the above-mentioned feedback mechanisms (Figure S5).
In the absence of IP3 buffer, all models reproduce the experimentally observed encoding of agonist dose into [Ca2+]i oscillation frequency (Figures 5A–5D). This result shows that fundamentally different oscillator mechanisms can account for the data. However, the introduction of an IP3 buffer (at concentrations achieved for GFP-LBD; Table S1) reveals qualitative differences between the models. In the negative-feedback models (1 and 2), the IP3 buffer decreased oscillation frequency and increased the latency to first spike (Figures 5E and 5F), but the oscillations persisted even at very high concentrations of IP3 buffer (30 μM). By contrast, in the positive-feedback model with Ca2+-activated PLC, IP3 buffer (5 μM) completely abolished oscillations. Instead, stepwise increases of [Ca2+]i with increasing agonist concentrations were observed (Figure 5G) that closely resemble the experimental observations in COS cells (Figure 1). In this model, plasma-membrane Ca2+ fluxes were neglected, assuming that they are small relative to the fluxes across the ER membrane. When substantial Ca2+ fluxes through the plasma-membrane Ca2+ ATPase were added to the model, the IP3 buffer converted [Ca2+]i oscillations into slow and broad responses to agonist stimulation (Figure 5H) that are similar to those observed in hepatocytes (Figure 2). For lower concentrations of IP3 buffer (~1 μM), the oscillations persisted but had lower frequencies (not shown).
Figure 5. Simulations of the Effect of GFP-LBD Expression in Mathematical Models of Ca2+/IP3 Oscillations.

Ca2+ and IP3 oscillations were modeled as described in Supplemental Information in the absence (A–D) and presence (E–H) of LBD IP3 buffer. Parameters used are given in Table S2. Stepwise agonist dose increases occur at each arrow. All models show frequency encoding of stimulus strength in the absence of LBD. LBD does not abolish oscillations in models with PKC-mediated receptor/PLC inactivation (E) or Ca2+-dependent IP3 metabolism by ITPK (F). Ca2+ oscillations are abolished by LBD in models with Ca2+ activation of PLC (G and H). Graded plateau [Ca2+]i increases occur when the plasma membrane fluxes are neglected (G), and slow broad [Ca2+]i transients occur when Ca2+ fluxes through the PMCA are substantial (H). LBD concentrations were 30 μM in (E), (F), and (H) and 5 mM in (G).
In summary, negative-feedback models involving either PKC or ITPK cannot account for the experimentally observed effects of GFP-LBD. By contrast, the positive-feedback model with Ca2+ activation of PLC reproduces the distinct patterns of broadened [Ca2+]i oscillations and amplitude-modulated stepwise [Ca2+]i increases observed in the presence of the IP3 buffer in hepatocytes and COS cells. This provides further evidence that IP3 dynamics are an intrinsic component of the Ca2+ oscillator, at least for these cell types.
DISCUSSION
We have used engineered IP3-binding proteins expressed in intact cells to investigate the effects of slowing [IP3] dynamics on hormone-induced [Ca2+]i oscillations. Apart from possible effects on the initial Ca2+ spike, IP3 buffers are not expected to substantially affect [Ca2+]i oscillator mechanisms that depend only on a static increase in [IP3] (e.g., CICR at the IP3R). By contrast, IP3 buffering is expected to perturb the ongoing generation of repetitive [Ca2+]i spikes that depend on rapid modulation of IP3 levels to sustain the oscillatory behavior (e.g., cross-coupling between Ca2+ and IP3). Thus, IP3 buffers can be used as an experimental tool to examine the causality between IP3 dynamics and Ca2+ oscillations. Moreover, computational studies have shown that an IP3 buffer can be used to distinguish the type of Ca2+-dependent feedback (positive versus negative) on IP3 metabolism, because these mechanisms predict qualitatively different effects of IP3 buffering (Politi et al., 2006).
Expression of molecular IP3 buffers in hepatocytes and COS cells suppressed or eliminated oscillatory [Ca2+]i signals in a concentration-dependent manner. The IP3R ligand-binding domain constructs used here did not directly affect intracellular Ca2+ release or plasma membrane Ca2+ entry mechanisms. The effects on [Ca2+]i oscillations were specific for GFP-LBD binding to IP3 because the nonbinding mutant R265QLBD had no effect. Importantly, these IP3 buffering effects were not restricted to the initial phase of the oscillations but were observed for the first [Ca2+]i spike and all of the subsequent spikes in the oscillation train. The fact that IP3 buffering affected these later Ca2+ oscillations is a clear indication of the importance of IP3 dynamics during ongoing Ca2+ spiking.
Simultaneous direct measurement of [IP3] and [Ca2+]i revealed synchronized oscillations in both messengers during hormone stimulation. Importantly, the fact that the IP3 buffer slowed the rate of rise of both [Ca2+]i and [IP3] indicates that Ca2+ dynamics are intimately tied to IP3 dynamics. Moreover, the effects of GFP-LBD cannot be explained by a reduction in the steady-state or time-averaged increase in free [IP3], because the peak [IP3] during each [Ca2+]i spike was unaffected and the perturbation of [Ca2+]i and [IP3] kinetics persisted throughout the train of oscillations. GFP-LBD also slowed the falling phase of each [Ca2+]i oscillation, which is consistent with the expected interplay between Ca2+ and IP3 in the cross-coupling PLC positive feedback model (Politi et al., 2006). Thus, inactivation of the IP3R by Ca2+ negative feedback is insufficient to fully terminate Ca2+ release until the [IP3] falls, and this process is slowed by the presence of the IP3 buffer.
A slow, continuous photolysis of caged IP3 was used to mimic the low hormone doses that typically induce Ca2+ oscillations in hepatocytes. Although this slow IP3 uncaging could elicit a Ca2+ spike, the rates of Ca2+ rise were about 10-fold slower compared to those recorded after VP stimulation and also had a significantly lower amplitude. This can be explained by positive Ca2+ feedback on PLC only occurring during hormone activation, whereas the slow uncaging of IP3 in the absence of hormone does not engage this positive feedback on IP3 generation. Importantly, GFP-LBD did not affect the rate of rise or amplitude of Ca2+ increases triggered by the slow release of caged IP3, whereas subsequent hormone-evoked Ca2+ oscillations were inhibited in the same cell. These data indicate that the effects of GFP-LBD expression on hormone-induced Ca2+ oscillations are not a simple consequence of the rate of delivery of IP3 to the IP3R to trigger CICR. Instead, the qualitatively different effects of IP3 buffering observed with hormone compared to IP3 uncaging demonstrate the importance of positive feedback to regenerate IP3 during hormone stimulation and show that IP3 dynamics are an essential component sustaining baseline separated Ca2+ oscillations. Finally, our observation that hepatocytes and COS cells expressing high levels of GFP-LBD did not exhibit agonist-induced [Ca2+]i oscillations at all but instead responded with monophasic or broad [Ca2+]i transients indicates that [Ca2+]i oscillations do not occur in these cells in the absence of [IP3] oscillations.
Taken together, the data are consistent with a model in which [IP3] oscillations, mediated by Ca2+-dependent feedback on IP3 metabolism, are essential for repetitive, large-amplitude [Ca2+]i spiking. Cross-coupling between Ca2+ and IP3 can occur through either positive or negative feedback mechanisms. However, our experimental and computational studies indicate that the results can only be reproduced with a positive feedback mechanism, i.e., Ca2+-dependent activation of PLC. The IP3 buffer interferes by dampening and, at high concentration, abolishing the [IP3] oscillations. Accordingly, oscillatory [Ca2+]i spikes are slowed and prolonged at low buffer concentration and disappear at high buffer concentration.
In conclusion, this study presents evidence that Ca2+ feedback regulation of the IP3R is not sufficient in itself to generate low-frequency, baseline-separated [Ca2+]i oscillations elicited by PLC-linked hormones in hepatocytes and COS cells. Experimental manipulation of IP3 dynamics with an IP3 buffer has provided important insights into the mechanisms generating [Ca2+]i oscillations and waves. Our data are consistent with a model for [Ca2+]i spiking that combines IP3-Ca2+ cross-coupling with IP3R-based Ca2+ excitability. The combination of two coupled oscillators, one at the level of IP3 generation/breakdown and the other at the level of IP3R activation/inactivation, can greatly extend the frequency range for encoding hormone stimulus strength in [Ca2+]i oscillations (Politi et al., 2006). This provides a high-fidelity signal, even at very low hormone doses, and is likely to be a widely used paradigm to fine-tune responses to stimulation.
EXPERIMENTAL PROCEDURES
Cells
COS-7 cells obtained from American Type Culture Collection were cultured in Dulbecco’s modified Eagle’s medium plus 10% fetal bovine serum. Hepatocytes were isolated by collagenase perfusion of rat livers and maintained in primary culture for 16–20 hr in Williams E medium (Hajnóczky et al., 1995; Rooney et al., 1989). Animal studies were approved by Rutgers New Jersey Medical School Institutional Animal Care and Use Committee.
GFP-LBD Expression and IP3 Binding
Rat type 1 IP3R cDNA encoding LBD, residues 1–620, and R265QLBD were ligated in frame to the C terminus of pGFP-C1 or pDsRed-C1 (Clontech Laboratories) to generate the plasmids pGFP-LBD, pDsRed-LBD, and pGFP-R265QLBD. Cells were transfected 16–48 hr prior to use. Expression of recombinant protein was confirmed by western blot analysis with anti-GFP antibody. Confocal microscopy was used to calculate the intracellular [GFP] as described previously (Politi et al., 2006). Quantitation of IP3-binding sites in lysates of transfected COS cells was determined using [3H]-IP3 (Joseph et al., 1995). Agonist-induced formation of IP3 in intact COS cells was measured using a commercial IP3 mass assay (GE Healthcare).
Ca2+ and IP3 Imaging
Live-cell imaging was performed with cells plated on glass coverslips. Fura-2 or Indo-1 were loaded as acetoxymethyl esters for 20–40 min. RGECO1 (Addgene) or IRIS-1 (gift of K. Mikoshiba, RIKEN Brain Science Institute) were cotransfected with the LBD constructs as required. The cells were incubated in HEPES-buffered physiological saline solution in a microscope chamber maintained at 37°C. Properties of [Ca2+]i oscillations and waves were determined as described previously (Hajnóczky and Thomas, 1997; Rooney et al., 1989, 1990).
Model Description
The mathematical models (Figure S5) used to compute the time courses of IP3 concentration, P; [Ca2+ ]i, c; the free Ca2+ concentration in the ER, s; and the fraction of active IP3Rs, r, for the negative-feedback and positive-feedback-generated [Ca2+]i spiking are described in the Supplemental Information.
Supplementary Material
Highlights.
Ca2+ oscillation mechanisms can be distinguished using an IP3 buffer
IP3 buffer suppresses IP3 oscillations without decreasing peak levels of IP3 or Ca2+
IP3 buffering slows Ca2+ oscillation kinetics and reduces Ca2+ wave-propagation rates
Ca2+ oscillations in hepatocytes are driven by Ca2+ feedback on IP3 formation
ACKNOWLEDGMENTS
We acknowledge support from the NIH (DK082954 to A.P.T. and AA017752 to L.D.G.) and the Thomas P. Infusion Endowed Chair (to A.P.T.). IRIS-1 was generously provided by Dr. K. Mikoshiba.
Footnotes
SUPPLEMENTAL INFORMATION
Supplemental Information includes Supplemental Experimental Procedures, five figures, and two tables and can be found with this article online at http://dx.doi.org/10.1016/j.celrep.2014.10.033.
REFERENCES
- Bartlett PJ, Gaspers LD, Pierobon N, and Thomas AP (2014). Calcium-dependent regulation of glucose homeostasis in the liver. Cell Calcium 55, 306–316. [DOI] [PubMed] [Google Scholar]
- Berridge MJ (1993). Inositol trisphosphate and calcium signalling. Nature 361, 315–325. [DOI] [PubMed] [Google Scholar]
- De Young GW, and Keizer J (1992). A single-pool inositol 1,4,5-trisphosphate-receptor-based model for agonist-stimulated oscillations in Ca2+ concentration. Proc. Natl. Acad. Sci. USA 89, 9895–9899. [DOI] [PMC free article] [PubMed] [Google Scholar]
- Dupont G, and Goldbeter A (1993). One-pool model for Ca2+ oscillations involving Ca2+ and inositol 1,4,5-trisphosphate as co-agonists for Ca2+ release. Cell Calcium 14, 311–322. [DOI] [PubMed] [Google Scholar]
- Dupont G, Koukoui O, Clair C, Erneux C, Swillens S, and Combettes L (2003). Ca2+ oscillations in hepatocytes do not require the modulation of InsP3 3-kinase activity by Ca2+. FEBS Lett 534, 101–105. [DOI] [PubMed] [Google Scholar]
- Dupont G, Combettes L, Bird GS, and Putney JW (2011). Calcium oscillations. Cold Spring Harb. Perspect. Biol 3, pii: a004226. [DOI] [PMC free article] [PubMed] [Google Scholar]
- Hajnóczky G, and Thomas AP (1997). Minimal requirements for calcium oscillations driven by the IP3 receptor. EMBO J 16, 3533–3543. [DOI] [PMC free article] [PubMed] [Google Scholar]
- Hajnóczky G, Robb-Gaspers LD, Seitz MB, and Thomas AP (1995). Decoding of cytosolic calcium oscillations in the mitochondria. Cell 82, 415–424. [DOI] [PubMed] [Google Scholar]
- Harootunian AT, Kao JP, Paranjape S, and Tsien RY (1991). Generation of calcium oscillations in fibroblasts by positive feedback between calcium and IP3. Science 251, 75–78. [DOI] [PubMed] [Google Scholar]
- Hirose K, Kadowaki S, Tanabe M, Takeshima H, and Iino M (1999). Spatiotemporal dynamics of inositol 1,4,5-trisphosphate that underlies complex Ca2+ mobilization patterns. Science 284, 1527–1530. [DOI] [PubMed] [Google Scholar]
- Joseph SK, Ryan SV, Pierson S, Renard-Rooney D, and Thomas AP (1995). The effect of mersalyl on inositol trisphosphate receptor binding and ion channel function. J. Biol. Chem 270, 3588–3593. [DOI] [PubMed] [Google Scholar]
- Keizer J, Li YX, Stojilkovic S, and Rinzel J (1995). InsP3-induced Ca2+ excitability of the endoplasmic reticulum. Mol. Biol. Cell 6, 945–951. [DOI] [PMC free article] [PubMed] [Google Scholar]
- Lechleiter JD, and Clapham DE (1992). Molecular mechanisms of intra-cellular calcium excitability in X. laevis oocytes. Cell 69, 283–294. [DOI] [PubMed] [Google Scholar]
- Matsu-ura T, Michikawa T, Inoue T, Miyawaki A, Yoshida M, and Mikoshiba K (2006). Cytosolic inositol 1,4,5-trisphosphate dynamics during intracellular calcium oscillations in living cells. J. Cell Biol 173, 755–765. [DOI] [PMC free article] [PubMed] [Google Scholar]
- Meyer T, and Stryer L (1988). Molecular model for receptor-stimulated calcium spiking. Proc. Natl. Acad. Sci. USA 85, 5051–5055. [DOI] [PMC free article] [PubMed] [Google Scholar]
- Osipchuk YV, Wakui M, Yule DI, Gallacher DV, and Petersen OH (1990). Cytoplasmic Ca2+ oscillations evoked by receptor stimulation, G-protein activation, internal application of inositol trisphosphate or Ca2+: simultaneous microfluorimetry and Ca2+ dependent Cl- current recording in single pancreatic acinar cells. EMBO J 9, 697–704. [DOI] [PMC free article] [PubMed] [Google Scholar]
- Politi A, Gaspers LD, Thomas AP, and Höfer T (2006). Models of IP3 and Ca2+ oscillations: frequency encoding and identification of underlying feedbacks. Biophys. J 90, 3120–3133. [DOI] [PMC free article] [PubMed] [Google Scholar]
- Rooney TA, Sass EJ, and Thomas AP (1989). Characterization of cytosolic calcium oscillations induced by phenylephrine and vasopressin in single fura-2-loaded hepatocytes. J. Biol. Chem 264, 17131–17141. [PubMed] [Google Scholar]
- Rooney TA, Sass EJ, and Thomas AP (1990). Agonist-induced cytosolic calcium oscillations originate from a specific locus in single hepatocytes. J. Biol. Chem 265, 10792–10796. [PubMed] [Google Scholar]
- Sneyd J, Tsaneva-Atanasova K, Reznikov V, Bai Y, Sanderson MJ, and Yule DI (2006). A method for determining the dependence of calcium oscillations on inositol trisphosphate oscillations. Proc. Natl. Acad. Sci. USA 103, 1675–1680. [DOI] [PMC free article] [PubMed] [Google Scholar]
- Tanimura A, Morita T, Nezu A, Shitara A, Hashimoto N, and Tojyo Y (2009). Use of Fluorescence Resonance Energy Transfer-based Biosensors for the Quantitative Analysis of Inositol 1,4,5-Trisphosphate Dynamics in Calcium Oscillations. J. Biol. Chem 284, 8910–8917. [DOI] [PMC free article] [PubMed] [Google Scholar]
- Thomas AP, Bird GS, Hajnóczky G, Robb-Gaspers LD, and Putney JW Jr. (1996). Spatial and temporal aspects of cellular calcium signaling. FASEB J 10, 1505–1517. [PubMed] [Google Scholar]
- Thurley K, and Falcke M (2011). Derivation of Ca2+ signals from puff properties reveals that pathway function is robust against cell variability but sensitive for control. Proc. Natl. Acad. Sci. USA 108, 427–432. [DOI] [PMC free article] [PubMed] [Google Scholar]
- Várnai P, and Balla T (1998). Visualization of phosphoinositides that bind pleckstrin homology domains: calcium- and agonist-induced dynamic changes and relationship to myo-[3H]inositol-labeled phosphoinositide pools. J. Cell Biol 143, 501–510. [DOI] [PMC free article] [PubMed] [Google Scholar]
- Wakui M, Potter BV, and Petersen OH (1989). Pulsatile intracellular calcium release does not depend on fluctuations in inositol trisphosphate concentration. Nature 339, 317–320. [DOI] [PubMed] [Google Scholar]
- Woods NM, Cuthbertson KS, and Cobbold PH (1986). Repetitive transient rises in cytoplasmic free calcium in hormone-stimulated hepatocytes. Nature 319, 600–602. [DOI] [PubMed] [Google Scholar]
- Yoshikawa F, Morita M, Monkawa T, Michikawa T, Furuichi T, and Mikoshiba K (1996). Mutational analysis of the ligand binding site of the inositol 1,4,5-trisphosphate receptor. J. Biol. Chem 271, 18277–18284. [DOI] [PubMed] [Google Scholar]
- Zhao Y, Araki S, Wu J, Teramoto T, Chang YF, Nakano M, Abdelfattah AS, Fujiwara M, Ishihara T, Nagai T, and Campbell RE (2011). An expanded palette of genetically encoded Ca2⁺ indicators. Science 333, 1888–1891. [DOI] [PMC free article] [PubMed] [Google Scholar]
Associated Data
This section collects any data citations, data availability statements, or supplementary materials included in this article.