

Summary
Objective
Evidence of the association between childhood obesity and neighbourhood crime is inconclusive. Most previous studies have included children of all ages, and few have examined different types of crime. The objective of this study was to investigate the association between obesity and eight different types of crime (i.e. commercial robbery, street robbery, assault, other violence, commercial break and enter, residential break and enter, theft of vehicle and theft from vehicle) among 4‐ to 7‐year‐old children in a large western Canadian city.
Methods
Cross‐sectional, epidemiological study (N = 10,069) using spatial analysis and hierarchical generalized linear modelling. The outcome variable was normal weight or obesity. The exposure variable was the distance between the child's residential postal code and the closest occurrence of each type of crime.
Results
Controlling for distance to the closest park, frequency of each type of crime in the child's neighbourhood and neighbourhood factors (proportion of visible minorities, education and median family income), there was no association between any of the crime types and childhood obesity.
Conclusions
Crime did not contribute to obesity in this sample of 4‐ to 7‐year‐old children. Replication of this study in other jurisdictions would increase confidence in these results.
Keywords: Children, crime, neighbourhood, obesity
Introduction
Childhood obesity is a serious public health concern in much of the developed world 1. In Canada, 31% of children and youth are affected by overweight or obesity based on World Health Organization (WHO) body mass index (BMI) cut‐offs, an increase of 12% over the past four decades 2. Childhood obesity has health consequences that last well into adulthood; these include high blood pressure, type 2 diabetes, hyperlipidaemia, non‐alcoholic fatty liver disease, polycystic ovarian syndrome, asthma and obstructive sleep apnoea 3, 4, 5. Social–emotional issues, such as depression, anxiety, low self‐esteem, behaviour problems and stigmatization, are also a concern 5, 6.
Historically, diet and physical activity have been a major focus of research; however, there is increasing evidence that multiple factors contribute to childhood obesity 4. Recently, the role of the built environment has received greater attention in research 7, 8. The built environment encompasses ‘the physical infrastructure (e.g., buildings, roads, and lighting) and outdoor spaces (e.g., parks and urban design) of a place, as well as the policies that shape them’ (9, p., 750). Accessibility to parks and green spaces for physical activity is one factor of the built environment that may be related to childhood obesity; however, as demonstrated by several published literature reviews, research in this area has produced mixed results 7, 8, 10.
Childhood obesity is associated with various socioeconomic status (SES) indicators 11; thus, inconsistent findings may be due, in part, to the impact of individual and neighbourhood level SES factors. For example, among third to fifth grade children (N = 13,469) from south‐eastern USA, the association between availability of play spaces and BMI was moderated by child gender, ethnicity and SES 12. Among 4‐ to 18‐year‐old children (N = 44,810) from Massachusetts, neighbourhood SES was a stronger contributor to BMI than food and physical activity environments for children who were Black or Hispanic 13. Availability of neighbourhood parks and playgrounds was associated with decreased risk of overweight and obesity in a nationally representative sample of 10‐ to 17‐year‐old children (N = 44,015) in the USA 14. Furthermore, this association was stronger for children from low‐income families and those living in neighbourhoods perceived as unsafe compared with children from higher income families and safe neighbourhoods 14.
Neighbourhood crime, which is shaped by both physical infrastructure and social policies, is another aspect of the built environment that has been identified as a potential contributor to childhood obesity 9. In neighbourhoods perceived to be unsafe, parents may limit children's outdoor play and increase time spent engaging in sedentary activities 15, consequently increasing risk of overweight and obesity 16, 17. However, perceived safety and fear of crime may not accurately reflect actual safety and objective crime rates, as they are influenced by many individual, social and environmental factors 18.
In a systematic review of 18 studies examining the link between objectively measured crime rates and BMI or odds of overweight/obesity in children and adults, eight studies found a positive association, and 10 found no association 19. The authors of this review sought to explore the differential effects of two types of crime, violent or property, on obesity, but this classification provided limited insight because few studies reported property crime. A systematic review and meta‐analysis of 22 longitudinal studies identified that while living in unsafe neighbourhoods was associated with a significant, although trivial, increase in BMI z‐scores, there was no association with risk of childhood overweight or obesity 20. Only six of the included studies used an objective measure of neighbourhood safety. In the majority of studies, children of all ages were included, and most were school age. However, independence and, consequently, potential exposure to crime vary greatly between younger children and adolescents. Thus, data regarding the association between crime and obesity particularly among younger children are limited.
Evidence of the association between childhood obesity and neighbourhood crime is inconclusive and hampered by methodological weaknesses of previous studies, including the use of administratively derived boundaries and inadequate measures of crime (e.g. perceived crime, violent crime rate data only or overall crime rates rather than rates of specific types of crime). Additionally, numerous previous studies have used continuous BMI rather than applying a weight classification system to define obesity in children; this is problematic because unlike in adults, BMI cut‐offs for overweight and obesity in children vary by age and sex 21, 22. BMI of growing children must always be compared with appropriate reference standards in order to be meaningful. This study addressed the previously mentioned methodological gaps by measuring proximity to crime using actual rates of eight different types of crime and using WHO reference standards 21, 22 to define obesity. The research question was, what is the association between crime and obesity in 4‐ to 7‐year‐old children after controlling for (a) distance to the closest park, (b) frequency of each type of crime in the neighbourhood and (c) neighbourhood factors (proportion of visible minorities, education and median family income)?
Methods
This cross‐sectional study used administrative crime and child BMI data collected in 2011 in the large western Canadian city of Calgary, Alberta. Spatial analysis and hierarchical generalized linear modelling were used to investigate the association between distance to crime and obesity in a population‐based sample of 4‐ to 7‐year‐old children. The University of Calgary Conjoint Health Research Ethics Board approved the study (ID 13‐0621).
Canada has a publicly funded healthcare system, and in Alberta, public health nurses conduct well‐child surveillance and provide vaccinations. The child BMI data utilized in this study were collected as part of these public health clinic visits. In 2011, Calgary had a population of 1,096,833, with a population density of 1,329 per square kilometre 23. In the 2011 National Household Survey 24, 67.4% of adults living in Calgary reported having completed some form of postsecondary education, compared with 59.6% nationally, and 10.9% of the population was living with low income, compared with 14.9% nationally. Almost one‐third of the Calgary population (30.1%) identified as members of visible minorities 24, defined by Statistics Canada as ‘persons, other than Aboriginal peoples, who are non‐Caucasian in race or non‐white in colour 25’.
Data sets for the study included (a) 2011 crime data for the City of Calgary with postal codes indicating where the crime occurred; (b) 2011 BMI data for 4‐ to 7‐year‐old children seen in public health clinics in Calgary with their residential postal codes; (c) 2006 Canadian Census data for the three theoretically derived neighbourhood‐level covariates, that is, proportion of visible minorities, median family income and education (proportion with a university degree); and (d) locations of Calgary parks.
There are important differences between the Canadian postal code system and the US zip code system, most notably in the land area covered by a single postal code or zip code. For example, the city of Calgary has over 10,000 unique postal codes; in comparison, San Diego, a city of comparable population and even larger land area, has only 79 zip codes. Postal codes in large cities commonly cover areas of only a few blocks, sometimes even a single block or a single building. The use of Canadian postal codes thus allows for a much finer level of geographic resolution than is possible with US zip codes. In urban areas, the latitude and longitude assigned to postal codes closely approximate the location of residential addresses, with a median distance between the two of 160 m for ordinary households and 110 m for large apartment buildings 26.
Crime data
Crime data, prepared by Calgary Police Service, contained four types of person crime (commercial robbery, street robbery, assault and other violence) and four types of property crime (residential break and enter, commercial break and enter, theft of vehicle and theft from vehicle). Assault included aggravated assault, unlawfully causing bodily harm, discharging a firearm with intent, using a firearm and criminal negligence causing bodily harm. Other violence included murder, manslaughter, attempted murder, kidnapping, forcible confinement and uttering threats. Crimes that involved multiple violations were categorized by the most serious violation. Calgary Police Service excluded (a) disorder crimes because few had a postal code and (b) domestic crime, including domestic assault and domestic violence.
Body mass index data
Body mass index data were derived from the Alberta Health Services, Calgary Zone well‐child surveillance data set. No identifying information was included in the BMI data set. Children were 4 to 7 years old when a public health nurse, as part of a vaccination clinic visit, took height and weight measurements. Nurses followed strict protocols for measurement and calibration of equipment. They measured weight including clothing but not shoes and measured height without shoes. Nurses did not measure children if they were late for the appointment or uncooperative, had a disability that made height or weight measurements difficult, had implements such as a cast or parents refused.
Creating the body mass index and crime data set
To create the final data set, BMI and crime data were mapped in ArcGIS version 10.3.1 (computer software; http://desktop.arcgis.com) by using the national Postal Code Conversion File (available by request from Statistics Canada; https://www.statcan.gc.ca) to assign each BMI and crime data point the latitude and longitude associated with its postal code. Using the 2011 City of Calgary Community Boundary layer file (available from https://data.calgary.ca), only the BMI data points that fell within the City of Calgary boundaries were selected. The final sample consisted of 10,069 children who lived in Calgary and had postal codes that could be geocoded for 2011 (Figure 1). There was no significant difference in BMI between children retained in the final data set and those deleted.
Figure 1.
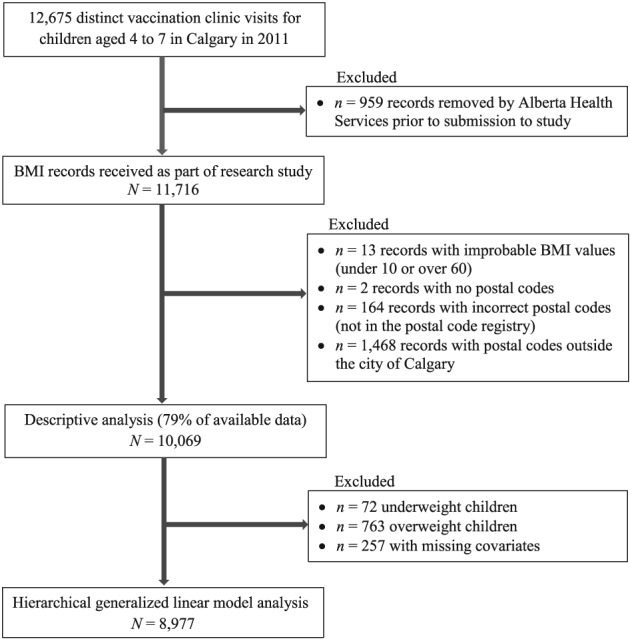
Sample inclusion flow diagram for body mass index (BMI) data.
The mapped BMI and crime data were used to calculate straight‐line distance between each child's postal code and the closest occurrence of each type of crime. Straight‐line distance was calculated because the impact of crime is expected to be based on proximity to crime rather than travel along a road network. Straight‐line distance was also calculated for the distance to the closest park covariate, because straight‐line distance is equivalent to driving distance for 90% of the population when considering non‐emergency travel in urban areas 27. The Join Attribute function in ArcGIS was used to attach 2006 Canadian Census data to each child's record based on the neighbourhood in which the child's postal code was located.
Childhood obesity classification
In Canada, WHO Child Growth Standards 21 are recommended for monitoring growth and BMI of children up to age 5 years, and WHO Growth References 22 are recommended for children and adolescents ages 5 to 19 28. These reference standards provide age‐adjusted and sex‐adjusted BMI cut‐offs for defining weight status based on BMI z‐scores, or standard deviation (SD) scores. BMI z‐scores for the study sample were generated using macros available from WHO (http://www.who.int/childgrowth/software/en/), and child weight status was categorized as underweight, normal, overweight or obesity according to WHO definitions. In accordance with WHO Child Growth Standards 21, for children between 4 years and 6 months and 5 years and 0 months (comprising 65.6% of the sample), overweight was defined as z‐score between +2 and +3 and obesity as z‐score above +3. In accordance with WHO Growth References 22, for children between 5 years and 1 month and 7 years and 0 months, overweight was defined as z‐score between +1 and +2 and obesity as z‐score above +2. Underweight was defined as z‐score below −2 for all ages. Although BMI z‐scores are adjusted for age and sex, due to overweight and obesity being defined differently in the two age groups, categorizing weight status was more appropriate than using continuous z‐scores in analyses.
Statistical analysis
The Spatial Autocorrelation (Global Moran's I) tool in ArcGIS was used to test for spatial dependence of child weight classification (Moran's I = 0.01, p = 0.23), and in its absence analyses proceeded with non‐spatial multilevel modelling. Considering that obesity has more consequences to health than overweight, and the objective of the study was related specifically to obesity, only children of normal weight and children with obesity were included in hierarchical generalized linear models. Thus, 763 overweight and 72 underweight children (8.3% of the sample) were excluded. An additional 257 children were excluded due to missing covariates, for a total sample of 8,977 in regression models.
The outcome variable in the eight models was normal weight (reference classification) or obesity. The exposure variable was distance, in kilometres, between the child's residential postal code and one of eight types of crime. Five covariates were controlled for (a) distance between the child's residential postal code and the closest park (in kilometres); (b) total number of occurrences of each crime type in the child's neighbourhood; (c) neighbourhood proportion of visible minorities; (d) neighbourhood proportion of university degree educated residents; and (e) neighbourhood median family income (in quantiles). Thus, weight classification was the child level outcome (level 1), and there were two postal code level variables (level 2) and four neighbourhood level variables (level 3). The linearity assumption was met, and no interactions or multicollinearity were found among the covariates. All hierarchical generalized linear modelling analyses were conducted using StataIC 14, with significance set at p < 0.01 after Bonferroni correction to adjust for multiple comparisons.
Results
Descriptive statistics
Of the 10,069 children, 48.8% were girls and 51.2% were boys. The children were on average about 5 years old (M = 4.99, SD = 0.56, range 4.5 to 7.0 years) with a mean BMI of 15.84 kg m−2 (SD = 1.73; range 11.08 to 38.44 for boys, 10.76 to 29.13 for girls). Using WHO classification, the proportion of underweight children was small and about 0.7% for both boys and girls; however, more boys were affected by obesity (4.5%) compared with girls (2.8%). See Table 1 for child weight status classification according to WHO 21, 22 and International Obesity Task Force (IOTF) 29 cut‐offs. The average neighbourhood family income was $87,670 CAD per year (SD = $24,860 CAD), with 37.4% of residents having a university degree (SD = 14.8%) and 26.4% being a visible minority (SD = 17.2%).
Table 1.
Weight status of children in the sample according to WHO and IOTF classification (N = 10,069)
| Boys (n = 5,151) | Girls (n = 4,918) | |
|---|---|---|
| Weight status | n (%) | n (%) |
| WHO | ||
| Underweight | 38 (0.74) | 34 (0.69) |
| Normal | 4,451 (86.41) | 4,416 (89.79) |
| Overweight | 432 (8.39) | 331 (6.73) |
| Obesity | 230 (4.47) | 137 (2.79) |
| IOTF | ||
| Underweighta | 96 (1.86) | 108 (2.20) |
| Normal | 4,368 (84.80) | 4,142 (84.22) |
| Overweight | 473 (9.18) | 479 (9.74) |
| Obesity | 214 (4.16) | 189 (3.84) |
Defined by IOTF thinness grade 2 cut‐off.
IOTF, International Obesity Task Force; WHO, World Health Organization.
Hierarchical generalized linear models
Distance to neighbourhood crime did not contribute significantly to the rate of childhood obesity in any of the models (Table 2). Childhood obesity increased as the proportion of neighbourhood visible minorities increased in all eight crime models and decreased as neighbourhood income increased in most models. Distance to the closest park, total number of crimes in the neighbourhood and neighbourhood proportion of university degree educated residents did not contribute to childhood obesity in any of the models. The chi‐square contribution of the likelihood ratio test was very small, indicating that random effects were not significant in any of the models. That is, there was not enough variability between postal codes or neighbourhoods to influence obesity. Given the lack of association between any type of neighbourhood crime and normal weight versus obesity, the models were ran again using ordinal categorization (normal weight, overweight and obesity); the results were unchanged.
Table 2.
Hierarchical generalized linear models for eight types of crime
| Crime type | Variable | Odds ratio | 95% CI | p‐value | |
|---|---|---|---|---|---|
|
Commercial robbery n = 261 Number per 1,000 people = 0.24 |
Fixed effects | Distance to commercial robbery | 1.02 | [0.86, 1.22] | 0.82 |
| Distance to park | 1.27 | [0.39, 4.16] | 0.69 | ||
| Total commercial robbery | 1.01 | [0.96, 1.06] | 0.72 | ||
| Visible minority | 3.33 | [1.76, 6.28] | <0.01* | ||
| University education | 0.36 | [0.12, 1.11] | 0.07 | ||
| Income | |||||
| 2nd quantile | 0.77 | [0.56, 1.05] | 0.10 | ||
| 3rd quantile | 0.73 | [0.49, 1.08] | 0.12 | ||
| 4th quantile | 0.46 | [0.28, 0.75] | <0.01* | ||
| 5th quantile | 0.47 | [0.28, 0.80] | 0.01* | ||
| Random effects | LR test vs. logistic model | χ2 = 0.04 | |||
|
Street robbery n = 313 Number per 1,000 people = 0.29 |
Fixed effects | Distance to street robbery | 0.96 | [0.85, 1.07] | 0.45 |
| Distance to park | 1.35 | [0.41, 4.42] | 0.62 | ||
| Total street robbery | 1.01 | [0.98, 1.04] | 0.62 | ||
| Visible minority | 3.08 | [1.61, 5.87] | <0.01* | ||
| University education | 0.34 | [0.11, 1.05] | 0.06 | ||
| Income | |||||
| 2nd quantile | 0.79 | [0.57, 1.09] | 0.15 | ||
| 3rd quantile | 0.80 | [0.52, 1.24] | 0.32 | ||
| 4th quantile | 0.52 | [0.31, 0.87] | 0.01 | ||
| 5th quantile | 0.52 | [0.30, 0.89] | 0.02 | ||
| Random effects | LR test vs. logistic model | χ2 = 0.02 | |||
|
Assault n = 2,103 Number per 1,000 people = 1.93 |
Fixed effects | Distance to assaults | 1.05 | [0.69, 1.58] | 0.83 |
| Distance to park | 1.26 | [0.39, 4.11] | 0.70 | ||
| Total assaults | 1.00 | [1.00, 1.01] | 0.12 | ||
| Visible minority | 3.19 | [1.69, 6.00] | <0.01* | ||
| University education | 0.30 | [0.10, 0.97] | 0.04 | ||
| Income | |||||
| 2nd quantile | 0.82 | [0.60, 1.14] | 0.24 | ||
| 3rd quantile | 0.80 | [0.54, 1.20] | 0.29 | ||
| 4th quantile | 0.52 | [0.32, 0.85] | 0.01 | ||
| 5th quantile | 0.53 | [0.30, 0.94] | 0.03 | ||
| Random effects | LR test vs. logistic model | χ2 = 0.01 | |||
|
Other violence n = 1,053 Number per 1,000 people = 0.97 |
Fixed effects | Distance to other violence | 0.74 | [0.46, 1.19] | 0.22 |
| Distance to park | 1.34 | [0.41, 4.38] | 0.63 | ||
| Total violence | 1.00 | [0.99, 1.02] | 0.62 | ||
| Visible minority | 3.16 | [1.66, 6.03] | <0.01* | ||
| University education | 0.40 | [0.13, 1.24] | 0.11 | ||
| Income | |||||
| 2nd quantile | 0.78 | [0.57, 1.07] | 0.12 | ||
| 3rd quantile | 0.77 | [0.52, 1.13] | 0.18 | ||
| 4th quantile | 0.49 | [0.31, 0.79] | <0.01* | ||
| 5th quantile | 0.51 | [0.30, 0.87] | 0.01 | ||
| Random effects | LR test vs. logistic model | χ2 = 0.07 | |||
|
Residential break and enter n = 3,164 Number per 1,000 people = 2.90 |
Fixed effects | Distance to residential break and enter | 0.76 | [0.34, 1.69] | 0.50 |
| Distance to park | 1.27 | [0.39, 4.13] | 0.69 | ||
| Total residential break and enter | 1.00 | [0.99, 1.01] | 0.46 | ||
| Visible minority | 3.39 | [1.78, 6.45] | <0.01* | ||
| University education | 0.33 | [0.10, 1.09] | 0.07 | ||
| Income | |||||
| 2nd quantile | 0.75 | [0.55, 1.02] | 0.07 | ||
| 3rd quantile | 0.70 | [0.48, 1.03] | 0.07 | ||
| 4th quantile | 0.46 | [0.29, 0.72] | <0.01* | ||
| 5th quantile | 0.46 | [0.28, 0.77] | <0.01* | ||
| Random effects | LR test vs. logistic model | χ2 = 0.10 | |||
|
Commercial break and enter n = 1,923 Number per 1,000 people = 1.76 |
Fixed effects | Distance to commercial break and enter | 1.34 | [0.91, 1.97] | 0.15 |
| Distance to park | 1.31 | [0.40, 4.30] | 0.65 | ||
| Total commercial break and enter | 1.01 | [1.00, 1.02] | 0.12 | ||
| Visible minority | 3.26 | [1.75, 6.05] | <0.01* | ||
| University education | 0.31 | [0.10, 0.98] | 0.05 | ||
| Income | |||||
| 2nd quantile | 0.78 | [0.57, 1.07] | 0.12 | ||
| 3rd quantile | 0.73 | [0.50, 1.07] | 0.11 | ||
| 4th quantile | 0.45 | [0.28, 0.71] | <0.01* | ||
| 5th quantile | 0.48 | [0.28, 0.82] | 0.01 | ||
| Random effects | LR test vs. logistic model | χ2 = 0.00 | |||
|
Theft of vehicle n = 2,890 Number per 1,000 people = 2.65 |
Fixed effects | Distance to theft of vehicle | 1.30 | [0.73, 2.30] | 0.37 |
| Distance to park | 1.24 | [0.38, 4.02] | 0.72 | ||
| Total theft of vehicle | 1.00 | [1.00, 1.01] | 0.91 | ||
| Visible minority | 3.42 | [1.74, 6.72] | <0.01* | ||
| University education | 0.33 | [0.10, 1.04] | 0.06 | ||
| Income | |||||
| 2nd quantile | 0.75 | [0.54, 1.04] | 0.08 | ||
| 3rd quantile | 0.69 | [0.46, 1.04] | 0.08 | ||
| 4th quantile | 0.43 | [0.26, 0.70] | <0.01* | ||
| 5th quantile | 0.44 | [0.25, 0.75] | <0.01* | ||
| Random effects | LR test vs. logistic model | χ2 = 0.10 | |||
|
Theft from vehicle n = 7,570 Number per 1,000 people = 6.94 |
Fixed effects | Distance to theft from vehicle | 1.45 | [0.55, 3.84] | 0.45 |
| Distance to park | 1.28 | [0.39, 4.14] | 0.68 | ||
| Total theft of vehicle | 1.00 | [1.00, 1.00] | 0.79 | ||
| Visible minority | 3.37 | [1.78, 6.40] | <0.01* | ||
| Parental university degree | 0.35 | [0.11, 1.10] | 0.07 | ||
| Income | |||||
| 2nd quantile | 0.74 | [0.54, 1.02] | 0.07 | ||
| 3rd quantile | 0.70 | [0.48, 1.03] | 0.07 | ||
| 4th quantile | 0.45 | [0.29, 0.70] | <0.01* | ||
| 5th quantile | 0.46 | [0.27, 0.76] | <0.01* | ||
| Random effects | LR test vs. logistic model | χ2 = 0.03 | |||
p < 0.01.
City of Calgary census population of 1,090,936 in 2011. CI, confidence interval.
Discussion
This large study of 4‐ to 7‐year‐old western Canadian children found no association between childhood obesity and eight different types of objectively measured neighbourhood crime after controlling for distance to the closest park, frequency of type of crime in the neighbourhood and neighbourhood factors (proportion of visible minorities, education and family income). The distance from the child's residence to the closest park did not contribute to obesity. Increased proportions of visible minorities in a neighbourhood contributed to increased childhood obesity, while higher neighbourhood family income contributed to decreased childhood obesity.
The proportion of children with obesity in the current study was lower than Canadian estimates 30. Using WHO classification, 4.5% of boys and 2.8% of girls in this sample had obesity; using IOTF classification, 4.2% of boys and 3.8% of girls had obesity. In a nationally representative sample with data collected between 2009 and 2011, 19.6% of boys and 6.3% of girls age 5 to 11 in Canada were affected by obesity according to WHO classification; the sample size for children under 5 years of age was too small to produce reliable estimates using WHO classification 30. Using IOTF classification, 6.2% of 3‐ to 5‐year‐old Canadian children had obesity; similarly, the sample size was too small to produce reliable estimates for boys and girls separately 30. Although this study's sample was not directly comparable with the Canadian sample in terms of age categories, the proportion of children with obesity was lower than national averages. Rates of childhood obesity in Canada vary by age, sex, SES and place of residence, with urban parts of Alberta having one of the lowest rates in the country 2.
The current study focused on a narrow age group of children. Previous reviews that reported equivocal associations between childhood obesity and crime or perceived safety 19, 20 may have been limited by including studies of all children under the age of 18 years. Given that rates of obesity have been shown to increase through childhood and adolescence in both the USA 31 and Canada 2, combining groups of children across ages may increase the risk of spurious results. Furthermore, many studies of the association between childhood obesity and neighbourhood crime or perceived safety report continuous BMI or BMI z‐scores rather than applying a weight classification system and reporting on risk of obesity 19, 20. Higher mean BMI or BMI z‐scores do not necessarily equate to higher proportions of children having obesity.
The current study is novel in the depth to which it examined crime. In contrast to previous research that treated crime as a single undifferentiated variable 9, 32, 33, 34 or simply used homicide as a proxy for all crime 35, 36, this study categorized crime into eight types. Previous studies have shown both a positive association between childhood obesity or BMI and neighbourhood crime rates 9, 34, 35, 37 and no association 32, 33, 36. Only two studies differentiated crime into two types. In a sample of fifth and sixth grade children (N = 1,048), BMI was associated with neighbourhood property crime; there was no association with violent crime 37. Among adolescents in sixth through 12th grades (N = 2,455), property crime and person crime were associated with higher BMI z‐scores in girls but not in boys 38. The results of previous studies are difficult to compare with the current study as most used a single measure of crime in administratively defined neighbourhoods. For the two studies that differentiated between two types of crime, the age groups were older than the sample of children in this study.
The current study used the distance between a child's residential postal code and location of actual crime committed. However, fear of crime sufficient to motivate behaviour change (i.e. preventing children from physical activity outdoors) may be more strongly influenced by perceived risk of becoming a victim of crime, vulnerability and seriousness of the consequences of victimization 18. The focus on children in this study also moves the discussion from personal fear of crime into altruistic fear, which is much more prevalent than personal fear 39. It is possible that for younger children, the association between crime and obesity is filtered through parental fear regarding their child's vulnerability to becoming a victim of crime. This is an important area of future study.
Childhood obesity is a complex health issue, with multiple influencing factors from many areas of a child's life 4. Although distance to the closest park and neighbourhood factors were controlled for in analyses, information regarding other factors that may influence obesity, such as physical activity, parental obesity, child and family sociodemographic characteristics, food choices and proximity to restaurants, were not available in the BMI data set. Canada has lower crime rates than the USA and many other countries 40, potentially limiting the generalizability of our results. The cross‐sectional nature of this study is also a limitation, as the effects of different types of neighbourhood crime on childhood obesity may be cumulative over time. Future longitudinal research would provide further insights by examining, for example, whether different types of crime exert differing temporal influences on child weight status. Precise measurement of BMI by public health nurses during vaccination clinic visits is a strength of this study. However, not all children attended these clinics, which may contribute to selection bias. Children who do not receive vaccinations may have lower SES or be from an ethnic minority 41.
This study used neighbourhood level census data as a proxy for individual level data regarding family income, proportion of visible minorities and education level. Neighbourhood level variables can change depending on how the boundaries of neighbourhoods are determined, referred to as the modifiable areal unit problem 42. It is the degree of homogeneity in an area that determines the degree to which the area level variables represent the individual level variables. For the City of Calgary, neighbourhoods are reasonable proxies for individual variables as neighbourhood boundaries were constructed based on social, historical and geographical criteria 43.
Based on the results of no associations between different types of crime and obesity in 4‐ to 7‐year‐old children, we conclude that other factors may make greater contributions to obesity in this age group. Given that higher neighbourhood proportions of visible minorities and lower neighbourhood income contributed to obesity, culturally relevant education targeting parents and preschool programmes in these neighbourhoods may decrease childhood obesity. Future research with children in younger age groups should consider the WHO age cut‐offs to simplify analyses. Replication of this study in other jurisdictions would increase confidence in these results. The inclusion in longitudinal studies of both objectively measured crime and altruistic fear of crime may help clarify the role, if any, each factor plays in childhood obesity.
Author contributions
K. B. made substantial contributions to the design of the work and interpretation of the data and critically revised versions of the manuscript. As part of her master's thesis, M. Y. made substantial contributions to the design of the work and acquisition of data, wrote early drafts of the work and critically revised the final draft. A. P. made substantial contributions to the design of the work, acquisition and interpretation of the data and drafted and critically revised sections of the manuscript. A. A. made substantial contributions to the analysis and interpretation of the data and critically revised sections of the manuscript. J. K. made substantial contributions to the interpretation of the data and drafted and critically revised later versions of the manuscript. D. M. made substantial contributions to the design of the work, acquisition and interpretation of the data and critically revised versions of the manuscript. All authors approved the final version to be published.
Conflict of Interest Statement
The authors declare no conflicts of interest.
Acknowledgements
The authors thank Calgary Police Service for preparing the crime data set and Alberta Health Services, Calgary Zone, for providing the well‐child surveillance data used to create the child BMI data set.
Benzies, K. M. , Yates, M. T. , Patel, A. B. , Afzal, A. R. , Kurilova, J. , and McNeil, D. A. (2019) Association between obesity in 4‐ to 7‐year‐old children and eight types of crime: a hierarchical linear modelling approach. Obesity Science & Practice, 5: 159–167. 10.1002/osp4.322.
References
- 1. Wang Y, Lim H. The global childhood obesity epidemic and the association between socio‐economic status and childhood obesity. Int Rev Psychiatr 2012; 24: 176–188. [DOI] [PMC free article] [PubMed] [Google Scholar]
- 2. Rao D, Kropac E, Do M, Roberts K, Jayaraman G. Childhood overweight and obesity trends in Canada. Health Promot Chronic Dis Prev Can 2016; 38: 194–198. [DOI] [PMC free article] [PubMed] [Google Scholar]
- 3. Kelsey MM, Zaepfel A, Bjornstad P, Nadeau KJ. Age‐related consequences of childhood obesity. Gerontology 2014; 60: 222–228. [DOI] [PubMed] [Google Scholar]
- 4. Sahoo K, Sahoo B, Choudhury AK, Sofi NY, Kumar R, Bhadoria AS. Childhood obesity: causes and consequences. J Family Med Prim Care 2015; 4: 187–192. [DOI] [PMC free article] [PubMed] [Google Scholar]
- 5. Pulgarón ER. Childhood obesity: a review of increased risk for physical and psychological comorbidities. Clin Ther 2013; 35: A18–A32. [DOI] [PMC free article] [PubMed] [Google Scholar]
- 6. Pizzi MA, Vroman K. Childhood obesity: effects on children's participation, mental health, and psychosocial development. Occup Ther Health Care 2013; 27: 99–112. [DOI] [PubMed] [Google Scholar]
- 7. Dunton GF, Kaplan J, Wolch J, Jerrett M, Reynolds KD. Physical environmental correlates of childhood obesity: a systematic review. Obes Rev 2009; 10: 393–402. [DOI] [PMC free article] [PubMed] [Google Scholar]
- 8. Casey R, Oppert J‐M, Weber C, et al. Determinants of childhood obesity: what can we learn from built environment studies? Food Qual Prefer 2014; 31: 164–172. [Google Scholar]
- 9. Miranda ML, Edwards SE, Anthopolos R, Dolinsky DH, Kemper AR. The built environment and childhood obesity in Durham, North Carolina. Clin Pediatr (Phila) 2012; 51: 750–758. [DOI] [PMC free article] [PubMed] [Google Scholar]
- 10. Carter MA, Dubois L. Neighbourhoods and child adiposity: a critical appraisal of the literature. Health Place 2010; 16: 616–628. [DOI] [PubMed] [Google Scholar]
- 11. Shrewsbury V, Wardle J. Socioeconomic status and adiposity in childhood: a systematic review of cross‐sectional studies 1990–2005. Obesity 2008; 16: 275–284. [DOI] [PubMed] [Google Scholar]
- 12. Morgan Hughey S, Kaczynski AT, Child S, Moore JB, Porter D, Hibbert J. Green and lean: is neighborhood park and playground availability associated with youth obesity? Variations by gender, socioeconomic status, and race/ethnicity. Prev Med 2017; 95: S101–S108. [DOI] [PubMed] [Google Scholar]
- 13. Sharifi M, Sequist TD, Rifas‐Shiman SL, et al. The role of neighborhood characteristics and the built environment in understanding racial/ethnic disparities in childhood obesity. Prev Med 2016; 91: 103–109. [DOI] [PMC free article] [PubMed] [Google Scholar]
- 14. Fan M, Jin Y. Do neighborhood parks and playgrounds reduce childhood obesity? Amer J Agr Econ 2014; 96: 26–42. [Google Scholar]
- 15. Datar A, Nicosia N, Shier V. Parent perceptions of neighborhood safety and children's physical activity, sedentary behavior, and obesity: evidence from a national longitudinal study. Am J Epidemiol 2013; 177: 1065–1073. [DOI] [PMC free article] [PubMed] [Google Scholar]
- 16. Borrell LN, Graham L, Joseph SP. Associations of neighborhood safety and neighborhood support with overweight and obesity in US children and adolescents. Ethn Dis 2016; 26: 469–476. [DOI] [PMC free article] [PubMed] [Google Scholar]
- 17. Cecil‐Karb R, Grogan‐Kaylor A. Childhood body mass index in community context: neighborhood safety, television viewing, and growth trajectories of BMI. Health Soc Work 2009; 34: 169–177. [DOI] [PubMed] [Google Scholar]
- 18. Farrall S, Gray E, Jackson J. Theorising the fear of crime: the cultural and social significance of insecurities about crime. Experience & expression in the fear of crime working paper no 5. SSRN 2007. Retrieved from https://papers.ssrn.com/sol3/papers.cfm?abstract_id=1012393
- 19. Yu E, Lippert AM. Neighborhood crime rate, weight‐related behaviors, and obesity: a systematic review of the literature. Sociol Compass 2016; 10: 187–207. [Google Scholar]
- 20. An R, Yang Y, Hoschke A, Xue H, Wang Y. Influence of neighbourhood safety on childhood obesity: a systematic review and meta‐analysis of longitudinal studies. Obes Rev 2017; 18: 1289–1309. [DOI] [PMC free article] [PubMed] [Google Scholar]
- 21. WHO Multicentre Growth Reference Study Group . WHO Child Growth Standards. Length/Height‐for‐Age, Weight‐for‐Age, Weight‐for‐Length, Weight‐for‐Height and Body Mass Index‐for‐Age: Methods and Development. World Health Organization: Geneva, 2006. Retrieved from https://www.who.int/childgrowth/standards/technical_report/en/. [Google Scholar]
- 22. de Onis M, Onyango AW, Borghi E, Siyam A, Nishida C, Siekmann J. Development of a WHO growth reference for school‐aged children and adolescents. Bull World Health Organ 2007; 85: 660–667. [DOI] [PMC free article] [PubMed] [Google Scholar]
- 23. Statistics Canada . Census Profile: Calgary, Alberta (Table, Statistics Canada Catalogue No. 98‐316‐XWE). 2011 Census. Government of Canada: Ottawa, 2012. Retrieved from http://www12.statcan.gc.ca/census‐recensement/2011/dp‐pd/prof/index.cfm?Lang=E. [Google Scholar]
- 24. Statistics Canada . National Household Survey Profile, Calgary City, Alberta, 2011 (Table, Statistics Canada Catalogue No. 99‐004‐XWE). Government of Canada: Ottawa, 2013. Retrieved from http://www12.statcan.gc.ca/nhs‐enm/2011/dp‐pd/prof/index.cfm?Lang=E. [Google Scholar]
- 25. Statistics Canada . Definitions, Data Sources and Methods – Visible Minority of Person. Government of Canada: Ottawa, 2015. Retrieved from http://www23.statcan.gc.ca/imdb/p3Var.pl?Function=DEC&Id=45152. [Google Scholar]
- 26. Khan S, Pinault L, Tjepkema M, Wilkins R. Positional accuracy of geocoding from residential postal codes versus full street addresses (Statistics Canada catalogue no. 82‐003‐X). Health Rep 2018; 29: 3–9. [PubMed] [Google Scholar]
- 27. Boscoe FP, Henry KA, Zdeb MS. A nationwide comparison of driving distance versus straight‐line distance to hospitals. Prof Geogr 2012; 64: 188–196. [DOI] [PMC free article] [PubMed] [Google Scholar]
- 28. Dietitians of Canada, Canadian Paediatric Society, The College of Family Physicians of Canada, Community Health Nurses of Canada . Promoting Optimal Monitoring of Child Growth in Canada: Using the New WHO Growth Charts. Dietitians of Canada: Toronto and Canadian Paediatric Society: Ottawa, 2010. Retrieved from https://www.dietitians.ca/Downloads/Public/tcg‐position‐paper.aspx. [DOI] [PubMed] [Google Scholar]
- 29. Cole T, Lobstein T. Extended international (IOTF) body mass index cut‐offs for thinness overweight and obesity. Pediatr Obes 2012; 7: 284–294. [DOI] [PubMed] [Google Scholar]
- 30. Roberts KC, Shields M, de Groh M, Aziz A, Gilbert JA. Overweight and obesity in children and adolescents: results from the 2009 to 2011 Canadian Health Measures Survey (Statistics Canada catalogue no. 82‐003‐XPE). Health Rep 2012; 23: 37–41. [PubMed] [Google Scholar]
- 31. Chen D, Thomsen MR, Nayga RM, Bennett JL. Persistent disparities in obesity risk among public schoolchildren from childhood through adolescence. Prev Med 2016; 89: 207–210. [DOI] [PubMed] [Google Scholar]
- 32. Grafova IB. Overweight children: assessing the contribution of the built environment. Prev Med 2008; 47: 304–308. [DOI] [PubMed] [Google Scholar]
- 33. Burdette HL, Whitaker RC. Neighborhood playgrounds, fast food restaurants, and crime: relationships to overweight in low‐income preschool children. Prev Med 2004; 38: 57–63. [DOI] [PubMed] [Google Scholar]
- 34. Oreskovic NM, Winickoff JP, Kuhlthau KA, Romm D, Perrin JM. Obesity and the built environment among Massachusetts children. Clin Pediatr (Phila) 2009; 48: 904–912. [DOI] [PubMed] [Google Scholar]
- 35. Lovasi GS, Schwartz‐Soicher O, Quinn JW, et al. Neighborhood safety and green space as predictors of obesity among preschool children from low‐income families in New York City. Prev Med Sep 2013; 57: 189–193. [DOI] [PMC free article] [PubMed] [Google Scholar]
- 36. Lovasi GS, Jacobson JS, Quinn JW, Neckerman KM, Ashby‐Thompson MN, Rundle A. Is the environment near home and school associated with physical activity and adiposity of urban preschool children? J Urban Health 2011; 88: 1143–1157. [DOI] [PMC free article] [PubMed] [Google Scholar]
- 37. Carroll‐Scott A, Gilstad‐Hayden K, Rosenthal L, et al. Disentangling neighborhood contextual associations with child body mass index, diet, and physical activity: the role of built, socioeconomic, and social environments. Soc Sci Med 2013; 95: 106–114. [DOI] [PMC free article] [PubMed] [Google Scholar]
- 38. Forsyth A, Wall M, Choo T, Larson N, Van Riper D, Neumark‐Sztainer D. Perceived and police‐reported neighborhood crime: linkages to adolescent activity behaviors and weight status. J Adolesc Health 2015; 57: 222–228. [DOI] [PMC free article] [PubMed] [Google Scholar]
- 39. Warr M, Ellison CG. Rethinking social reactions to crime: personal and altruistic fear in family households. Amer J Sociol 2000; 106: 551–578. [Google Scholar]
- 40. Harrendorf S, Heiskanen M, Malby S. (eds). International Statistics on Crime and Justice. HEUNI report series no. 64. European Institute for Crime Prevention and Control, affiliated with the United Nations (HEUNI): Helsinki, 2010. Retrieved from https://www.heuni.fi/material/attachments/heuni/reports/6KHnYYyK7/Hakapaino_final_07042010.pdf. [Google Scholar]
- 41. Wooten K, Luman E, Barker L. Socioeconomic factors and persistent racial disparities in childhood vaccination. Am J Health Behav 2007; 31: 434–445. [DOI] [PubMed] [Google Scholar]
- 42. Kwan M‐P. The uncertain geographic context problem. Ann Assoc Am Geogr 2012; 102: 958–968. [Google Scholar]
- 43. Gauvin L, Robitaille É, Riva M, McLaren L, Dassa C, Potvin L. Conceptualizing and operationalizing neighbourhoods: the conundrum of identifying territorial units. Can J Public Health 2007; 98: S18–S26. [DOI] [PMC free article] [PubMed] [Google Scholar]