

Abstract
The ε4 allele of the human apolipoprotein E gene (APOE) is a well-proven genetic risk factor for the late onset form of Alzheimer’s disease (AD). However, the biological mechanisms through which the ε4 allele contributes to disease pathophysiology are incompletely understood. The three common alleles of APOE, ε2, ε3 and ε4, are defined by two single nucleotide polymorphisms (SNPs) that reside in the coding region of exon 4, which overlaps with a well-defined CpG island (CGI). Both SNPs change not only the protein codon but also the quantity of CpG dinucleotides, primary sites for DNA methylation. Thus, we hypothesize that the presence of an ε4 allele changes the DNA methylation landscape of the APOE CGI and that such epigenetic alteration contributes to AD susceptibility. To explore the relationship between APOE genotype, AD risk, and DNA methylation of the APOE CGI, we applied bisulfite pyrosequencing and evaluated methylation profiles of postmortem brain from 15 AD and 10 control subjects. We observed a tissue-specific decrease in DNA methylation with AD and identified two AD-specific differentially methylated regions (DMRs), which were also associated with APOE genotype. We further demonstrated that one DMR was completely un-methylated in a sub-population of genomes, possibly due to a subset of brain cells carrying deviated APOE methylation profiles. These data suggest that the APOE CGI is differentially methylated in AD brain in a tissue-and APOE-genotype-specific manner. Such epigenetic alteration might contribute to neural cell dysfunction in AD brain.
Keywords: Alzheimer’s disease, apolipoprotein E, CGI, CpG island, DMR, DNA methylation, epigenetics, pyrosequencing
INTRODUCTION
Late onset Alzheimer’s disease (AD) is a devastating disorder that afflicts about one third of all people over the age of 85 in the United States. Inheritance of the ε4 allele of the apolipoprotein E gene (APOE) is the strongest known genetic risk factor for the late onset form of AD. Studies show that the presence of just one ε4 allele increases a person’s risk of developing AD by 3 to 4 fold compared to individuals without ε4 alleles [1]. While the biological consequences of the ε4 allele in AD are generally assumed to be from its encoded E4 protein isoform, the biological mechanisms through which the ApoE4 protein contributes to disease patho-physiology are incompletely understood. Furthermore, the presence of the APOE ε4 allele alone is neither sufficient nor necessary for the development of AD. Indeed, some individuals who inherit two copies of APOE ε4 alleles still manage to escape the disease. Therefore, it is plausible that additional intricate ε4 allele-related biological effects, involving mechanisms beyond ApoE protein function, contribute to the complex non-Mendelian disease etiology observed in AD.
The pathophysiology of AD is complex, encompassing many gene expression networks and pathogenic pathways. From a genetic standpoint, with the exception of amyloid-β production-related genes, none of the known genetic risk loci have high penetrance in causing AD, nor are any of them associated with multiple AD pathogenic pathways. Conversely, epigenetic modifications are capable of altering transcriptional activity in a comprehensive manner across multiple genes and biological pathways; and such alterations provide a means by which environmental factors (e.g., diet, hazardous exposures, and lifestyle) can influence phenotypic outcomes from subjects who inherit the same genetic variants. Additionally, there is a clear link between genetic sequence and epigenetic code. For example, certain single nucleotide polymorphisms (SNPs) can reshape cytosine-phosphate-guanine (CpG) dinucleotides; sites where methylation of the C nucleotide is a common epigenetic mark. These CpG-altering SNPs have the potential to modulate DNA methylation levels in either a cis or trans manner [2–4] as well as gene transcription at CpG-enriched regions known as CpG islands (CGI). Therefore, the relationship between genetic variants, epigenetics, and environment is coming to the forefront in the study of complex diseases [5, 6]. Indeed, epigenetic alterations have been implicated in multiple neurological disorders, including psychiatric disorders [7], autism [8], Parkinson’s disease [9, 10], and AD [11]. Thus, epigenetics has become a prime candidate for a point of intersection between a variety of genetic risk factors, such as the ε4 allele of APOE, and the pathophysiological process of AD.
Interestingly, the exon 4 region of APOE that encompasses the ε2/ε3/ε4 allele variants, is also a well-defined CGI [12]. Furthermore, the two ε2/ε3/ε4 allele-defining SNPs (rs429358 and rs7412) are both CpG-altering and amend the CpG content of this CGI. Previously, we have shown that this APOE CGI has transcriptional enhancer activity with ε4 allele-and cell-type-specificity. In this study, we evaluated the hypothesis that the ε4 allele alters the DNA methylation landscape of the APOE CGI and leads to an increased risk of AD. We examined APOE methylation levels in postmortem brain (PMB) tissues using bisulfite pyrosequencing. We provide evidence that the methylation profile of this CGI is altered in AD PMB with tissue-and APOE genotype-specificity.
MATERIALS AND METHODS
Human subjects, tissue collection, and nucleic acid processing
The use of human tissues in this study was approved by the human subject Institutional Review Board of the Veterans Affairs Puget Sound Health Care System. PMBs were obtained from the UW Alzheimer’s Disease Research Center with prior written consent from patients. Cerebellum, hippocampus, and frontal lobe were obtained and rapidly frozen at autopsy (<9.5 h) and stored at –80°C until use. For the AD group, subjects were originally diagnosed with probable AD in a clinical setting and subsequently diagnosed with definitive AD by neuropathological examination. Brains from AD patients exhibited Braak stages between V-VI whereas control subjects ranged between stages I-III with the exception of one control sample with a score of <V, which was conservatively interpreted as a stage IV. Average Braak stages in each group are given in Table 1. Although there was a larger proportion of males in the AD group compared to the Control group, this difference was not statistically significant (p = 0.087, 95%CI, Fisher’s Exact Test). Genomic DNA and whole cell RNA were isolated from frozen PMB using the AllPrep DNA/RNA Mini Kit (Qiagen, Valencia, CA) according to the manufacturer’s instructions. Nucleic acid concentrations were measured by NanoPhotometer (Implen, Westlake Village, CA), and samples were stored at –20°C prior to use.
Table 1.
Subject and tissue demographics
| Total (n = 25) | AD (n =15) | Control (n = 10) | |
|---|---|---|---|
| Age at death – Mean (SD) | 83.6 (9.0) | 82.7 (9.3) | 84.9 (8.9) |
| Postmortem interval (h) – Mean (SD) | 5:14 (2:19) | 5:45 (2:30) | 4:28 (1:52) |
| Gender – n Male/n Female (% Male) | 16/9 (64%) | 12/3 (80%) | 4/6 (40%) |
| Braak stage – Mean (SD) | 4.4 (1.6) | 5.6 (0.5) | 2.6 (0.8) |
| APOE ε3/ε3 – n | 10 | 5 | 5 |
| APOE ε3/ε4 – n | 10 | 5 | 5 |
| APOE ε4/ε4 – n | 5 | 5 | 0 |
| Cerebellum – n | 22 | 12 | 10 |
| Hippocampus – n | 24 | 15 | 9 |
| Frontal Lobe – n | 25 | 15 | 10 |
Bisulfite pyrosequencing
Quantification of DNA methylation levels by pyrosequencing was performed as previously reported [13]. Briefly, genomic DNA (500 ng each) was bisulfite converted using the EpiTect Bisulfite Kit (Qiagen). To evaluate the methylation status of the APOE CGI, we designed pyrosequencing assays to cover 76 CpG sites, starting with the 11th CpG of the CGI and ending with the 86th CpG (chr19:45411858 –45412560; hg19, Fig. 1B). Nine PCR primers and 17 sequencing primers (Supplementary Table 1) were designed using PyroMark Assay Design software version 2.0 (Qiagen). Primer design was complicated by the high GC content of this region, which hindered us from obtaining methylation data from the 3’ and 5’–ends of this CGI. PCR was performed on approximately 200 ng of bisulfite-converted DNA using PyroMark PCR kits (Qiagen) on a GeneAmp PCR System 9700 (Applied Biosystems, Grand Island, NY). Pyrosequencing was carried out on a PyroMark Q24 system (Qiagen) and data was analyzed using PyroMark Q24 software, version 2.0.6 (Qiagen). Bisulfite treatment controls were integrated as a quality control measure.
Fig. 1.
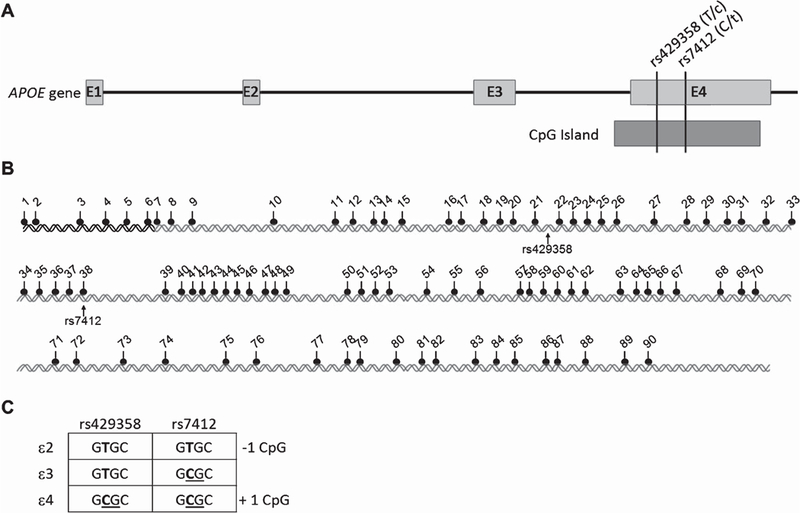
Schematic map of the human APOE gene, CGI, and ε2/ε3/ε4–defining SNPs. A) The APOE gene spans 3.7kb in the genome and contains four exons. Two non-synonymous SNPs within the exon 4 CGI (black bars) result in three common APOE alleles, ε2, ε3, and ε4. B) Map of the 90 CpG sites and the two critical SNPs within the CGI. C) The CpG content of the ε2/ε3/ε4 alleles. Compared to the ε3 allele, the ε2 allele abolishes one CpG site (on rs7412) and the ε4 allele obtains an additional CpG site (on rs429358).
Real time quantitative reverse transcription PCR (qRT-PCR)
We performed qRT-PCR as previously described [13]. Briefly, total RNA (2 μg) was reverse transcribed into cDNA by Superscript III reverse transcriptase (Life Technologies, Carlsbad, CA) with random primers. RNA expression levels were determined by real-time qPCR using TaqMan gene expression assays, TaqMan Universal PCR master mix, and a 7900 ABI real-time instrument (Applied Biosystems). TaqMan assays were used to quantify mRNA levels of human APOE and beta-actin (ACTB). Twenty-four independent frontal lobe samples were run in triplicate with ACTB as an endogenous control. Relative expression levels were determined by normalizing all samples to the lowest APOE expressing sample as determined by ΔCt (set at 1.0) using the ΔΔCt method.
Molecular cloning and Sanger sequencing
Frontal lobe tissue of subjects with APOE ε3/ε4 genotypes were selected for this experiment. Bisulfite converted genomic DNA was PCR amplified by bisulfite-specific primers (Supplementary Table 1) using HotStarTaq DNA PCR master mix (Qiagen) with a profile of 95°C for 15min, followed by 30 cycles of 95°C for 20 s, 50°C for 20 s, and 72°C for 1 min, ending with 72°C for 5 min. PCR fragments were purified using the NucleoSpin Gel and PCR Clean-Up kit (Clontech, Mountain View, CA) and were cloned into Xhol and Hindlll double-digested pGL4 vector (Promega, Madison, WI) using In-Fusion HD Cloning Plus kit (Clontech). The recombinant DNA was then transformed into Stellar competent cells (Clontech). A minimum of 19 clones from each sample were randomly selected and their inserts were PCR amplified using pGL4 vector-specific forward and reverse primers (Supplementary Table 1). PCR products were treated with ExoSAP-IT (Affymetrix, Santa Clara, CA) overnight at 37°C to remove the residual primers and deoxyribonucleotide triphosphates prior to sequencing. PCR fragments were sequenced by the pGL4_R1 primer (Supplementary Table 1) using BigDye Terminator v3.1 Cycle Sequencing Kit (Applied Biosystems) on a 3130xL Genetic Analyzer (Applied Biosystems). Sequences were analyzed by Sequencher software version 4.9 (Gene Codes Corp, Ann Arbor, Michigan).
Statistical analysis
Statistical analyses were performed using the Statistical Package for the Social Sciences (SPSS) version 13 (SPSS Inc., Chicago, IL). For each subject/tissue type/CpG site combination, we measured the percentage of methylated cytosines across 76 CpG sites of the APOE CGI. Subjects were treated as random effects whereas tissue type, CpG site, APOE genotype, and disease status were treated as fixed effects.
To compare overall percentages by disease status (AD versus control), we used a linear mixed effects model (Model 1) to account for repeated measures on a subject across CpG sites and across tissue types. This model included fixed effects for disease status, APOE genotype, CpG site, and tissue type, as well as all second-order interactions involving tissue to allow for the effects of disease status, APOE genotype, and CpG site to vary by tissue type. Variables for age and gender were also initially included as fixed effects but were found to have no significant main-effects; therefore, they were excluded from all subsequent analyses.
Next, to investigate the effect of disease status at each CpG site and determine differentially methylated regions (DMRs), we used a second linear mixed effects model (Model 2) that expanded Model 1 with the addition of a second-order interaction term for disease status by CpG site and a three-way interaction term for disease status by CpG site by tissue type that allowed the effect of disease status to vary by both CpG site and tissue type. A DMR was defined as a segment within the 76 CpG sites tested for which all sites within the DMR were parts of a moving average of a 10-CpG site window that maintained an average p-value of less than 0.05.
To evaluate the effect of the DMRs, percentage of DNA methylation was compared by disease status across APOE genotype and tissue type using a third linear mixed effects model (Model 3) that included fixed effects for disease status, APOE genotype, and tissue type, as well as all second-order interactions involving tissue (to allow for the effects of disease status and APOE genotype to vary by tissue type), as well as the second-order interaction term for disease status by APOE genotype and a three-way interaction term for disease status by APOE genotype by tissue type (to allow the effect of disease status to vary by both APOE genotype and tissue type).
It is important to note that we used linear mixed effects models to account for within-subject correlation. Percent methylation values at CpG sites within a subject are not independent and any statistical analyses that ignore these correlations will yield inflated Type I errors (i.e., tend to find an effect when none exists using conventional levels of significance) [14]. As a sensitivity analysis, all models were refit using the arcsine of the square root of the proportion of methylated cytosines as the response (dependent) variable to induce normality and homoscedasticity of the residuals [15]. This refitting test yielded similar results to the previous three models.
RESULTS
APOE CGI and CpG-altering SNPs that define the ε2/ε3/ε4 alleles
The entire genomic region of APOE contains a single well-defined CGI (UCSC Human Genome Browser, http://www.genome.ucsc.edu), which does not reside in the promoter region but overlaps with the last exon of the gene (Fig. 1A). This CGI spans from the 3’ end of intron 3 and extends to the 3’ untranslated region of exon 4. It consists of 880-base pairs with 90 CpG sites and houses both SNPs (rs429358 and rs7412) that define the ε2/ε3/ε4 alleles of APOE (Fig. 1B). These two SNPs directly affect the CpG content by either contributing or disrupting a single CpG site (Fig. 1C) in the APOE CGI.
DNA methylation levels of the APOE CGI are altered in AD PMB
We quantified DNA methylation levels at 76 CpG sites (CpGs #11–86, Fig. 1B), including rs7412 (CpG #38), across the APOE CGI in PMB tissues from 15 AD and 10 control subjects (Table 1). The APOE CGI was highly methylated (>50% methylated) at all CpG sites measured, which is consistent with our previous findings [13]. Additionally, our analyses confirmed that methylation of the APOE CGI differs significantly between brain tissues. The fitted percent methylation by tissue was calculated from statistical Model 1 (see Methods) and the highest levels of methylation were observed in the cerebellum (marginal mean = 93%, 95% CI [91.7, 94.9]), with moderately lower levels in the hippocampus (marginal mean = 85%, 95% CI [83.2, 86.4]), and the lowest levels in the frontal lobe (marginal mean = 77%, 95% CI [75, 78.1]). When stratified by disease status, mean percent methylation was significantly higher in controls compared to AD in both the hippocampus (Control – AD = 4.6, 95% CI [1.5, 7.7], p = 0.006) and frontal lobe (Control – AD = 6.0, 95% CI [2.9, 9.2], p = 0.001) but not the cerebellum (Control – AD = 0.0, 95% CI [–3.1, 3.1], p = 0.988) (Fig. 2). These data suggest that AD subjects have a reduced level of DNA methylation in the APOE CGI compared to age-matched controls, and such alterations only occur in regions of the brain that are profoundly impacted by AD pathophysiology.
Fig. 2.
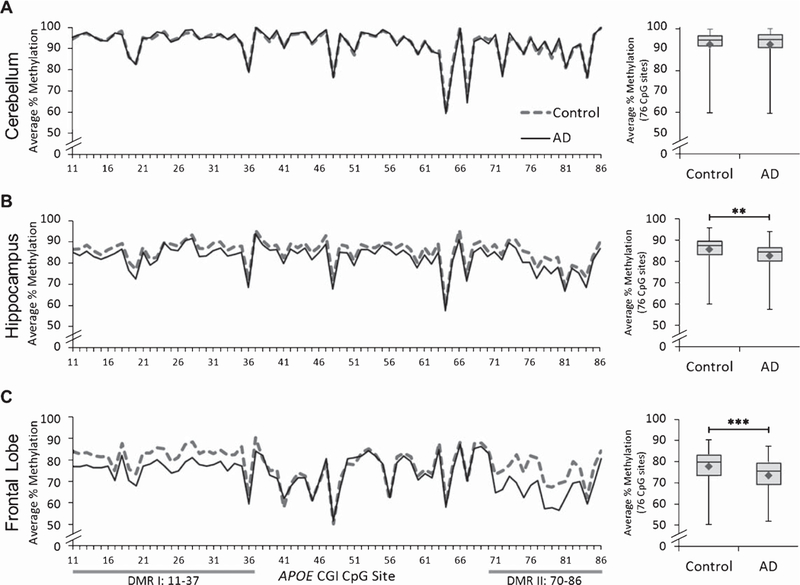
DNA methylation levels of the APOE CGI by AD status. Left panel: graphs depict the average percentage of DNA methylation for 15 AD and 10 control subjects from (A) cerebellum, (B) hippocampus, and (C) frontal lobe at each of the individual 76 CpG sites tested. Right panel: box and whisker plots depict the range (upper and lower bars) and mean (denoted by ♦) of DNA methylation average percentages from the same 76 CpG sites. The following p-values, point estimates, and 95% confidence intervals represent the effect of disease status (Control – AD) on percent methylation and are based on a linear mixed effects model (statistical Model 1 in the text). Cerebellum: p = 0.988,0.0 [–3.1, 3.1]; Hippocampus: **p = 0.006, 4.6 [1.5, 7.7]; Frontal lobe: ***p = 0.001, 6.0 [2.9, 9.2]. Gray bars represent AD-differentially methylated regions (DMRs) I and II.
AD-specific methylation changes are enriched in two DMRs
From our initial analysis, it was apparent that specific segments of the APOE CGI showed a larger separation of methylation levels between AD and control groups. In order to more precisely map these regions, we systematically analyzed the CGI for shorter stretches (a 10-CpG site window) of sequential CpG sites carrying the largest differences in methylation between AD and controls based on statistical Model 2 (see Methods). By scanning the 76 tested CpG sites, we identified two distinct DMRs within the frontal lobe. DMR I, located at the 5’ end of the CGI, harbors the rs429358 SNP (between CpG 21 and 22) and consists of 27 CpG sites (CpG 11–37). DMR II, located close to the 3’ end of the CGI, consists of 17 CpG sites (CpG 70–86) (Fig. 2 and Supplementary Figure 1). As expected in frontal lobe tissues, DNA methylation in these DMRs is significantly reduced in the AD group compared to controls (p<0.001) (Supplementary Figure 2). This trend was also observed in the hippocampus (DMR I, p = 0.007; DMR II, p = 0.035), but not in the cerebellum (DMRI,p = 0.944; DMRII, p = 0.907) (Supplementary Figure 2). These results suggest the presence of specific DMRs in the APOE CGI which contribute to the fundamental DNA methylation difference seen in these regions of the AD brain.
APOE genotype modulates DNA methylation levels at AD-specific DMRs
To determine whether the effect of disease status on DNA methylation can be modified by APOE genotype, we further stratified the methylation levels of the two DMRs by APOE genotypes ε3/3, ε3/ε4, and ε4/ε4 using statistical Model 3. Because the frontal lobe showed the largest methylation difference between AD and controls, we focused on this tissue alone for this analysis. In the control group, the ε3/ε4 subjects had significantly higher methylation levels compared to the ε3/ε3 subjects in both DMRs (p<0.001, Fig. 3), suggesting that presence of the ε4 allele is associated with increased DNA methylation levels of the DMRs in healthy controls. However, this trend was not observed in AD (except for ε3/ε4 versus ε4/ε4), suggesting an interaction between the ε4 allele and AD status that modifies the overall methylation of the APOE CGI. Notably, a significant difference between AD and control was observed within the ε3/ε4 group (DMR I, p<0.001, 13.4 [9.0, 17.7]; DMR II, p<0.001, 20.0 [13.6, 26.4]; Fig. 3) but not the ε3/ε3 group. This result suggests that the AD-specific methylation differences are mainly attributed to the ε3/ε4 heterozygous subjects.
Fig. 3.
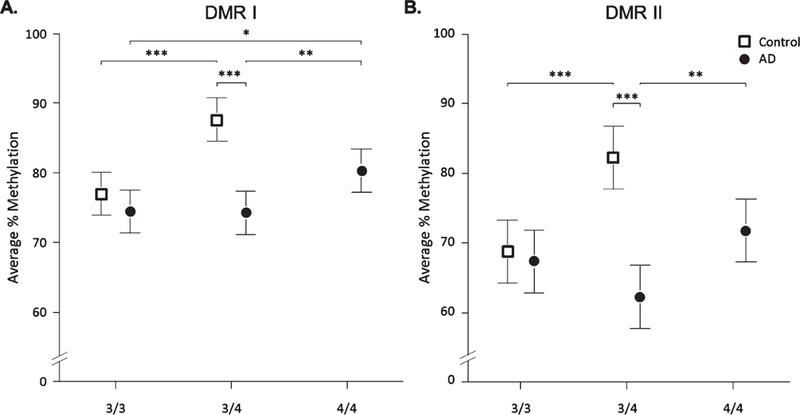
DNA methylation in DMRs by disease status and APOE genotype in the frontal lobe. For APOE CGI DMR I (A), and DMR II (B), average percentage of DNA methylation was compared between AD and control groups and by APOE genotype in frontal lobe tissue. Results are based on a linear mixed effects model (statistical Model 3 in the text). Points represent the fitted percent methylation across all CpG sites for that particular disease status/APOE genotype combination, and the bars denote 95% confidence intervals. In the control group, methylation in ε3/ε4 subjects was significantly higher compared to ε3 homozygotes (ε3/ε4 - ε3/ε3: DMR I, ***p <0.001, 10.6 [6.3, 15.0] and DMR II, ***p <0.001, 13.5 [7.1, 19.9]). Within the AD group, a significant increase in methylation was observed in ε4 homozygotes compared to all other genotypes in DMRI (ε4/ε4 - ε3/ε3, *p = 0.011, 5.9 [1.5, 10.3]; ε4/ε4 - ε3/ε4, **p = 0.008, 6.1 [1.7, 10.5]) and ε3/ε4 heterozygotes in DMR II (ε4/ε4 - ε3/ε4, **p = 0.005, 9.5 [3.1, 15.9]). DNA methylation was significantly higher in control subjects compared to AD subjects for individuals with ε3/ε4 APOE genotypes (DMR I, ***p <0.001, 13.4 [9.0, 17.7]; DMR II, ***p <0.001, 20.0 [13.6, 26.4]). No age-matched ε4/ε4 control samples were available for this study.
To determine if the observed methylation difference in DMRs might be due to the neuronal loss that occurs in the AD brain, we compared DNA methylation levels at 8 CpG sites within DMR I from cell lines of cerebral origin. Analyzing data from UCSC’s Encyclopedia of DNA Elements (ENCODE) project, we observed no significant differences in DMR methylation levels between cells of neuronal versus astrocyte origin (one-way ANOVA, Supplementary Figure 3). This would suggest that these DMRs are not simply the outcome of the neuronal loss typically seen in AD pathogenesis.
Although the APOE CGI is located at the 3’-end of the gene and is clearly separated from its promoter region, a major impact of a CGI’s methylation is modulating gene transcription. Thus, we assessed the effects of DNA methylation at the APOE DMRs on APOE mRNA expression. We performed qRT-PCR on 24 of the 25 frontal lobe samples (one sample was excluded due to technical problems with isolating RNA), and found no correlation between relative APOE mRNA expression and average DNA methylation at either of the DMRs (Supplementary Figure 4). This result suggests that regulating APOE expression may not be the main function of methylation at the APOE CGI, or that such regulation has cell type-specificity that cannot be observed in bulk tissue due to the presence of mixed cell types.
Overall, these results signify a complex interaction between the presence of the APOE ε4 allele(s), AD status, and DNA methylation levels in the APOE CGI.
Clonal analysis reveals the presence of un-methylated copies of the APOE DMR
The bisulfite pyrosequencing method provides a highly quantitative measurement of the DNA methylation levels at each tested CpG site in bulk brain tissue; however, this method cannot distinguish methylation profiles from individual cells nor genomic copies of the APOE CGI. To assess this, we cloned and sequenced the bisulfite converted genomic DNA of APOE ε3/ε4 frontal lobe tissue from five AD and five control subjects. DNA methylation profiles of DMR I from 19 to 30 randomly selected clones were generated (Supplementary Figure 5). Results revealed the presence of a few extensively un-methylated genomic copies in four of the ten subjects. These clones had less than 10% methylation across the 29 tested CpG sites of DMR I and represented 1.7% of the control clones and 3.5% of the AD clones. Representative clones and sequencing results from a single AD subject are shown in Fig. 4. These data suggest that the decreased DNA methylation levels of the APOE CGI in AD could be partially attributed to a sub-population of brain cells harboring hypomethylated version(s) of the APOE CGI.
Fig. 4.
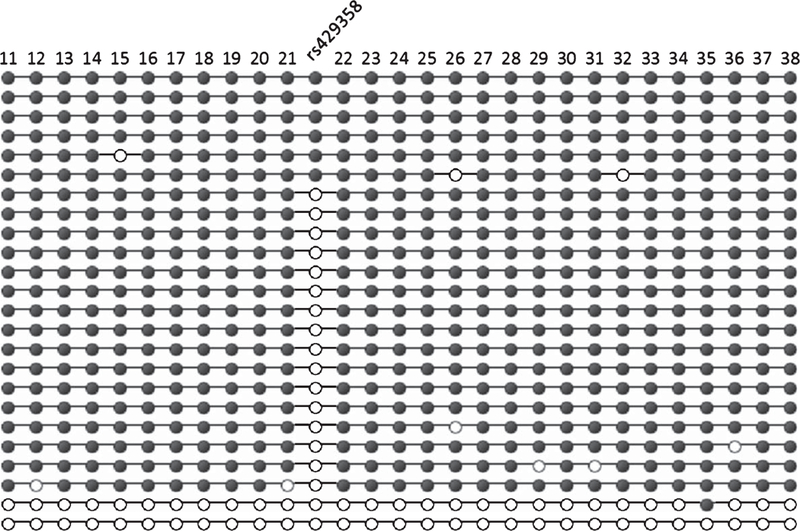
Bisulfite cloning and sequencing. A portion of the APOE CGI (CpG sites 11–38) that encompasses DMR I, was cloned from the bisulfite converted DNA from the frontal lobe of an APOE ε3/ε4 AD subject (FL18). Each row represents a Sanger sequence from a single clone and each column represents a single CpG site either methylatí (filled circles) or un-methylated (open circles). At the rs429358 site, un-methylated clones may represent an un-methylated CpG of the ε4 allele or genomic copies of the ε3 allele, which carry a TpG dinucleotide at this site that cannot be methylated.
DISCUSSION
The ε2/ε3/ε4 alleles of APOE carry pleotropic biological instructions. Besides altering the structure of the coding protein, these alleles also reshape the CpG dinucleotide content and epigenetic landscape of the APOE CGI. The potential role of these epigenetic alterations in APOE ε4 associated risk with AD has yet to be explored. In this study, and for the first time, we show that the APOE CGI is differentially methylated in the AD brain in a tissue-and APOE-genotype-specific manner. We observed a significant reduction in DNA methylation levels of the APOE CGI in two brain regions heavily impacted by AD pathophysiology, the hippocampus and the frontal lobe. Yet, we detected no difference in methylation within the cerebellum, which is known to carry minimal AD-related changes. We also observed increased DNA methylation with the presence of the ε4 allele in control but not AD subjects, suggesting a complex epigenetic regulation between the ε4 allele and AD.
Whether the reduced DNA methylation of the APOE CGI is a cause or a consequence of AD remains to be determined. Yet, given the long-duration of this disease, it is possible that even small changes in DNA methylation, such as those observed in this study, might be sufficient to modulate progression of AD. In support of this concept, our previous work suggests an enhancer role of this CGI, which can be altered by DNA methylation and can modulate gene expression of both APOE and TOMM40 in a promoter haplotype-and cell type-specific manner [13]. Changes in DNA methylation are likely to modulate this CGI’s enhancer activities, potentially altering the expression profiles of both APOE and TOMM40 with possible implications in lipid metabolism and mitochondrial function. Furthermore, the newly identified DMRs could represent critical core regions modulating such activities. Although, in this study we found no correlation between DMR methylation and APOE expression in postmortem frontal lobe tissue, two reasons could explain this lack of correlation. First, the enhancer activity of the APOE CGI has APOE promoter-haplotype specificity [13]. The samples used in this study most likely have diverse APOE promoter-haplotypes and may have mixed enhancer/silencer activities which are modulated by the CGI. A second possibility is that the biological consequences of this CGI have yet to be defined and transcriptional regulation of APOE is not its primary function. Future studies using cell-culture models harboring methylated and un-methylated versions of this gene would be beneficial in shedding insight into the functional consequence of DNA methylation at the APOE CGI.
Although DNA methylation profiles in AD can be influenced by age-associated methylation changes, commonly known as epigenetic drift [16, 17], global DNA methylation changes specific to AD have also been reported [18–20]. It is becoming apparent that there are distinct epigenetic changes associated with AD as several genes/loci are clearly differentially methylated in an AD-specific manner. For example, aberrant DNA methylation of APP, MAPT, and GSK3B has been reported in the AD brain and was attributed to a small subpopulation of cells with abnormally high levels of methylation at those loci [21]. Additionally, a recent study by De Jager et al. identified 11 differentially methylated regions of the AD frontal cortex that were associated with altered expression of seven different proximal genes [22]. Furthermore, work by Bollati et al. suggests that the methylation status of repetitive elements such as LINE-1 correlates with AD [23]. Such methylation studies in AD as well as other human diseases routinely identify loci with moderate to intermediate degrees of methylation change. In fact, extreme DNA methylation changes are rarely seen under nonmalignant conditions [24].
Notably, other DNA methylation studies have not identified APOE to be differentially methylated in AD [22, 25]. There are two reasons that may contribute to this inconsistency. First, the APOE CGI does not reside in the promoter region, which is the primary site of interest for most studies. Instead, it is located 2.6 kb downstream of the APOE promoter at the 3’-end of the gene. Second, most published AD methylation studies were done on a genome-wide basis and used a common methylation detection platform (Infinium Human Methylation 450K Bead-Chip), which is focused on promoter regions and has poor coverage of cis-regulatory regions such as enhancers [24]. Indeed this bead-chip-based assay carries only three CpG sites (cg16471933, cg05501958, cg18799241), which correspond to CpG #9, 13, and 90 within the APOE CGI. The only CpG site from the BeadChip that overlaps with our data is cg05501958 (CpG #13). Therefore, the AD-specific DMRs identified in this study could easily have been missed by other studies. Additionally, the bead-chip-based assays only target a few CpG sites within a region, thus, methylation variability at a single sight can dramatically skew results. The sequential quantitative analysis of CpG methylation across an entire region, obtained by pyrosequencing, is less susceptible to such variability and more likely to accurately reflect the true methylation profile of the sample. Furthermore, despite the limited number of subjects in this study, the pyrosequencing method we used allowed us to obtain a large amount of reliable data, including quantitative DNA methylation measurements for 76 individual CpG sites in three different brain tissue from each of these subjects.
Our results also suggest that the presence of an ε4 allele can elevate DNA methylation of the APOE CGI, while the same region’s methylation is reduced with AD. Although these results seem inconsistent with our original hypothesis of an additive model of ε4 effects on APOE methylation, we observed the largest DMR differences between AD and control in ε3/ε4 heterozygous subjects suggesting that APOE methylation in these regions may indeed be impacted by these CpG-determining SNPs. Albeit, these results point to a more complicated relationship than we previously hypothesized. Based on these findings, we speculate that ε4/ε4 healthy controls would carry even higher DNA methylation levels at this CGI, due to a double dose of ε4 alleles as well as an absent DNA-methylation-lowering-effect from AD. Likewise, since the ε2 allele is missing two CpG sites compared to the ε4 allele, we anticipate that this allele will hold the lowest level of DNA methylation in the APOE CGI. Experiments, measuring APOE CGI methylation in these additional populations, would yield comprehensive insight into the relationships between APOE genotype, AD status, and epigenetic regulation of the APOE CGI.
In bulk tissue analysis, it is possible that unaffected cellular populations, with normal DNA methylation levels, could mask the detection of larger methylation differences in affected cells. Such affected cells might represent a crucial piece of the disease pathogenesis. The bisulfite sequencing approach is the gold standard for measuring DNA methylation at a single nucleotide resolution across the DNA molecule. Using this method, our clonal analysis suggest that the lower methylation levels at some sites of the CGI are contributed, in part, by a few genomic copies (or cells) carrying un-methylated versions of the sites. This result raises the possibility that the aberrant DNA methylation of the APOE CGI in AD might be attributed to a specific subpopulation of cells in the brain.
Epigenomes are known to differ between cell types [26, 27] with neurons holding higher global levels of DNA methylation than glial cells [28]. Thus, the observations reported here could potentially represent the different cellular compositions of each distinct brain area. For example, the ratio of nonneuronal cells to neurons is nearly 1:4 in the cerebellum, while a nonneuronal/neuronal ratio of almost 3:2 is found in the gray matter of the cortex [29]. Indeed, AD pathophysiology has differential effects between brain regions as well as cell populations. Neuronal loss and glial activation within AD-affected brain regions can significantly alter the local glial/neuron ratio. Taken together, disease-related loss of cells harboring hyper-methylated APOE CGIs could explain our finding of reduced DNA methylation in AD with brain tissue specificity. In contrast, our analysis of publically available reduced representation bisulfite sequencing data showed similar DMR I methylation levels between cell lines of neuronal and astroglial origins, suggesting that shifting glial/neuronal ratios in the AD brain would not generate the DMRs we observed in this study. However, it should be noted that the majority of these cell lines are generated from malignant tumors and may not accurately represent the DNA methylation profiles of normal neurons and astrocytes. Furthermore, our cloning data suggests that the observed methylation changes may be the result of abnormal de-methylation on at least some genomic copies of the APOE CGI in a distinct population of cells. Thus, full characterization of APOE CGI DNA methylation profiles across different cell types and brain regions is necessary to interpret the magnitude to which cellular composition affects overall methylation levels in bulk tissues. Such studies would provide additional insight into why only a small number of alleles exhibit hypo-methylation and may lead to identification of a specific subset of affected cells.
There are several limitations of this study. First, due to limited availability within the UW ADRC Brain Bank, our study did not include ε2 carriers and ε4/ε4 age-matched controls, which prohibited a comprehensive analysis into all three common APOE alleles. Second, given that nearly two-thirds of the AD population in America are females [30], it is unusual that in our AD sample group 80% of individuals were male. Again, restricted availability from our brain bank is the reason for this selection. Although we did not find a significant effect of gender on APOE CGI methylation, potential gender effects should be thoroughly explored in future studies. Third, the bisulfite conversion method used in this study is unable to distinguish between 5-methylcytosine (5mC) and 5-hydroxymethylcytosine (5hmC). Given the reported presence of 5hmC in neurons [31–33], it is possible that a portion of the DNA methylation quantified here represent 5hmC, an intermediate form of demethylation that may have different biological consequences from 5mC. Fourth, although the major findings of this study were statistically significant, they were based on a relatively small number of samples and should be treated with caution and not be over-interpreted until they are verified in a larger data set. The sample sizes used in this study were sufficient to yield conventional levels of power commonly used for planning studies. For example, for statistical Model 1, which involved all tissue types and all 76 CpG sites, using the observed residual standard deviation of 6.6 and the within-subject correlation of 0.2, a future study wishing to detect a difference in percent methylation of at least 5 percentage points between groups (within tissue type) with 80% power and a two-sided 5% Type I error would require approximately 9 subjects per group. However, future studies with increased sample sizes would further validate our findings.
Overall, we present here an alternative hypothesis in which APOE exerts biological effects through epigenetics, specifically DNA methylation. This rationale could bridge the pathophysiological gap behind the ε4 allele’s strong association with AD risk.
Supplementary Material
ACKNOWLEDGMENTS
This work was supported in part by the U.S. Department of Veterans Affairs Office of Research and Development Biomedical Laboratory Research Program and National Institute of Health/National Institute on Aging grants (P50 AG05136 and T32 AG000258).
Footnotes
Authors’ disclosures available online (http://j-alz.com/manuscript-disclosures/14–3060r2).
SUPPLEMENTARY MATERIAL
The supplementary material is available in the electronic version of this article: http://dx.doi.org/10.3233/JAD-143060.
REFERENCES
- [1].Corder EH, Saunders AM, Strittmatter WJ, Schmechel DE, Gaskell PC, Small GW, Roses AD, Haines JL, Pericak-Vance MA (1993) Gene dose of apolipoprotein E type 4 allele and the risk of Alzheimer’s disease in late onset families. Science 261,921–923. [DOI] [PubMed] [Google Scholar]
- [2].Zhang D, Cheng L, Badner JA, Chen C, Chen Q, Luo W, Craig DW, Redman M, Gershon ES, Liu C (2010) Genetic control of individual differences in gene-specific methylation in human brain. Am J Hum Genet 86, 411–419. [DOI] [PMC free article] [PubMed] [Google Scholar]
- [3].Gibbs JR, van der Brug MP, Hernandez DG, Traynor BJ, Nalls MA, Lai SL, Arepalli S, Dillman A, Rafferty IP, Troncoso J, Johnson R, Zielke HR, Ferrucci L, Longo DL, Cookson MR, Singleton AB (2010) Abundant quantitative trait loci exist for DNA methylation and gene expression in human brain. PLoS Genet 6, e1000952. [DOI] [PMC free article] [PubMed] [Google Scholar]
- [4].Shoemaker R, Deng J, Wang W, Zhang K (2010) Allele-specific methylation is prevalent and is contributed by CpG-SNPs in the human genome. Genome Res 20, 883–889. [DOI] [PMC free article] [PubMed] [Google Scholar]
- [5].Heyn H (2014) A symbiotic liaison between the genetic and epigenetic code. Front Genet 5, 113. [DOI] [PMC free article] [PubMed] [Google Scholar]
- [6].Mill J, Heijmans BT (2013) From promises to practical strategies in epigenetic epidemiology. Nat Rev Genet 14, 585–594. [DOI] [PubMed] [Google Scholar]
- [7].Fass DM, Schroeder FA, Perlis RH, Haggarty SJ (2014) Epigenetic mechanisms in mood disorders: Targeting neuroplasticity. Neuroscience 264, 112–130. [DOI] [PMC free article] [PubMed] [Google Scholar]
- [8].Mbadiwe T, Millis RM (2013) Epigenetics and autism. Autism Res Treat 2013, 826156. [DOI] [PMC free article] [PubMed] [Google Scholar]
- [9].Matsumoto L, Takuma H, Tamaoka A, Kurisaki H, Date H, Tsuji S, Iwata A (2010) CpG demethylation enhances alpha-synuclein expression and affects the pathogenesis of Parkinson’s disease. PLoS One 5, e15522. [DOI] [PMC free article] [PubMed] [Google Scholar]
- [10].Jowaed A, Schmitt I, Kaut O, Wullner U (2010) Methylation regulates alpha-synuclein expression and is decreased in Parkinson’s disease patients’ brains. J Neurosci 30, 6355–6359. [DOI] [PMC free article] [PubMed] [Google Scholar]
- [11].Coppieters N, Dragunow M (2011) Epigenetics in Alzheimer’s disease: A focus on DNA modifications. Curr PharmDes 17, 3398–3412. [DOI] [PubMed] [Google Scholar]
- [12].Yu CE, Foraker J (2015) Epigenetic considerations of the APOE gene. Biomol Concepts 6, 77–84. [DOI] [PubMed] [Google Scholar]
- [13].Yu CE, Cudaback E, Foraker J, Thomson Z, Leong L, Lutz F, Gill JA, Saxton A, Kraemer B, Navas P, Keene CD, Montine T, Bekris LM (2013) Epigenetic signature and enhancer activity of the human APOE gene. Hum Mol Genet 22, 5036–5047. [DOI] [PMC free article] [PubMed] [Google Scholar]
- [14].Killip SMZ, Pearce K (2004) What is an intracluster correlation coefficient? Crucial concepts for primary care researchers. Ann Fam Med 2, 204–208. [DOI] [PMC free article] [PubMed] [Google Scholar]
- [15].Zar JH (2010) Biostatistical Analysis (5th Edition), Prentice-Hall, Inc. [Google Scholar]
- [16].Wang SC, Oelze B, Schumacher A (2008) Age-specific epigenetic drift in late-onset Alzheimer’s disease. PLoS One 3, e2698. [DOI] [PMC free article] [PubMed] [Google Scholar]
- [17].Hernandez DG, Nalls MA, Gibbs JR, Arepalli S, van der Brug M, Chong S, Moore M, Longo DL, Cookson MR, Traynor BJ, Singleton AB (2011) Distinct DNA methylation changes highly correlated with chronological age in the human brain. Hum Mol Genet 20, 1164–1172. [DOI] [PMC free article] [PubMed] [Google Scholar]
- [18].Chouliaras L, Rutten BP, Kenis G, Peerbooms O, Visser PJ, Verhey F, van Os J, Steinbusch HW, van den Hove DL (2010) Epigenetic regulation in the pathophysiology of Alzheimer’s disease. Prog Neurobiol 90, 498–510. [DOI] [PubMed] [Google Scholar]
- [19].Chouliaras L, Mastroeni D, Delvaux E, Grover A, Kenis G, Hof PR, Steinbusch HW, Coleman PD, Rutten BP, van den Hove DL (2013) Consistent decrease in global DNA methylation and hydroxymethylation in the hippocampus of Alzheimer’s disease patients. Neurobiol Aging 34, 2091–2099. [DOI] [PMC free article] [PubMed] [Google Scholar]
- [20].Bakulski KM, Dolinoy DC, Sartor MA, Paulson HL, Konen JR, Lieberman AP, Albin RL, Hu H, Rozek LS (2012) Genome-wide DNA methylation differences between late-onset Alzheimer’s disease and cognitively normal controls in human frontal cortex. J Alzheimers Dis 29, 571–588. [DOI] [PMC free article] [PubMed] [Google Scholar]
- [21].Iwata A, Nagata K, Hatsuta H, Takuma H, Bundo M, Iwamoto K, Tamaoka A, Murayama S, Saido T, Tsuji S (2014) Altered CpG methylation in sporadic Alzheimer’s disease is associated with APP and MAPT dysregulation. Hum Mol Genet 23, 648–656. [DOI] [PubMed] [Google Scholar]
- [22].De Jager PL, Srivastava G, Lunnon K, Burgess J, Schalkwyk LC, Yu L, Eaton ML, Keenan BT, Ernst J, McCabe C, Tang A, Raj T, Replogle J, Brodeur W, Gabriel S, Chai HS, Younkin C, Younkin SG, Zou F, Szyf M, Epstein CB, Schneider JA, Bernstein BE, Meissner A, Ertekin-Taner N, Chibnik LB, Kellis M, Mill J, Bennett DA (2014) Alzheimer’s disease: Early alterations in brain DNA methylation at ANK1, BIN1, RHBDF2 and other loci. Nat Neurosci 17, 1156–1163. [DOI] [PMC free article] [PubMed] [Google Scholar]
- [23].Bollati V, Galimberti D, Pergoli L, Dalla Valle E, Barretta F, Cortini F, Scarpini E, Bertazzi PA, Baccarelli A (2011) DNA methylation in repetitive elements and Alzheimer disease. Brain Behav Immun 25, 1078–1083. [DOI] [PMC free article] [PubMed] [Google Scholar]
- [24].Ulahannan N, Greally JM (2015) Genome-wide assays that identify and quantify modified cytosines in human disease studies. Epigenetics Chromatin 8, 5. [DOI] [PMC free article] [PubMed] [Google Scholar]
- [25].Lunnon K, Smith R, Hannon E, De Jager PL, Srivastava G, Volta M, Troakes C, Al-Sarraj S, Burrage J, Macdonald R, Condliffe D, Harries LW, Katsel P, Haroutunian V, Kaminsky Z, Joachim C, Powell J, Lovestone S, Bennett DA, Schalkwyk LC, Mill J (2014) Methylomic profiling implicates cortical deregulation of ANK1 in Alzheimer’s disease. Nat Neurosci 17, 1164–1170. [DOI] [PMC free article] [PubMed] [Google Scholar]
- [26].Kozlenkov A, Roussos P, Timashpolsky A, Barbu M, Rudchenko S, Bibikova M, Klotzle B, Byne W, Lyddon R, Di Narzo AF, Hurd YL, Koonin EV, Dracheva S (2014) Differences in DNA methylation between human neuronal and glial cells are concentrated in enhancers and non-CpG sites. Nucleic Acids Res 42, 109–127. [DOI] [PMC free article] [PubMed] [Google Scholar]
- [27].Davies MN, Volta M, Pidsley R, Lunnon K, Dixit A, Lovestone S, Coarfa C, Harris RA, Milosavljevic A, Troakes C, Al-Sarraj S, Dobson R, Schalkwyk LC, Mill J (2012) Functional annotation of the human brain methylome identifies tissue-specific epigenetic variation across brain and blood. Genome Biol 13, R43. [DOI] [PMC free article] [PubMed] [Google Scholar]
- [28].Coppieters N, Dieriks BV, Lill C, Faull RL, Curtis MA, Dragunow M (2014) Global changes in DNA methylation and hydroxymethylation in Alzheimer’s disease human brain. Neurobiol Aging 35, 1334–1344. [DOI] [PubMed] [Google Scholar]
- [29].Azevedo FA, Carvalho LR, Grinberg LT, Farfel JM, Ferretti RE, Leite RE, Jacob Filho W, Lent R, Herculano-Houzel S (2009) Equal numbers of neuronal and nonneuronal cells make the human brain an isometrically scaled-up primate brain. J Comp Neurol 513, 532–541. [DOI] [PubMed] [Google Scholar]
- [30].Hebert LE, Weuve J, Scherr PA, Evans DA (2013) Alzheimer disease in the United States (2010–2050) estimated using the 2010 census. Neurology 80, 1778–1783. [DOI] [PMC free article] [PubMed] [Google Scholar]
- [31].Kriaucionis S, Heintz N (2009) The nuclear DNA base 5-hydroxymethylcytosine is present in Purkinje neurons and the brain. Science 324, 929–930. [DOI] [PMC free article] [PubMed] [Google Scholar]
- [32].Munzel M, Globisch D, Bruckl T, Wagner M, Welzmiller V, Michalakis S, Muller M, Biel M, Carell T (2010) Quantification of the sixth DNA base hydroxymethylcytosine in the brain. Angew Chem Int Ed Engl 49, 5375–5377. [DOI] [PubMed] [Google Scholar]
- [33].Szulwach KE, Li X, Li Y, Song CX, Wu H, Dai Q, Irier H, Upadhyay AK, Gearing M, Levey AI, Vasanthakumar A, Godley LA, Chang Q, Cheng X, He C, Jin P (2011) 5-hmC-mediated epigenetic dynamics during postnatal neurodevelopment and aging. Nat Neurosci 14, 1607–1616. [DOI] [PMC free article] [PubMed] [Google Scholar]
Associated Data
This section collects any data citations, data availability statements, or supplementary materials included in this article.