

Abstract
Background:
Cost-effectiveness or value of cardiovascular therapies may be undermined by unwarranted cost variation, particularly for heterogeneous procedures such as catheter ablation for atrial fibrillation (AF). We sought to characterize cost variation of AF ablation in the US health-care system and the relationship between cost and outcomes.
Methods and results:
We performed a retrospective cohort study using data from the MarketScan® commercial claims and Medicare supplemental databases including patients who received an AF ablation from 2007 to 2011. We aggregated encounter cost, reflecting total payments received for the encounter, to the facility level to calculate median facility cost. We classified procedures as outpatient or inpatient and assessed for association between cost and 30-day and 1-year outcomes. The analysis cohort included 9,415 AF ablations (59±11 years; 28% female; 52% outpatient) occurring at 327 facilities, with large cost variation across facilities (median: $25,100; 25th percentile: $18,900, 75th percentile: $35,600, 95th percentile: $57,800). Among outpatient procedures, there was reduced healthcare utilization in higher cost quintiles with reductions in rehospitalization at 30-days (Quintile 1: 16.1%, Quintile 5: 8.8%, P < 0.001) and 1-year (Quintile 1: 34.8%, Quintile 5: 25.6%, P < 0.001), which remained significant in multivariate analysis.
Conclusions:
Although median costs of AF ablation are below amounts used in prior cost-effectiveness studies that demonstrated good value, large facility variation in cost suggests opportunities for cost reduction. However, for outpatient encounters, association of cost to modestly improved outcomes suggests cost containment strategies could have variable effects.
Keywords: atrial fibrillation, catheter ablation, cost effectiveness, cost variation, value
1 |. INTRODUCTION
The US healthcare system is the most expensive in the world, utilizing 17.7% of the 2011 national gross domestic product.1,2 Geographic variation has previously been observed in both Medicare3,4 and private insurance5 per patient spending. Facility and geographic variation in disease management of cardiovascular conditions has been reported principally for heart failure and myocardial infarction, with most data coming from the Veterans Health Administration.6,7
In atrial fibrillation (AF), catheter ablation has become an increasingly popular and widespread procedure for restoration of sinus rhythm and is endorsed by multiple professional society guidelines.8,9 However, the procedure is highly heterogeneous, relying on a wide variety of techniques, equipment, time, and resources. For example, AF ablation could be performed using a variety of different ablation and mapping catheters, mapping systems, ablation energy sources, sedation strategies, and ablation strategies. In this context, the variation in cost of AF ablation or its relationship to outcomes and subsequent healthcare utilization has not been defined. We therefore sought to retrospectively describe the cost variation of catheter ablation for AF at the patient and the facility level by using US commercial claims and cost data. We then sought to evaluate the relationship between AF ablation cost and subsequent healthcare utilization.
2 |. METHODS
We performed a retrospective cohort study from the Truven Health MarketScan® Commercials Claims and Encounters and Medicare supplemental databases (Truven Health Analytics Inc., Cambridge, MA, USA), which contains data on 45 million patients covered under a variety of fee-for-service and managed care health plans. Linked and merged datasets included the Inpatient Admissions file, which contains records regarding hospital admissions including all diagnoses and procedures in the service records related to an admission; the Outpatient Services file, which contains information on encounters and claims for services delivered at a doctor’s office, hospital outpatient facility, emergency room, or other outpatient facility; and the Outpatient Pharmaceutical Claims file, which includes complete records of mail-order or card program prescription drug claims.
We identified all patients with AF who received a catheter ablation between January 1, 2007 and December 31, 2011. For inclusion, patients were required to have a primary diagnosis of AF (International Classification of Diseases, 9th Revision [ICD-9] code 427.31) associated with any inpatient or outpatient encounter as well as a documented catheter ablation procedure (ICD-9 code 37.34 or Current Procedural Terminology, 4th Edition [CPT-4] code 93651).
Ablation facility was coded using an encrypted 5-digit zip code, allowing for all ablations performed within a single zip code to be aggregated, while maintaining provider and institution anonymity. We resolved instances of multiple zip codes associated with a patient’s ablation encounter by choosing the zip code with the single largest associated cost (likely representing the ablation procedure itself).
We excluded patients whose ablation was not paired with a unique encrypted zip code, whose ablation cost less than $1,000, and ablation facilities with less than 10 total ablations performed. We required continuous insurance enrollment from 6 months prior to 1 year after the ablation to allow time for patient baseline characteristics to be captured as well as for patients without adequate follow-up to be excluded.
We totaled all reimbursement payments, which included physician fees, associated with an ablation encounter to determine encounter cost. This method captures actual costs (not charges), thereby avoiding issues with estimating cost-to-charge ratios that are dependent on treatment facility and payer. These methods have been widely applied in health economics assessments for cardiovascular procedures and for AF ablation specifically.10–13 We defined ablations as outpatient only if all associated reimbursements were classified as outpatient (“23-hour stay”) and defined ablations as inpatient if any associated reimbursements were classified as inpatient. We accounted for inflation by normalizing all dollars to October 2014 using the Medical Care Consumer Price Index.14
We stratified analyses by outpatient and inpatient status and reported facility-level median cost and interquartile range due to non-normal distributions and compared outcomes across cost quintiles using the Cochran-Armitage one-sided trend test. We used generalized mixed models to determine the association between encounter cost and the following outcomes: (1) 30-day complications, (2) 1-year rehospitalizations, and (3) 1-year repeat procedures. Change in outcome odds ratio was reported for every $1,000 increase in encounter cost above median cost stratified by outpatient and inpatient status. Multivariate models included a term for random facility effects and were adjusted for patient baseline characteristics (age, sex, and anticoagulation status) and comorbidities (congestive heart failure, hypertension, diabetes, prior stroke/transient ischemic attack [TIA], prior myocardial infarction, anemia, prior bleeding, peripheral artery disease, and chronic kidney disease). Length of stay was not included in multivariate models due to collinearity with cost. All analyses were performed using SAS, version 9.2 (Cary, NC, USA) and STATA, version 11.0 (College Station, TX, USA). The study was approved by the local institutional review board.
3 |. RESULTS
The cohort included 9,415 patients across 327 ablation facilities (Figure 1). Of these patients, 4,885 were outpatients (57.9 ± 10.3 years; 27.3% female) across 316 ablation facilities and 4,530 were inpatients (59.7 ± 10.6 years; 29.5% female) across 316 ablation facilities. Baseline patient characteristics were notable for higher cost quintiles containing younger patients with lower CHADS-VASc scores, both for outpatients and inpatients (Table 1).
FIGURE 1.
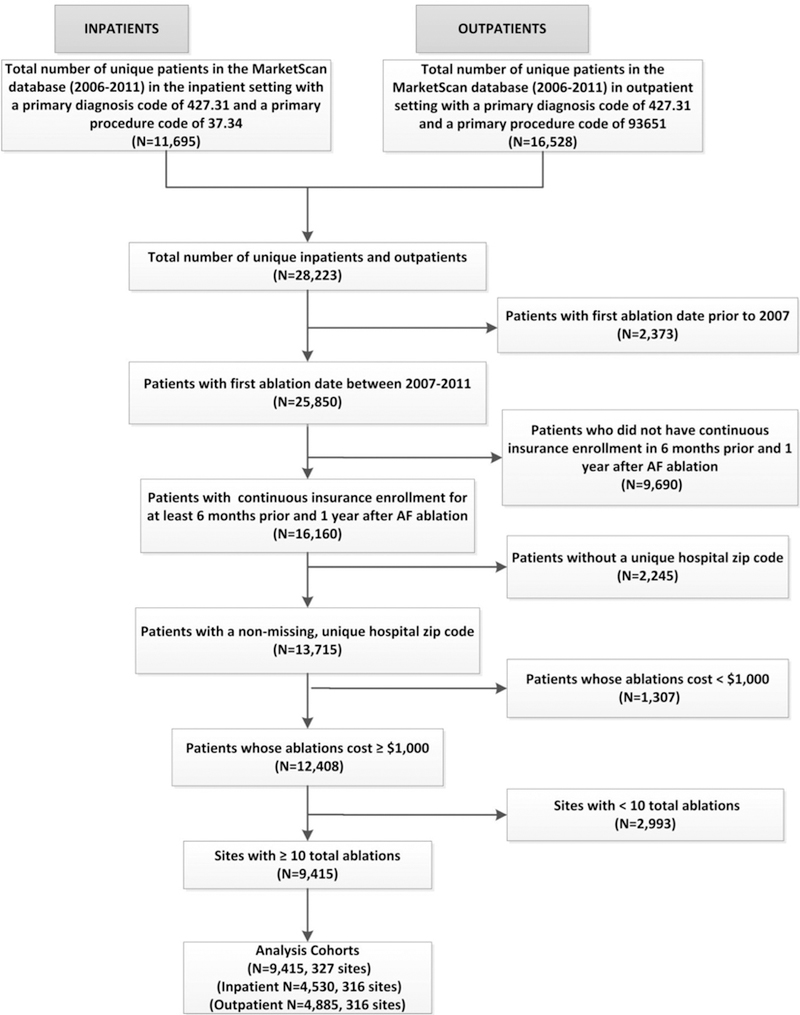
Flow diagram. Inclusion and exclusion criteria used to determine final analysis cohort. AF = atrial fibrillation
TABLE 1.
Outpatient and inpatient atrial fibrillation ablation baseline characteristics
| Outpatient AF ablation (N =
4,885) |
Inpatient AF ablation (N =
4,530) |
|||||||||||
|---|---|---|---|---|---|---|---|---|---|---|---|---|
| Cost quintile |
Cost quintile |
|||||||||||
| 1 | 2 | 3 | 4 | 5 | P value | 1 | 2 | 3 | 4 | 5 | P value | |
| Cost range per quintile | $1,199–$10,205 | $10,240–$16,820 | $16,909–$24,816 | $24,951–$40,359 | $40,491–$256,334 | $5,730–$18774 | $18,778–$23,555 | $23,615–$29,541 | $29,562–$39,997 | $40,074–$152,559 | ||
| Patient characteristics | ||||||||||||
| Patients per quintile | 523 | 782 | 1659 | 840 | 1081 | 604 | 1197 | 1028 | 949 | 752 | ||
| Age (mean ± SD) | 59.4 ± 10.0 | 59.5 ± 10.9 | 57.4 ± 10.0 | 57.3 ± 10.6 | 57.4 ± 9.8 | <0.001 | 63.3 ± 12.0 | 60.9 ± 10.6 | 59.7 ± 10.5 | 57.0 ± 9.7 | 58.6 ± 9.4 | <0.001 |
| Sex (female) | 28.1% | 29.2% | 27.7% | 26.9% | 25.1% | 0.35 | 34.1% | 30.7% | 28.7% | 25.8% | 29.5% | 0.009 |
| CHADS2 (mean ± SD) | 1.11 ± 1.02 | 1.08 ± 1.01 | 1.07 ± 0.98 | 1.02 ± 1.00 | 0.93 ± 0.92 | <0.001 | 1.24 ± 1.18 | 1.02 ± 1.04 | 0.99 ± 1.03 | 0.90 ± 0.90 | 0.93 ± 0.96 | <0.001 |
| CHADS-VASc (mean ± SD) | 2.02 ± 1.46 | 1.92 ± 1.48 | 1.83 ± 1.44 | 1.75 ± 1.46 | 1.65 ± 1.35 | <0.001 | 2.39 ± 1.76 | 1.97 ± 1.55 | 1.87 ± 1.51 | 1.60 ± 1.35 | 1.70 ± 1.45 | <0.001 |
| Anticoagulated | 64.4% | 67.3% | 65.4% | 66.6% | 72.4% | 0.001 | 76.5% | 72.6% | 70.7% | 67.0% | 64.6% | <0.001 |
| Congestive heart failure | 32.5% | 33.5% | 32.3% | 30.2% | 33.8% | 0.53 | 32.8% | 31.8% | 28.6% | 33.2% | 28.7% | 0.09 |
| Hypertension | 67.5% | 65.6% | 67.1% | 59.8% | 57.6% | <0.001 | 61.7% | 61.2% | 59.9% | 58.9% | 58.1% | 0.55 |
| Diabetes | 24.3% | 21.1% | 20.4% | 20.0% | 20.1% | 0.32 | 23.5% | 21.6% | 21.3% | 18.4% | 19.4% | 0.12 |
| Prior stroke/TIA | 4.6% | 4.5% | 3.9% | 4.8% | 3.2% | 0.44 | 4.5% | 4.7% | 4.9% | 4.0% | 2.5% | 0.12 |
| Prior MI | 5.9% | 4.5% | 4.8% | 4.6% | 3.9% | 0.48 | 4.1% | 4.3% | 3.8% | 4.2% | 4.7% | 0.94 |
| Anemia | 8.2% | 8.7% | 8.6% | 7.9% | 7.7% | 0.89 | 11.3% | 9.8% | 8.6% | 8.0% | 10.4% | 0.17 |
| Prior bleeding | 10.9% | 8.7% | 11.3% | 10.8% | 10.5% | 0.42 | 11.6% | 12.5% | 10.4% | 11.0% | 9.8% | 0.36 |
| Peripheral artery disease | 3.6% | 3.6% | 3.9% | 3.0% | 5.4% | 0.09 | 3.8% | 3.5% | 3.6% | 3.7% | 2.3% | 0.45 |
| Chronic kidney disease | 5.2% | 6.5% | 6.4% | 6.4% | 6.9% | 0.76 | 8.8% | 6.9% | 6.2% | 6.0% | 6.1% | 0.21 |
| Facility characteristics | ||||||||||||
| Facilities per quintile | 63 | 63 | 64 | 63 | 63 | 63 | 63 | 64 | 63 | 63 | ||
| Patients per facility 12.3 (mean ± SD) | 15 ± 12.3 | 19 ± 13.0 | 116 ± 100.8 | 25 ± 19.1 | 45 ± 43.2 | <0.001 | 19 ± 15.6 | 39 ± 28.7 | 31 ± 21.1 | 33 ± 30.0 | 26 ± 18.4 | <0.001 |
| Length of stay (mean ± SD) | 1.9 ± 2.2 | 1.9 ± 2.0 | 2.0 ± 2.0 | 2.2 ± 2.5 | 2.4 ± 2.3 | <0.001 | ||||||
AF = atrial fibrillation; MI = myocardial infarction; SD = standard deviation; TIA = transient ischemic attack.
At the patient level, the total cohort’s median encounter cost was $24,500 with an interquartile range of $14,700–$43,700. Five percent of patients had an encounter cost ≥$88,200 and 1% ≥ $133,400, with a 17.2-fold difference between the 10th and 90th percentile patient encounter cost (Table 2). At the facility level, the total cohort’s median encounter cost was $25,100 with an interquartile range of $18,900–$35,600. Five percent offacilities had an encounter cost ≥$57,800 and 1% ≥ $80,100, with a 3.6-fold difference between the total cohort’s 10th and 90th percentile facility encounter cost (Table 2, Figure 2).
TABLE 2.
Patient and facility level cost variation
| Total cohort |
|||||||||||
|---|---|---|---|---|---|---|---|---|---|---|---|
| Percentiles |
|||||||||||
| Mean | 1 | 5 | 10 | 25 | Median | 75 | 90 | 95 | 99 | ||
| Patient level | $32,756 | $1,568 | $2,334 | $4,017 | $14,735 | $24,549 | $43,716 | $69,134 | $88,204 | $133,427 | |
| Facility level | $28,897 | $6,986 | $12,014 | $14,257 | $18,897 | $25,083 | $35,550 | $51,014 | $57,757 | $80,135 | |
|
Outpatient |
|||||||||||
|
Percentiles |
|||||||||||
| Mean | 1 | 5 | 10 | 25 | Median | 75 | 90 | 95 | 99 | ||
| Patient level | $30,818 | $1,372 | $1,920 | $2,430 | $8,600 | $22,143 | $46,393 | $68,719 | $86,035 | $124,609 | |
| Facility level | $26,313 | $2,612 | $3,297 | $4,975 | $12,367 | $20,935 | $36,206 | $50,694 | $59,614 | $92,459 | |
|
Inpatient |
|||||||||||
|
Percentiles |
|||||||||||
| Mean | 1 | 5 | 10 | 25 | Median | 75 | 90 | 95 | 99 | ||
| Patient level | $34,846 | $3,657 | $9,121 | $13,670 | $18,134 | $25,926 | $41,073 | $69,627 | $90,641 | $141,433 | |
| Facility level | $31,085 | $8,914 | $13,971 | $16,598 | $19,723 | $25,910 | $36,274 | $54,908 | $66,419 | $86,973 | |
FIGURE 2.

Total cohort atrial fibrillation ablation cost variation by facility. Facilities’ Quartile 1 (Q1), Median, and Quartile 3 (Q3) cost of catheter ablation for atrial fibrillation ranked in order by median cost. AF = atrial fibrillation
Among outpatient procedures, there were significant decreases across increasing cost quintiles in 30-day all-cause rehospitalization (Quintile 1: 16.1%, Quintile 5: 8.8%, P value < 0.001) and multiple 30-day complications (vascular complication, hematoma/hemorrhage, congestive heart failure). Similar findings were observed for multiple 1-year outcomes, including all cause rehospitalization (Quintile 1: 34.8%, Quintile 5: 25.6%, P value < 0.001), AF rehospitalization (Quintile 1: 16.6%, Quintile 5: 10.4%, P value = 0.001), and stroke/TIA rehospitalization (Quintile 1: 1.2%, Quintile 5, 0.4%, P value = 0.04). There were no significant trends across cost quintiles for 1-year repeat procedures (Table 3).
TABLE 3.
Outpatient and inpatient atrial fibrillation ablation outcomes
| Outpatient AF ablation (N =
4,885) |
Inpatient AF ablation (N =
4,530) |
|||||||||||
|---|---|---|---|---|---|---|---|---|---|---|---|---|
| Cost quintile |
Cost quintile |
|||||||||||
| 30-day complications | 1 | 2 | 3 | 4 | 5 | P value | 1 | 2 | 3 | 4 | 5 | P value |
| All cause rehospitalization | 16.1% | 11.4% | 9.1% | 8.7% | 8.8% | <0.0001 | 6.6% | 5.5% | 7.0% | 5.9% | 7.2% | 0.24 |
| Vascular complication | 2.1% | 1.2% | 1.2% | 0.4% | 1.2% | 0.05 | 3.8% | 3.4% | 3.4% | 4.4% | 5.9% | 0.009 |
| Hematoma/hemorrhage | 2.1% | 0.9% | 1.1% | 0.2% | 1.1% | 0.05 | 2.5% | 3.1% | 2.3% | 4.0% | 4.1% | 0.02 |
| Perforation/tamponade | 1.7% | 0.6% | 1.2% | 0.8% | 1.2% | 0.38 | 4.6% | 5.9% | 5.8% | 6.2% | 11.3% | <0.0001 |
| Stroke/TIA | 0.8% | 0.3% | 0.2% | 0.2% | 0.2% | 0.06 | 0.7% | 0.6% | 0.6% | 0.7% | 1.6% | 0.02 |
| Congestive heart failure | 1.3% | 0.9% | 0.6% | 0.6% | 0.5% | 0.03 | 1.3% | 0.3% | 0.3% | 0.3% | 0.8% | 0.25 |
| One-year rehospitalizations | ||||||||||||
| All cause rehospitalization | 34.8% | 29.7% | 26.4% | 25.0% | 25.6% | <0.0001 | 36.4% | 33.0% | 32.1% | 32.2% | 30.9% | 0.02 |
| Atrial fibrillation | 16.6% | 13.0% | 11.1% | 12.5% | 10.4% | 0.001 | 13.3% | 16.9% | 15.0% | 15.9% | 14.6% | 0.48 |
| Myocardial infarction/unstable angina | 1.0% | 0.9% | 0.9% | 0.6% | 1.3% | 0.28 | 1.2% | 0.9% | 1.7% | 1.4% | 1.3% | 0.23 |
| Congestive heart failure | 2.1% | 1.4% | 1.3% | 1.6% | 1.0% | 0.08 | 5.6% | 2.2% | 1.3% | 1.5% | 2.5% | 0.0005 |
| Supraventricular tachycardia | 0.0% | 0.5% | 0.1% | 0.5% | 0.2% | 0.37 | 0.3% | 0.5% | 0.3% | 0.4% | 0.3% | 0.34 |
| Ventricular arrhythmia | 1.2% | 1.2% | 0.9% | 1.6% | 0.6% | 0.19 | 0.8% | 0.8% | 1.0% | 1.4% | 1.3% | 0.08 |
| Stroke/TIA | 1.2% | 0.4% | 0.4% | 0.2% | 0.4% | 0.04 | 0.7% | 0.2% | 0.5% | 0.7% | 0.4% | 0.32 |
| Syncope | 0.4% | 0.1% | 0.2% | 0.2% | 0.1% | 0.2 | 0.0% | 0.2% | 0.1% | 0.7% | 0.3% | 0.02 |
| One-year repeat procedures | ||||||||||||
| Repeat AF ablation | 21.8% | 18.9% | 14.7% | 15.8% | 19.2% | 0.16 | 11.9% | 15.2% | 15.0% | 13.6% | 13.8% | 0.44 |
| Cardioversion | 21.2% | 20.6% | 20.4% | 20.8% | 22.5% | 0.19 | 23.5% | 24.7% | 18.7% | 21.9% | 18.8% | 0.002 |
AF = atrial fibrillation; TIA = transient ischemic attack.
Among inpatient procedures, there were significant increases across increasing cost quintiles in 30-day complications for perforation/tamponade (Quintile 1: 4.6%, Quintile 5: 11.3%, P value < 0.001) and multiple other 30-day complications (vascular complications, hematoma/hemorrhage, stroke/TIA). There were significant trends, of variable direction, across increasing cost quintiles for 1-year outcomes, including all cause rehospitalization (Quintile 1: 36.4%, Quintile 5: 30.9%, P value = 0.02), congestive heart failure rehospitalization (Quintile 1: 5.6%, Quintile 5, 2.5%, P value < 0.001), syncope rehospitalization (Quintile 1: 0.0%, Quintile 5: 0.3%, P value = 0.03), and repeat cardioversion (Quintile 1: 23.5%, Quintile 5: 18.8%, P value = 0.002; Table 3).
In multivariate analyses, among outpatient procedures, every $1,000 increase in encounter cost above median cost was associated with a 0.5% decrease in the odds of 30-day all cause rehospitalization (OR 0.995; 95% CI: 0.991–0.998; P = 0.004), decreases in the odds of multiple 30-day complications (hematoma/hemorrhage, congestive heart failure), 0.4% decrease in the odds of 1-year all cause rehospitalization (OR 0.996; 95% CI: 0.994–0.999; P = 0.009), 0.4% decrease in the odds of 1-year AF rehospitalization (OR: 0.996; 95% CI: 0.992– 0.999; P = 0.009), and 0.3% decrease in the odds of 1-year repeat AF ablation (OR: 0.997; 95% CI: 0.994–1.000; P = 0.029) (Table S1). Among inpatient procedures, every $1,000 increase in encounter cost above median cost was associated with a 0.7% increase in the odds of 30-day vascular complication (OR: 1.007; 95% CI: 1.003–1.012; P < 0.001), 0.4% increase in the odds of 30-day perforation/tamponade (OR: 1.004; 95% CI: 1.000–1.008; P = 0.039), and 0.8% increase in the odds of 1-year ventricular arrhythmia (OR: 1.008; 95% CI: 1.001– 1.016; P = 0.031; Table S2).
4 |. DISCUSSION
We found wide patient and facility-level variation in cost of catheter ablation for AF across the US healthcare system with a 17.2-fold and 3.6-fold difference between the total cohort’s 10th and 90th percentile encounter cost, respectively. After controlling for covariates, outpatient encounter cost was associated with modestly improved downstream healthcare utilization.
To our knowledge, this is the first examination of cost variability of catheter ablation for AF. Facility cost variation of percutaneous coronary intervention (PCI) was previously examined within the VA Health Care System, with a 5-fold cost difference observed between the lowest and highest VA facilities’ mean encounter cost (defined as all costs within 7 days of PCI). Greater variation was found in risk adjusted 1-year cost as compared to risk adjusted 1-year mortality, suggesting that there may be significant potential for cost reduction.7 We found greater facility level encounter cost variation for AF ablation as compared to the PCI study, which may be due to several factors. Greater heterogeneity in AF ablation technique and equipment may contribute to the larger cost variation as compared to PCI. In fact, ablation has more modifier and add-on procedural billing codes as compared to PCI. An analysis of AF ablation equipment costs to the hospital by Winkle et al. found that equipment cost can vary between $6,637 to $22,284.15 However, even if this variation was tripled, it would not account for wide range in cost variation across all sites, suggesting that other factors account for most of the observed variation.
Previous cost-effectiveness analyses of AF ablation have found incremental cost-effectiveness ratios close to willingness-to-pay thresholds ($50,000 per quality-adjusted life year), suggesting that AF ablation is cost-effective in carefully selected patients.12,16–22 However, these analyses are highly dependent on input variables (e.g., time horizon, patient characteristics, procedural success rate, and procedure cost). Our facility-level median encounter costs (outpatient: $20,900, inpatient: $25,910) are lower than cost inputs used in most analyses, suggesting AF ablation could be more cost-effective than previously thought. AF ablation cost-effectiveness and value could be further improved if unwarranted AF ablation cost variation is reduced, which would expand the economic appropriateness of AF ablation to a wider population. The American College of Cardiology and the American Heart Association published a joint statement arguing that clinical guideline statements should include a value of care designation, which if implemented, may discourage use of low-value interventions and encourage optimization of an intervention’s value through reductions in unwarranted cost variation.23
Higher cost procedures may be justifiable if they resulted in improved outcomes and cumulative cost savings. Demonstration of improved outcomes with higher cost care has been elusive,3,24 however, there are specific examples of possible association.25,26 Our finding of decreased downstream healthcare utilization in multivariate analyses of outpatient AF ablation procedures suggests that a proportion of AF ablation cost variability may be warranted. The association between improved outcomes and cost would be expected if more technically complex ablation strategies (e.g., rotor mapping, fibrosis-guided ablation, etc.) and ablation devices (e.g., force-contact catheters, cryocatheters, cryoballoons, etc.) are associated with improved effectiveness. It is possible that higher-cost facilities have better system of care or management resources (arrhythmia nurse practitioners, dedicated AF postablation care pathways, procedural, discharge, and follow-up protocols, etc.) Notably, the proportion of patients receiving repeat ablation was not lower at higher cost facilities. However, assigning causation is not possible in this observational study. High cost could be a marker of a healthcare system’s local dominance in setting high prices, which has been observed with healthcare spending nationally due to consolidation. These dominant centers may naturally be high volume, without the cost directly mediating the observed difference in outcomes.
Notably, among inpatient procedures (usually >23-hour stays), cost was instead associated with increased rates of complications (both 30-day and 1-year). In this case, the cost of the complications may have led to the increase in encounter cost. Patients billed under inpatient encounters may also have baseline comorbidities or other factors that increase risk of complications.
Unwarranted cost variability may be reduced by addressing knowledge gaps in the AF ablation literature, reducing technique and equipment heterogeneity. However, thoughtful and evidence driven health policy reforms have greater potential to reduce unwarranted cost variation and increase value. To date, lack of consensus on strategy has hindered policy reform.27 Policies supporting reduction of payment rates to high-spending regions have been criticized as penalizing institutions providing high value care in high-spending regions.27,28 While policies incentivizing high-value care (e.g., accountable care organizations and bundled payments) have been criticized for inaccurately measuring value of care.27 Further exploration of the complicated relationship between cost and outcomes of AF ablation is warranted to guide policy reform efforts targeted at improving procedure value. The Affordable Care Act supports bundled payment and readmission penalties, which could incentivize reducing complications and the associated cost of complications. However, procedure availability could be limited if facilities make economically driven decisions to defer or not offer ablation to more complex or high-risk patients. Additionally, bundling payments may de-incentivize uptake and development of novel and potentially more efficacious ablation approaches, which themselves may have operator and facility learning curves.29,30
Our study has multiple limitations. First, zip code anonymity prevented controlling for socioeconomic factors that may account for some of the cost variability as well as practice variation that could account for some of the decreased hospitalization rates. Second, site aggregation based on 5-digit zip codes could have combined multiple hospitals into a single aggregate site in some dense, metropolitan areas. However, although this could affect variation within the aggregated site, variation across sites would decrease and bias toward the null, and this would not affect patient-level analysis. Third, in order to properly ascertain baseline comorbidities and outcomes, we had to condition cohort inclusion based on pre- and postablation continuous health plan enrollment, which could introduce selection bias if high- or low-healthcare utilizers were differentially excluded. Fourth, we were unable to extract details on specific ablation equipment, technique or AF severity, thereby preventing us from comparing cost and outcomes of different ablation strategies (e.g., pulmonary vein isolation vs. other strategies). Finally, although we used a previously developed approach to identify AF ablation with high specificity, individual case misclassification is possible, although it would not be expected to drive site-level results.
5 |. CONCLUSION
We found wide patient and facility-level variation in cost of catheter ablation for AF. Although median costs of AF ablation are below amounts used in prior cost-effectiveness studies that demonstrated good value, the large facility variation in cost suggests that there may be opportunities for cost reduction.
Supplementary Material
Acknowledgments
Dr. Turakhia is supported by a Veterans Health Services Research & Development Career Development Award (CDA09027–1), and an American Heart Association National Scientist Development Grant (09SDG2250647). Funding sources had no involvement in study design orin the collection, analysis, and interpretation of data.
Disclosures: S.M. Narayan: Research Grant; Significant: National Institutes of Health (HL13359). Ownership Interest; Significant; Topera. Consulting; Modest: Abbott. Consulting; Minor: Uptodate, American College of Cardiology. P.J. Wang: Research Grant; Modest; Medtronic, Inc., Siemens, Cardiofocus, ARCA. Other Research Support; Modest; Medtronic, Inc., St Jude Medical, Boston Scientific Corp, Biosense Webster. Honoraria; Modest; Janssen Pharmaceuticals, St Jude Medical, Medtronic, Inc., Amgen, Johnson & Johnson. Ownership Interest; Modest; Vytronus. Consultant/Advisory Board; Modest; Janssen Pharmaceuticals, St Jude Medical, Medtronic, Inc., Amgen. M. Turakhia: Research Grant; Significant; Janssen Pharmaceuticals, Medtronic Inc., AstraZeneca, Veterans Health Administration, Cardiva Medical Inc. Other Research Support; Modest; AliveCor Inc., Amazon, Zipline Medical Inc., iBeat Inc., iRhythm Technologies Inc. Honoraria; Significant; Abbott. Honoraria; Modest; Medtronic Inc., Boehringer Ingelheim, Precision Health Economics, iBeat Inc., Akebia, Cardiva Medical Inc., Medscape/theheart.org.
Footnotes
Other authors:No disclosures.
SUPPORTING INFORMATION
Additional supporting information may be found online in the Supporting Information section at the end of the article.
REFERENCES
- 1.World Health Organization; World Health Statistics 2014. (In IRIS) Geneva: World Health Organization; 2014. [Google Scholar]
- 2.Davis K, Stremikis K, Squires D, Schoen C. Mirror, Mirror on the Wall, 2014 Update: How the US Health Care System Compares Internationally New York (NY): Commonwealth Fund; 2014. [Google Scholar]
- 3.Fisher ES, Wennberg DE, Stukel TA, Gottlieb DJ, Lucas FL, Pinder EL. The implications of regional variations in medicare spending. Part 1: The content, quality, and accessibility of care. Ann Intern Med 2003;138:273–287. [DOI] [PubMed] [Google Scholar]
- 4.Zuckerman S, Waidmann T, Berenson R, Hadley J. Clarifying sources of geographic differences in medicare spending. N Engl J Med 2010;363:54–62. [DOI] [PubMed] [Google Scholar]
- 5.Cooper Z, Craig SV, Gaynor M, Reenen JV. The price ain’t right? Hospital prices and health spending on the privately insured. National Bureau of Economic Research Working Paper Series 2015; No. 21815. [DOI] [PMC free article] [PubMed]
- 6.Yoon J, Fonarow GC, Groeneveld PW, et al. Patient and facility variation in costs of VA heart failure patients. JACC Heart Fail 2016;4:551–558. [DOI] [PMC free article] [PubMed] [Google Scholar]
- 7.Ho PM, O’Donnell CI, Bradley SM, et al. 1-year risk-adjusted mortality and costs of percutaneous coronary intervention in the Veterans Health Administration: Insights from the VA CART program. J Am Coll Cardiol 2015;65:236–242. [DOI] [PubMed] [Google Scholar]
- 8.January CT, Wann LS, Alpert JS, et al. Members AATF. 2014 AHA/ACC/HRS guideline for the management of patients with atrial fibrillation: A report of the American College of Cardiology/American Heart Association Task Force on practice guidelines and the Heart Rhythm Society. Circulation 2014;130:e199–267. [DOI] [PMC free article] [PubMed] [Google Scholar]
- 9.Camm AJ, Lip GY, De Caterina R, et al. Guidelines ESCCfP: 2012 focused update of the ESC Guidelines for the management of atrial fibrillation: An update of the 2010 ESC Guidelines for the management of atrial fibrillation. Developed with the special contribution of the European Heart Rhythm Association. Eur Heart J 2012;33:2719–2747. [DOI] [PubMed] [Google Scholar]
- 10.Neprash HT, Wallace J, Chernew ME, McWilliams JM. Measuring prices in health care markets using commercial claims data. Health Ser Res 2015;50:2037–2047. [DOI] [PMC free article] [PubMed] [Google Scholar]
- 11.Robinson JC. Variation in hospital costs, payments, and profitabilty for cardiac valve replacement surgery. Health Serv Res 2011;46:1928–1945. [DOI] [PMC free article] [PubMed] [Google Scholar]
- 12.Reynolds MR, Zimetbaum P, Josephson ME, Ellis E, Danilov T, Cohen DJ. Cost-effectiveness of radiofrequency catheter ablation compared with antiarrhythmic drug therapy for paroxysmal atrial fibrillation. Circ Arrhythm Electrophysiol 2009;2:362–369. [DOI] [PMC free article] [PubMed] [Google Scholar]
- 13.Baykaner T, Duff S, Hasegawa JT, Mafilios MS, Turakhia MP. Cost effectiveness of focal impulse and rotor modulation guided ablation added to pulmonary vein isolation for atrial fibrillation. J Cardiovasc Electrophysiol 2018;29:526–536. [DOI] [PubMed] [Google Scholar]
- 14.United States Bureau of Labor Statistics. Consumer Price Index: U.S. Medical Care Available at http://data.bls.gov/cgi-bin/surveymost?cu. Accessed November 30 2014.
- 15.Winkle RA, Mead RH, Engel G, Kong MH, Patrawala RA. Physician-controlled costs: The choice of equipment used for atrial fibrillation ablation. J Interv Card Electrophysiol 2013;36:157–165. [DOI] [PMC free article] [PubMed] [Google Scholar]
- 16.Chan PS, Vijan S, Morady F, Oral H. Cost-effectiveness of radiofrequency catheter ablation for atrial fibrillation. J Am Coll Cardiol 2006;47:2513–2520. [DOI] [PubMed] [Google Scholar]
- 17.Rodgers M, McKenna C, Palmer S, et al. Curative catheter ablation in atrial fibrillation and typical atrial flutter: Systematic review and economic evaluation. Health Technol Assess 2008;12:iii–iv. xi-xiii, 1–198. [DOI] [PubMed] [Google Scholar]
- 18.Eckard N, Davidson T, Walfridsson H, Levin L-Å. Cost-effectiveness of catheter ablation treatment for patients with symptomatic atrial fibrillation. J Atr Fibrillation 2009;1:461–470. [DOI] [PMC free article] [PubMed] [Google Scholar]
- 19.Assasi N, Blackhouse G, Xie F, et al. Ablation procedures for rhythm control in patients with atrial fibrillation: Clinical and cost-effectiveness analyses. CADTH Technol Overv 2012;2:e2101. [PMC free article] [PubMed] [Google Scholar]
- 20.Blackhouse G, Assasi N, Xie F, et al. Cost-effectiveness of catheter ablation for rhythm control of atrial fibrillation. Int J Vasc Med 2013;2013:262809. [DOI] [PMC free article] [PubMed] [Google Scholar]
- 21.Reynolds MR, Lamotte M, Todd D, et al. Cost-effectiveness of cryoballoon ablation for the management of paroxysmal atrial fibrillation. Europace 2014;16:652–659. [DOI] [PubMed] [Google Scholar]
- 22.Aronsson M, Walfridsson H, Janzon M, et al. The cost-effectiveness of radiofrequency catheter ablation as first-line treatment for paroxysmal atrial fibrillation: Results from a MANTRA-PAF substudy. Europace 2015;17:48–55. [DOI] [PubMed] [Google Scholar]
- 23.Anderson JL, Heidenreich PA, Barnett PG, et al. Guidelines AATFoP: ACC/AHA statement on cost/value methodology in clinical practice guidelines and performance measures: A report of the American College of Cardiology/American Heart Association Task Force on Performance Measures and Task Force on Practice Guidelines. Circulation 2014;129:2329–2345. [DOI] [PubMed] [Google Scholar]
- 24.Fisher ES, Wennberg DE, Stukel TA, Gottlieb DJ, Lucas FL, Pinder EL. The implications of regional variations in Medicare spending. Part 2: Health outcomes and satisfaction with care. Ann Intern Med 2003;138:288–298. [DOI] [PubMed] [Google Scholar]
- 25.Doyle JJ Jr, Graves JA, Gruber J, Kleiner S, Do high-cost hospitals deliver better care? Evidence from ambulance referral patterns National Bureau of Economic Research; 2012; No. 17936. [Google Scholar]
- 26.Silber JH, Kaestner R, Even SO, Wang Y, Bressler LJ. Aggressive treatment style and surgical outcomes. Health Serv Res 2010;45:1872–1892. [DOI] [PMC free article] [PubMed] [Google Scholar]
- 27.Bach PB. A map to bad policy–hospital efficiency measures in the Dart-mouth Atlas. N Engl J Med 2010;362:569–573. [DOI] [PMC free article] [PubMed] [Google Scholar]
- 28.Hussey PS, Huckfeldt P, Hirshman S, Mehrotra A. Hospital and regional variation in medicare payment for inpatient episodes of care. JAMA Intern Med 2015;175:1056–1057. [DOI] [PubMed] [Google Scholar]
- 29.Jena AB, Philipson T. Cost-effectiveness as a price control. Health Aff (Millwood) 2007;26:696–703. [DOI] [PubMed] [Google Scholar]
- 30.Paradis R. Bundled payments: Do they put innovation at risk. Health Affaris Blog. 2014 Available at http://healthaffairs.org/blog/2014/09/22/bundled-payments-do-they-put-innovation-at-risk-4/. Accessed Februrary 2016.
Associated Data
This section collects any data citations, data availability statements, or supplementary materials included in this article.