

Abstract
Aging is a major risk factor for both normal and pathological cognitive decline. However, individuals vary in their rate of age-related decline. We developed an easily interpretable composite measure of cognitive age, and related both the level of cognitive age and cognitive slope to sociodemographic, genetic, and disease indicators and examine its prediction of dementia transition. Using a sample of 19,594 participants from the Health and Retirement Study, cognitive age was derived from a set of performance tests administered at each wave. Our findings reveal different conclusions as they relate to levels versus slopes of cognitive age, with more pronounced differences by sex and race/ethnicity for absolute levels of cognitive decline rather than for rates of declines. We also find that both level and slope of cognitive age are inversely related to education, as well as increased for persons with APOE ε4 and/or diabetes. Finally, results show that the slope in cognitive age predicts subsequent dementia among non-demented older adults. Overall, our study suggests that this measure is applicable to cross-sectional and longitudinal studies on cognitive aging, decline, and dementia with the goal of better understanding individual differences in cognitive decline.
Keywords: Cognitive Decline, Aging, Dementia, Education, APOE, Polygenic Risk Score
INTRODUCTION
Aging is a major contributor to cognitive decline and dementia. Decreases in fluid abilities such as memory, reasoning, executive functioning, attention, and processing speed have been shown to begin as early as the second decade of life and appear to accelerate as individuals enter their seventh decade of life (Singh-Mannoux et al. 2012; Deary et al. 2009). Nevertheless, individuals of the same chronological age are heterogeneous in rates of decline and overall level of cognitive functioning. While much of the decline is thought of as a normal part of the aging process, neurodegeneration is a continuum that typically transitions from normal functioning, to mild cognitive impairment, and finally to dementia (Sperling et al. 2011). Thus, variations in the rate of cognitive decline with age often produce differences in susceptibility to developing dementias, such as Alzheimer’s disease (AD). The ability to identify an individual’s trajectory early in this process could facilitate interventions to postpone or prevent dementia, and as a result, there is a need for composite measures of cognition, which are easily interpretable, and that capture variations in functioning and age-related decline within populations.
Quantification of cognitive aging may also help identify factors which alter the rate of decline. Currently, a number of genetic contributors have been identified as risk factors for dementia and AD. For instance, twin studies estimate that genetic differences account for approximately 43% of the variance in dementia prevalence and up to 74% of the variance in AD prevalence (Gatz et al. 1997). APOE, a major cholesterol carrier, has been identified as one of the strongest genetic determinants of late-onset AD (Liu et al. 2013). The APOE ε4 allele is associated with reductions in neural protection and repair—thus carriers are more vulnerable to damage accumulated over their lifetime (Smith et al. 2006)—and it has been suggested that individual with the homozygotic ε4 allele have an almost 15-fold increase risk of developing AD compared to ε3/ε3 carriers (Farrer et al. 1997). In addition to APOE, recent evidence suggests that dementia risk is a polygenic trait—influenced by multiple genetic variants that have small individual effects, yet together produce a large aggregate effect—and as such, a number of polygenic risk scores (PRS) have been proposed for capturing the genetic architecture of dementia (Daniel et al. 2013; Escott-Price et al. 2015; Lambert et al. 2013; Marden et al. 2014).
While in twin studies, much of the variance in dementia has been attributed to genetics, there is significant missing heritability when it comes to single nucleotide polymorphism (SNP)-based estimates of dementia risk (Ridge et al. 2013). Part of this may reflect environmental contributors, which are often hard to disentangle in twin studies, given that twin pairs often share environments. It has been suggested that demographic, social, behavioral, and physical environmental contributors may strongly confer susceptibility to dementia, either independently of genetic risk, or by amplifying the effect of innate genetic vulnerabilities. For instance, women have been reported to have a higher lifetime risk of Alzheimer’s disease compared to men (Seshadi et al. 2006). A number of studies have also reported that racial and ethnic minorities experience higher rates of dementia and Alzheimer’s disease compared to non-Hispanic whites (Manley and Mayeux 2004). These differences persist even after adjusting for socioeconomic status, which itself, particularly when measured using educational attainment, also predicts cognitive functioning and dementia risk (Brayne and Colloway 1990; Cagney and Lauderdale 2002; Evans et al. 1993, 1997).
Cardiometabolic diseases are also major risk factors for cognitive decline and neurodegeneration. There is substantial evidence that Type 2 diabetes increases the risk for Alzheimer’s disease and related dementias (Craft 2005; Cukerman, Gerstein and Williamson 2005; Luchhsinger et al. 2001; Profenno, Porsteinsson and Faraone 2010; Watson and Craft 2003). Similarly, heart disease has also been shown to be a major promoter of cognitive decline among older adults (Haring etal. 2013; Leritz et al. 2011). The links between cognitive functioning and cardiometabolic health may partially explain the increased dementia incidence among obese individuals. For instance, increased central adiposity is often a precursor for insulin resistance and a hallmark of metabolic syndrome, characterized by systemic inflammation, hypertension, dyslipidemia, and hypercholesterolemia. This is turn often leads to cerebrovascular dysfunction and increased deposition of amyloid beta plaques, which manifests as cognitive impairment and dementia (Luchsinger and Gustafson 2009). As a result, the recent obesity epidemic may further increase dementia prevalence among aging baby-boomer and younger generations, reaffirming the importance of developing measures to facilitate both research into these complex dynamics and early identification of at-risk individuals within the population.
The goal of this paper is to present an easily interpretable composite measure of cognitive aging based on performance on a set of cognitive tests in the Health and Retirement study—a large nationally-representative population study—which can be used to assess an individual’s level of cognitive functioning and rate of decline. We validate this measure by relating it to genetic markers (APOE and a genetic polygenic risk score (PRS)), cardiometabolic disease presence (diabetes prevalence, heart disease prevalence, and BMI), and sociodemographic factors (sex, race/ethnicity and education), all of which have been suggested to influence cognitive decline and dementia risk. The data used reflect the total population of the United States over age 50. These data have been used to estimate national levels of prevalence and incidence of dementia and cognitive functioning (Langa et al. 2008, 2016).
METHODS
Data
The Health and Retirement Study (HRS) is a nationally-representative, biennial survey of Americans over the age of 51. The HRS is an ongoing study that began in 1992 and is refreshed with new younger participants every six years. It is funded by the National Institute on Aging and carried out by the University of Michigan (Sonnega et al. 2014) The HRS includes information about the health, financial well-being, and work and retirement status of older Americans, in addition to a consistent set of tests that measure salient dimensions of cognition functioning. The HRS genetic sample included 12,507 participants who provided saliva samples and signed consent forms in 2006 and 2008.
HRS participants were included in our study as long as they had cognitive functioning measures for at least three waves, allowing for the estimation of a cognitive aging slope. This resulted in an analytic sample of 19,594 participants 10,784 of whom also had genetic data available and form the genetic analytic sample. On average, excluded subjects were older, had lower education, were more likely to be racial-ethnic minorities, and had lower cognitive functioning at their baseline interviews.
Cognitive Aging
In this analysis, cognitive aging measures were derived from data collected from wave three (1996) through wave ten (2010) using four cognitive functioning assessment measures—delayed recall, immediate recall, serial 7s, and backwards counting. The inclusion of only four measures was based on availability. The cognitive battery in HRS is aimed at assessing memory, semantic memory, andorientation. All four measures have been demonstrated to sufficiently capture episodic and working memory, which has been acknowledged as one of the first cognitive deficits to occur during normal aging (Backman, Small and Wahlin 2001).
For all waves, the score for immediate and delayed recall were both based on the number of words correctly recalled out of ten possible. The delayed recall was assessed approximately five minutes after the word list was read, between which other tasks were performed. The scores for serial 7s ranged from 0-5. Respondents were asked to continuously subtract by 7, starting from 100. Points were awarded for correct responses for a total of five subtractions. For backwards counting scores, respondents were asked to count backwards for 10 consecutive times, beginning with the number 20. A total of two points were allotted for two attempts at backwards counting—participants received a zero if they were incorrect on both tries; a 1 if they were incorrect on the first try, but correct on the second; and a 2 if they correctly completed the task on the first try.
Given that missing data is not likely missing at random and instead may reflect differential cognitive abilities, we utilized the imputed cognitive measures for those with missing data. For instance, HRS provided imputed variables that were calculated based on multivariate, regression based procedures. Imputation for cognitive variables were provided for participants (self-respondents) who had completed the HRS interview for that wave. More information on imputation procedures can be found in (Fisher et al. 2017).
Cognitive age was calculated for each participant at each wave, based on an approach proposed by Klemera & Doubal (2006) for calculating biological ages from biomarker data that has previously been validated using both real and simulated data (Levine, 2013). Cognitive age estimates combine information from equations of chronological age regressed on each of the cognitive functioning markers. The equation for calculating cognitive age is:
Where, kj and qj are the slope and intercept, respectively, for chronological age on each cognitive measure, xji is each the value of the cognitive measure for participant i, sj is the root mean squared error of chronological age regressed on the cognitive measure, and CAi is chronological age for participant i. Additionally, (the variance of the random variable, RBA), takes into account the variability in the first half of the equation, the mean variance of the cognitive measures that is explained by chronological age, and the range of chronological age (Levine 2013). Once cognitive ages were determined for each participant at each wave we calculated individual slopes for each participant as the change in cognitive age as a function of the change in chronological age over the fourteen years (1996-2010).
Genetic Risk Factors
Genetic risk factors examined in our study included APOE ε4 count, and a dementia-related polygenic risk score. Genotyping was carried-out by the NIH Center for Inherited Disease Research using the Illumina Human Omni-2.5 Quad beadchip, with coverage of approximately 2.5 million SNPs. Imputation, for approximately 21 million DNA variants from the 1000Genomes Project (http://www.1000genomes.org/) was performed by the Genetics Coordinating Center at the University of Washington using IMPUTE2.
Two SNPs (rs7412 and rs429358), which were imputed in the HRS data, form the three APOE protein isoforms (ε2, ε3, and ε4). Given that previous studies have shown that the ε4 isoform increases Alzheimer’s disease susceptibility (Liu et al. 2013), participants in the genetic sample were coded based on their number of ε4 alleles.
A polygenic risk score (PRS) was estimated using top-hits from a large GWAS performed by the International Genomics of Alzheimer’s Project (IGAP) (Lambert et al. 2013). The GWAS included 25,580 Alzheimer’s diseases cases and 48,786 controls. The 19 most significant SNPs were compiled into a genetic risk score in PLINK (Purcell et al. 2007), by summing the number of risk alleles, weighted by their effect sizes. This standardized PRS has previously been validated in the HRS (Daniel et al. 2013). For our analysis, the two imputed SNPs for APOE are removed in the calculation of the polygenic risk score.
Predicted Dementia Status
Predicted dementia status was estimated for all participants ages 70 and over. It also relied on the four cognitive functioning variables that were used to estimate cognitive aging—delayed recall, immediate recall, serial 7s, and backwards counting. However, in addition, dementia status also took into account proxy responses for participants who were unable to complete the cognitive battery. For those who were able to respond, scores across the four variables were summed. Participants with total score ranging between 12 and 27 were categorized as having normal cognitive functioning, those with scores between 7 and 11 were categorized as having cognitive impairment not demented (CIND). Finally, those with scores of six or less were categorized as having dementia.
Participants whose status relied on proxy respondents were categorized in accordance with established methods (Crimmins et al. 2011). For these participants, cognitive status was based on the sum of scores from three measures that were based on memory assessment by a proxy (0=excellent, 1=very good, 2=good, 3=fair, 4=poor), the participant’s total number of IADL limitations (i.e. using a telephone, taking medication, handling money, shopping, preparing meals), and the interviewer’s assessment of whether the participant had difficulty completing the cognitive battery due to cognitive limitations (0-2 indicating, no limitation, some limitation, and limitation prevents completion, respectively). After these three measures were summed, participants with total score between 0 and 2 were categorized as having normal cognitive functioning, those with scores between 3 and 5 were categorized as having CIND, and those with scores of 6 or over were categorized as demented.
Statistical Analysis
Ordinary least squares regression was used to examine whether sociodemographic characteristics (sex, race/ethnicity, and education), heart disease, diabetes, BMI, APOE ε4, and the PRS are associated with cognitive age level and the rate of change. When comparing differences in level, clustered robust standard errors were used to account for multiple observations. Model 1, which included only sociodemographic and health variables, was estimated in the full sample, while Model 2, included nested Model 1 with the inclusion of genetic factors—APOE and the PRS—was estimated for the genetic sample. When examining the association between cognitive aging (slope) and cardiometabolic health, measures for BMI, heart disease, and diabetes represented those from the earliest wave that was used when estimating the slope for cognitive age. For instance, if a participant had a slope estimated from his/her cognitive ages at waves three through eight, then his/her BMI, and diagnosis of heart disease and/or diabetes only at wave three was used in the model. Finally, we examined the association between dementia status and cognitive slope, adjusting for sociodemographics, cardiometabolic health, and genetic risk factors. In order to do so, a new cognitive age slope was estimated using all data points between waves three and eight. This slope was then used in a logistic regression model to examine its association with transition to dementia—dementia risk at wave nine among participants with no dementia at wave eight. Longitudinal sample weights were applied to all models.
RESULTS
Sample Characteristics
Weighted characteristics for the full sample (n=19,594) and the genetic sample (n=10,784) are shown in Table 1. Females made up approximately 54% of both samples, and the majority of participants in both samples self-identified as Non-Hispanic white (about 82%). About a quarter of participants in the full sample (23.6%) and the genetics sample (26.2%) had a college degree, and another quarter had some college education in both the full (22.9%) and the genetic (24.2%) samples. For the remainder of the full sample, approximately 34.5% had a high school degree or GED and 19% had less than a high school education, while for the remainder of the genetic sample, approximately 34% had a high school degree or GED and 16% had less than a high school education. Just under 2% of participants in the genetic sample had APOE ε4/ε4, while 24.5% had one APOE ε4 allele. Because the PRS was standardized, it had a mean of 0 and standard deviation of 1.
Table 1:
Weighted Sample Characteristics
| Full Sample (N=19,594) | Genetic Sample with APOE (N=10,784) | |
|---|---|---|
| Chronological Age (Years), μ (s.d.) | 66.47 (9.96) | 65.66 (9.51) |
| Cognitive Age (Years), μ (s.d.) | 66.47 (11.58) | 64.36 (10.85) |
| Cognitive Change (Slope), μ (s.d.) | 1.06 (0.80) | 1.00 (0.64) |
| Female, Frequency (%) | 54.51 | 54.08 |
| Non-Hispanic White, Frequency (%) | 82.14 | 82.76 |
| Non-Hispanic Black, Frequency (%) | 9.22 | 8.59 |
| Hispanic, Frequency (%) | 7.00 | 7.08 |
| Other Race/Ethnicity, Frequency (%) | 1.64 | 1.57 |
| Less than High School, Frequency (%) | 18.99 | 15.75 |
| High School / GED, Frequency (%) | 34.48 | 33.88 |
| Some College, Frequency (%) | 22.93 | 24.19 |
| College, Frequency (%) | 23.60 | 26.18 |
| Heart Disease, Frequency (%) | 21.64 | 19.90 |
| Diabetes, Frequency (%) | 16.23 | 15.38 |
| Underweight, Frequency (%) | 0.93 | 0.76 |
| Normal BMI, Frequency (%) | 15.25 | 22.29 |
| Overweight, Frequency (%) | 17.34 | 28.29 |
| Obese, Frequency (%) | 66.48 | 48.65 |
| APOE ε2/ε2, ε2/ε3, or ε3/ε3, Frequency (%) | -- | 73.55 |
| APOE ε2/ε4 or ε2/ε4, Frequency (%) | -- | 24.50 |
| APOE ε4/ε4, Frequency (%) | -- | 1.95 |
Cognitive Age Level and Change
Cognitive age was calculated for each participant at each wave using the approach described in the Methods section. This resulted in three to eight cognitive ages being estimated for each person at different points in their life. For each participant, his/her cognitive ages were used to calculate a cognitive aging slope by fitting a regression for the change in cognitive age as a function of the change in chronological age. As depicted in Figure 1, a slope of 1 suggests a participant’s cognitive aging is changing on-track with his/her chronological age, while a value greater than one signifies that a participant has an accelerated rate of cognitive aging, and a value less than one signifies decelerated cognitive aging.
Figure 1: Distributions and Definitions of Cognitive Age Level and Slope.
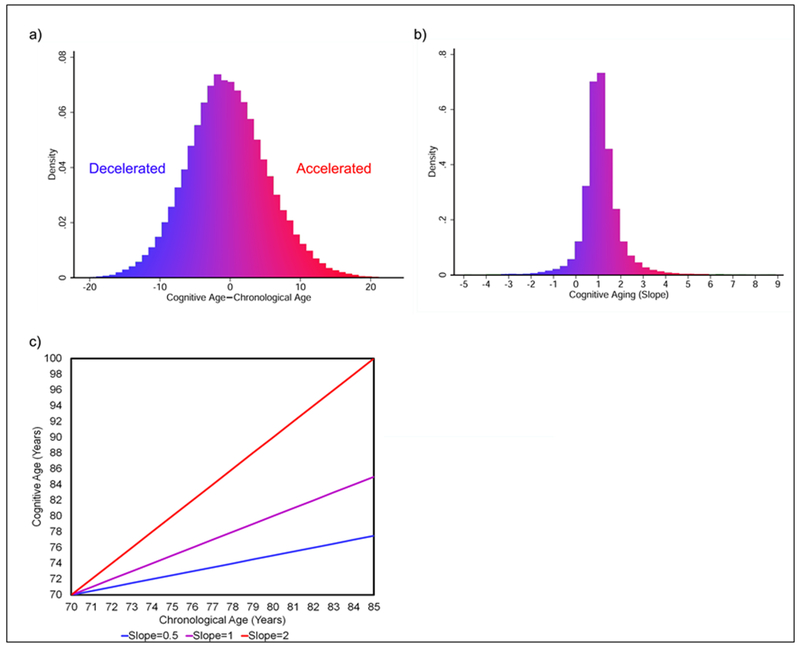
Overall the difference in cognitive and chronological age was fairly normally distributed (Figure 1a), with HRS participants, on average, having cognitive ages equal to their chronological ages. Similarly, most participants’ cognitive age appeared to rise at the same rate as their chronological age, producing a slope equal to one for change in cognitive age over change in chronological age (figure 1b). However, some participants display accelerated cognitive aging rates (slopes greater than one), while others display decelerated cognitive aging rates (slopes less than one). In general, a slope of two suggests a person’s cognitive age is increasing twice as fast as his/her chronological age, while a slope of 0.5 suggests a person’s cognitive age is increasing at half the rate of his/her chronological aging (figure 1c).
Overall, the mean cognitive age of a population should equal the mean chronological age of the population (Klemera and Doubal 2006), and as shown in Figure 1, the mean, median, and mode for the difference in chronological and cognitive age in our sample is zero. Similarly, for the full sample, mean cognitive and chronological age were both 66.47 years; while for the genetic sample, mean chronological age was 65.66 years and mean cognitive age was 64.36 years. Mean cognitive slope was 1.06 for the full sample and 1.00 for the genetic sample—suggesting that on average, change in cognitive age matched change in chronological age. We examined the linearity of the change in cognitive age as a function of the change in chronological age using smoothed spline graphs. Even when allowing for up to 10 breakpoints, the trend remained mostly linear (Figure 2).
Figure 2: Trend in Cognitive Aging versus Chronological Aging.
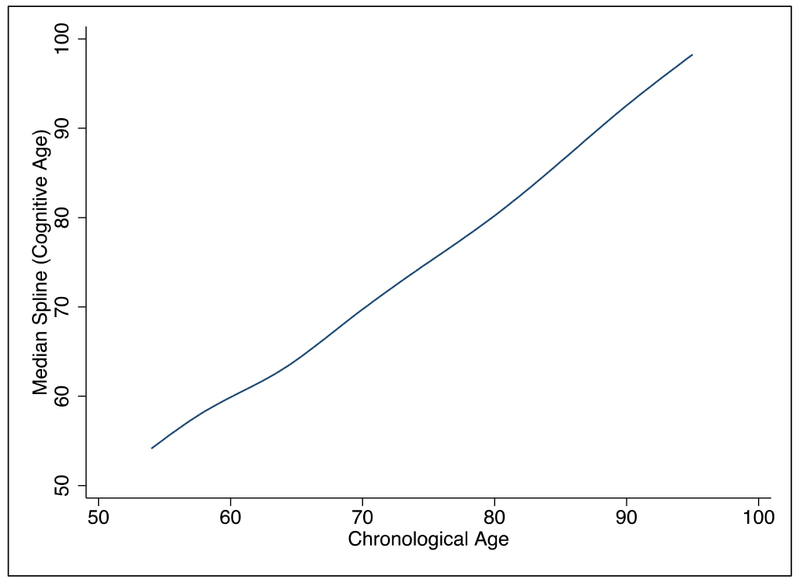
Smoothed spline graphs were used to determine the overall linearity of the change in cognitive age as a function of the change in chronological age within the older HRS population. Even when allowing for up to 10 breakpoints, the trend appears to remained mostly linear.
Just over 1% of cognitive age scores utilized imputed measures. On average, cognitive age scores were 6 years older for imputed observations. However, part of this reflects that older individuals were more likely to have imputed cognitive variables. When considering the difference in cognitive and chronological age, those who were imputed had scores that were on average 2.4 years older than their cognitive ages, while non-imputed observations were on average about equal to chronological age.
Differences in Cognitive Age (Level)
OLS regression with clustered robust standard errors was used to examine whether cognitive age differed by sex, race/ethnicity, education, APOE ε4, and a dementia-related PRS. Results (Table 2) for the full sample showed that, on average, women were 1.8 years younger cognitively than men of the same age (βfemale=−1.79, P<.001). We also found significant differences as a function of race/ethnicity and education. For instance, compared to non-Hispanic whites, non-Hispanic blacks had cognitive ages that were over three years higher than non-Hispanic whites (β=3.06, P<.001), while Hispanics and those of other race/ethnicity had cognitive ages that were over two years higher than non-Hispanic whites (βHispanic=2.10, P<.001; (βOther=2.13, P<.001). Compared to participants with a college education, those with less than a high school degree were over five and a half years older cognitively (β=5.68, P<.001); those with only a high school degree or GED were almost three years older cognitively (β=2.88, P<.001); and those with some college education, but no degree were just over one and a half years older cognitively (β=1.60, P<.001). Participants with heart disease or diabetes were about a half year older, cognitively (βheart=0.50, P<.001; βdiabetes=0.66, P<.001). BMI was also significantly associated with cognitive age, such that higher BMIs appear protective. For instance, participants who were underweight (BMI<18.5) were 0.8 year older than those with a normal (18.5≥ BMI <25) BMI (β=0.80, P<.001), whereas participants who were overweight (25≥ BMI <30) or obese (BMI ≥30) were 0.3 years and 0.2 years younger, respectively, compared to those with a normal BMI (βoverweight=−0.32, P<.001; βobese=−0.18, P=.023). As expected, high chronological age was associated with higher cognitive age, such that for every one-year increase chronologically, on average participants experienced a one year increase cognitively (β=1.00, P<.001).
Table 2:
Cognitive Age (Level) Associations
| Full Sample (n=19,594) | Genetic Sample (n=10,784) | |||||
|---|---|---|---|---|---|---|
| Coef. | Robust SE | P | Coef. | Robust SE | P | |
| Female | −1.79 | 0.066 | <0.001 | −1.77 | 0.083 | <0.001 |
| Race/Ethnicity | ||||||
| (Reference=Non-Hispanic White) | ||||||
| Non-Hispanic Black | 3.06 | 0.103 | <0.001 | 3.05 | 0.141 | <0.001 |
| Hispanic | 2.10 | 0.138 | <0.001 | 2.17 | 0.177 | <0.001 |
| Other | 2.13 | 0.243 | <0.001 | 2.18 | 0.310 | <0.001 |
| Education | ||||||
| (Reference=College) | ||||||
| <HS | 5.68 | 0.107 | <0.001 | 5.42 | 0.139 | <0.001 |
| HS/GED | 2.88 | 0.086 | <0.001 | 2.75 | 0.105 | <0.001 |
| Some College | 1.60 | 0.097 | <0.001 | 1.59 | 0.118 | <0.001 |
| Age | 0.97 | 0.003 | <0.001 | 0.95 | 0.004 | <0.001 |
| Heart Disease | 0.50 | 0.072 | <0.001 | 0.54 | 0.092 | <0.001 |
| Diabetes | 0.66 | 0.082 | <0.001 | 0.72 | 0.104 | <0.001 |
| BMI | ||||||
| (Reference=Normal) | ||||||
| Underweight | 0.80 | 0.218 | <0.001 | 1.28 | 0.315 | <0.001 |
| Overweight | −0.32 | 0.066 | <0.001 | −0.26 | 0.083 | 0.002 |
| Obese | −0.18 | 0.080 | 0.023 | −0.10 | 0.100 | 0.318 |
| APOE ε4 | ||||||
| (Reference=0) | ||||||
| 1 | -- | -- | -- | 0.33 | 0.092 | <0.001 |
| 2 | -- | -- | -- | 0.86 | 0.282 | 0.002 |
| PRS | -- | -- | -- | 0.06 | 0.041 | 0.116 |
Both APOE ε4 and the PRS were added to the model for the genetic sample. Overall, the majority of the associations from the initial model remained unchanged. The only result that was notably changed was the association between cognitive age and BMI, such that being obese was no longer protective (β=−0.10, P=.318). Regarding the genetic associations, results showed that having one APOE ε4 allele was associated with a 1/3 year increase in cognitive age (β=0.33, P<.001), while having two APOE ε4 alleles was associated with a 0.9 year increase in cognitive age (β=0.86, P=.002). On the other hand, the PRS was not associated with cognitive age (β=0.06, P=0.116).
Age stratified Associations with Cognitive Age (Level)
Age-stratified models were used to provide insight on whether mortality selection (attenuation of associations with age) impacted the association with cognitive age, or whether there was evidence of differences in the rate of cognitive aging (divergence, or increased associations with age) as a function of sociodemographic, cardiometabolic, or genetic factors (Domingue et al. 2016). Results shown in Figure 3, suggest that the size of the associations with cognitive age appear relatively stable over the age groups for sex, Non-Hispanic black race-ethnicity, underweight BMI, heart disease, diabetes, and PRS. Conversely, differences by education, particularly the lowest SES group appear to decrease with age, suggesting that mortality selection may play a role—low educated individuals with worse cognitive function are more likely to die and thus at older ages those with low education may represent a more resilient sub-population. For instance, among participants ages 50-59, those with less than a high school education were about six years older cognitively than those with a college degree. However, among participants ages 80+, those with less than a high school education were only about four years older cognitively than those with a college degree. Conversely, results also suggest that being obese is only protective for cognitive age in the oldest-old, whereas, for younger participants being obese appears to increase cognitive age. Finally, the association between APOE ε4 and cognitive age tends to increase with age, suggesting that the cognitive functioning of homozygous APOE ε4 carriers tends to diverge from non ε4 carriers as individuals move into their seventh or eighth decade of life. Further, this indicates that APOE ε4 may impact the rate of cognitive aging (slope), in addition to the level.
Figure 3: Age-Stratified Associations between Cognitive Age and Sociodemographic, Metabolic, and Genetic Factors.

Associations between cognitive age and sex (figure 2a), race/ethnicity (figure 2c), underweight BMI (figure 2d), heart disease (figure 2e), and PRS (figure 2h) did not differ systematically by age. However, education appeared to exhibit a diminishing association with cognitive age in later life, suggesting the possibility of mortality selection (figure 2b)—under educated individuals with high cognitive ages are more likely to be removed from the population by mortality prior to reaching old age. Conversely, the associations with cognitive age for APOE ε4 (figure 2g) and diabetes (figure 2f), increase with age, suggesting that the rate of cognitive aging may differ as a function of APOE ε4 or diabetes status, creating a growing divergence in cognitive functioning over time. Finally, Obesity appears to have differential associations by age (figure 2d). For instance, in middle age it is associated with a higher cognitive age, compared to the cognitive ages of those with normal BMI, whereas at older ages, obese individuals appear to have lower cognitive ages than persons with normal BMI—suggesting that among older adults, a higher BMI is protective.
Differences in Cognitive Aging (Slope)
To further test whether sociodemographic or genetics factors were associated with change in cognitive functioning, rather than just the level, we examined their relationship with a longitudinal measure of the slope from a regression line of cognitive age as a function of chronological age (Table 3). Results from the full sample showed no association between cognitive aging sex or heart disease. However, individuals with less than a high school degree appeared to have greater declines in cognitive functioning than those with a college degree (β=0.04, P=0.042). Similarly, diabetes prevalence at baseline was associated with steeper subsequent decline in cognitive functioning (β=0.06, P=0.010). Hispanics also appeared to have slower rates of declines relative to Non-Hispanic whites (β=−0.08, P=0.001), as did individuals who were obese, relative to normal weight (β=−0.05, P=0.002). Similar results were found for education and diabetes when examined using the genetic sample, while obese BMI (β=−0.03, P=0.095) and Non-Hispanic race/ethnicity (β=−0.04, P=0.139) were no longer related to the slope. Additionally, we found that both APOE ε4 and the PRS were associated with differences in the cognitive aging slope. For instance, results suggest that with every decade the difference in cognitive age would increase by about 0.8 years for APOE ε4 heterozygous carriers (β=0.08, P<.001) and by 1.8 years for APOE ε4 homozygous carriers (β=0.18, P<.001), in comparison to non-ε4 carriers. This is consistent with our prior results showing diverging cognitive age levels by APOE ε4 status. Similarly, a one standard deviation increase in the PRS was associated a further increase of 0.13 years in cognitive age with every decade (β=0.01, P=.036).
Table 3:
Cognitive Aging (Slope) Associations
| Full Sample (n=19,594) | Genetic Sample (n=10,784) | |||||
|---|---|---|---|---|---|---|
| Coef. | SE | P | Coef. | Robust SE | P | |
| Female | 0.02 | 0.012 | 0.072 | 0.00 | 0.013 | 0.966 |
| Race/Ethnicity | ||||||
| (Reference=Non-Hispanic White) | ||||||
| Non-Hispanic Black | 0.01 | 0.020 | 0.758 | 0.01 | 0.024 | 0.558 |
| Hispanic | −0.08 | 0.024 | 0.001 | −0.04 | 0.026 | 0.139 |
| Other | −0.05 | 0.045 | 0.247 | 0.07 | 0.051 | 0.160 |
| Education | ||||||
| (Reference=College) | ||||||
| <HS | 0.04 | 0.019 | 0.023 | 0.04 | 0.022 | 0.042 |
| HS/GED | 0.03 | 0.016 | 0.089 | 0.03 | 0.017 | 0.054 |
| Some College | 0.03 | 0.017 | 0.070 | 0.01 | 0.018 | 0.780 |
| Mean Age Across Waves | 0.02 | 0.001 | <0.001 | 0.01 | 0.004 | <0.001 |
| Baseline Heart Disease | 0.00 | 0.017 | 0.854 | −0.01 | 0.020 | 0.461 |
| Baseline Diabetes | 0.06 | 0.020 | 0.002 | 0.06 | 0.022 | 0.010 |
| Baseline BMI | ||||||
| (Reference=Normal) | ||||||
| Underweight | 0.02 | 0.057 | 0.683 | 0.11 | 0.075 | 0.154 |
| Overweight | −0.02 | 0.014 | 0.140 | 0.00 | 0.015 | 0.992 |
| Obese | −0.05 | 0.016 | 0.001 | −0.03 | 0.017 | 0.095 |
| APOE ε4 | ||||||
| (Reference=0) | ||||||
| 1 | -- | -- | -- | 0.08 | 0.014 | <0.001 |
| 2 | -- | -- | -- | 0.18 | 0.045 | <0.001 |
| PRS | -- | -- | -- | 0.01 | 0.006 | 0.036 |
Dementia Prediction
To examine whether cognitive aging (slope) was predictive of transition to dementia status, we recalculated the slope using only waves three through eight and then included only subjects who were not demented at wave eight in a logistic regression model to predict dementia status at wave nine. As shown in Table 4, after adjusting for sociodemographic and cardiometabolic factors, we find that for every one unit increase in the slope, there is a 33% increase in the likelihood that a non-demented participant will develop dementia (OR=1.33, P=.011). A similar result was found in the genetic sample (OR=1.33, P=.046), with the inclusion of APOE and PRS as additional covariates. Furthermore, as expected, lower education, being a race/ethnic minority, older age, diabetes, being underweight, and APOE ε4 homozygous were associated with increased risk of developing dementia.
Table 4:
Dementia Transition Prediction
| Full Sample (n=10,068) | Genetic Sample (n=7,595) | |||
|---|---|---|---|---|
| Odds Ratio | P | Odds Ratio | P | |
| Cognitive Aging Slope | 1.33 | 0.011 | 1.33 | 0.046 |
| Female | 0.94 | 0.675 | 0.99 | 0.962 |
| Race/Ethnicity | ||||
| (Reference=Non-Hispanic White) | ||||
| Non-Hispanic Black | 2.50 | <0.001 | 2.26 | 0.001 |
| Hispanic | 2.25 | <0.001 | 2.68 | <0.001 |
| Other | 1.95 | 0.200 | 3.37 | 0.044 |
| Education | ||||
| (Reference=College) | ||||
| <HS | 7.76 | <0.001 | 7.18 | <0.001 |
| HS/GED | 2.91 | <0.001 | 2.90 | 0.001 |
| Some College | 1.88 | 0.043 | 1.73 | 0.137 |
| Age Wave 8 | 1.09 | <0.001 | 1.10 | <0.001 |
| Heart Disease Wave 8 | 1.32 | 0.065 | 1.31 | 0.141 |
| Diabetes Wave 8 | 1.38 | 0.049 | 1.53 | 0.032 |
| BMI Wave 8 | ||||
| (Reference=Normal) | ||||
| Underweight | 2.38 | 0.019 | 3.11 | 0.009 |
| Overweight | 0.82 | 0.204 | 0.80 | 0.230 |
| Obese | 0.93 | 0.670 | 0.82 | 0.374 |
| APOE ε4 | ||||
| (Reference=0) | ||||
| 1 | -- | -- | 1.40 | 0.063 |
| 2 | -- | -- | 4.90 | <0.001 |
| PRS | -- | -- | 0.94 | 0.489 |
DISCUSSION
This paper introduces an easily interpretable composite measure of cognitive age, for which the level and change can be contrasted against chronological age to characterize individuals with accelerated decline. One advantage of the measure is that it can be utilized in both cross-sectional and longitudinal studies, allowing for examination of cognitive function by both level and change. This is noteworthy given that our findings reveal different conclusions as they relate to levels versus slopes of cognitive age, with more pronounced differences across sociodemographic groups for absolute levels of cognitive decline rather than for rates of declines.
For instance, on average, we find that cognitive age is approximately 1.8 years lower for women relative to men, although both sexes appear to decline at the same rate. Similarly, racial/ethnic minorities appear to by cognitively older than Non-Hispanic whites, such that on average Non-Hispanic blacks tend to have the cognitive functioning of Non-Hispanic whites that are three years older, while Hispanics to have the cognitive functioning of Non-Hispanic whites that are two years older. Our cross-sectional findings are consistent with the current literature consistently suggesting that Non-Hispanic blacks and Hispanics have an increased risk of dementia and AD prevalence and incidence compared to Non-Hispanic whites (Manley and Mayeux 2004). Nevertheless, our longitudinal results also suggest that Non-Hispanic blacks do not decline at a faster rate than Non-Hispanic whites, and if anything, the rate of decline for Hispanics appears slower than that of Non-Hispanic whites. Taken together, this could theoretically explain the higher incidence of dementia among minorities, if regardless of experiencing similar rates of decline to whites, black and Hispanic individuals start off with worse cognitive functioning and therefore cross-over into the threshold for dementia sooner. Thus, the observed disparities in trajectories of cognition may be more a function of different starting points and less about differential declines themselves.
Like race/ethnicity, SES, as measured by education, also displayed a striking gradient in the level of cognitive age. Overall, years of education appeared to relate to cognitive age in a dose-dependent manner. On average, when compared to college educated individuals, those with only some college were about one and a half years older cognitively, those with a high school degree or GED equivalent were just under three years older cognitively, and those with less than a high school education were about five and a half years older cognitively. However, our results also suggested that individuals with the lowest education experienced steeper cognitive declines, contributing to a growing divergence in cognitive functioning with age. For instance, with every year, the difference in cognitive age between those with college degrees and those with less than a high school degree grew by an additional 0.04 years. This suggests that by age 80, the gap between the cognitive age for the most educated and the least educated will increase by an additional 1.2 years, compared to what it was at age 50.
Interestingly, when examining SES-related differences cross-sectionally by age category, we observe a very different pattern than what is seen for the longitudinal analysis. According to these results, the differences in cognitive age by education are smaller at older ages than the differences at younger ages. These findings highlight the importance of being able to examine an easily interpretable measure both cross-sectionally and longitudinally. What this suggests is that on average cognitive aging may happen at a faster rate for low SES individuals, but that the composition of the SES groups may also change over time, such that mortality is selecting out the most frail among the low SES group and those that remain in the population at age 80, may represent a more resilient sub-population (Levine and Crimmins 2014; Vaupel and Yashin 1985; Yashin, Manton and Vaupel 1985; Yashin et al. 2002).
While not directly tested in this study, one hypothesis for differences in frailty/resilience, also known as hidden heterogeneity, is that some individuals may possess genetic variants that confer protection under from stressful environments (Levine and Crimmins 2015; Yashin et al. 2013). Similar to what has been shown in the literature, allelic variations in the APOE gene strongly relate to differences in cognitive age. Results from our cross-sectional, age-stratified, and longitudinal models suggest that individuals with APOE ε4 alleles, have higher cognitive ages on average, these deficits increase at older ages, and they experience steeper individual-level declines. For example, our results suggest that there is relatively no difference in cognitive age by APOE ε4 for individuals ages 50-59. However, between ages 60-69, those with two APOE ε4 alleles are about 0.7 years older cognitively than those with no APOE ε4 alleles. Furthermore, this increases to about a two-year difference in cognitive age by APOE ε4 for those ages 70-79, and an almost two and a half year difference in cognitive age for those age 80 and above. This is consistent with earlier reports as well as with our longitudinal results suggesting that those with two APOE ε4 alleles decline at a faster rate, such that with every year they experience an additional 0.18 year increase in their cognitive age, relative to individuals with no APOE ε4 allele (Caselli et al. 2009). Similar to APOE, the PRS also displayed an association with cognitive decline. While a higher PRS was not associated with a higher cognitive age (level), for every one standard deviation increase in the PRS an individual was predicted to have an additional 0.013 year increase in cognitive age with every one year increase in their chronological age.
Cardiometabolic factors also related to cognitive age. On average, having diabetes, having heart disease, and/or being underweight was associated with higher cognitive ages. Conversely, being overweight appeared protective for cognitive age levels. The findings for BMI further suggest that increased weight is only protective at older ages. This is consistent with recent evidence showing that being underweight or obese in mid-life increases dementia risk later in life (Whitmer et al. 2005, 2007); however, ironically in older adults, higher BMI is typically associated with better cognitive functioning and lower dementia risk (Suemoto et al. 2015; Hughes et al. 2009). One explanation is that the protective effects of BMI at older ages may reflect aging-related changes in body composition—higher weight at older ages may signal retention of lean body mass and avoidance of sarcopenia, which is a risk factor for cognitive decline (Kalyani, Corriere and Ferrucci 2014; Levine and Crimmins 2012). Nevertheless, only diabetes was related to the slope for cognitive aging in both the full sample and the genetic sample, suggesting that having diabetes at baseline was associated with an acceleration in the rate of cognitive aging as a function of chronological aging.
Finally, in addition to associations with sociodemographic, genetic, and cardiometabolic factors, our results also suggest that our measure of cognitive aging (slope) predicts transition to dementia status. For instance, we found that among those without dementia by wave eight of the HRS, having a one unit higher cognitive aging slope between waves three through eight was associated with a 33% increase in the likelihood that an individual will be categorized as having dementia at wave nine. This suggests that this measure may facilitate identification of at-risk individuals above and beyond what can be assumed from their other characteristics. Nevertheless, there are limitations to the study which we need to address. First, the cognitive assessments in the HRS are a combination of direct interview responses, as well as imputed cognitive measures for respondents who are unable to self-respond to the interview. The cognitive tasks included in the cognitive age measure included imputed data, given that these variables were likely not missing at random and instead may represent those with more serious forms of cognitive decline or dementia. Given the possibility that imputed variables could alter our findings, we performed sensitivity analysis, in which we excluded imputed observations and found our results to be unchanged. Relatedly, given the constraints of conducting a cognitive assessment in such a large longitudinal cohort study, the HRS battery is not inclusive of all cognitive domains that show declines with normal and/or pathological aging. For instance, it does not adequately assess response speed, executive functioning, or information processing.
Secondly, there is evidence that the genetic subsample from the HRS may differ from the full sample due to mortality selection and that genetic samples (Domingue et al. 2017). As such, the results shown for the genetic subsample might be biased downward because of the nature of selection in the sample. Third, in order to retain the interpretability of our measure, non-linear modeling of cognitive aging was not attempted. We acknowledge that many of the cognitive measures that went into the cognitive age variable show non-linear change with age. Nevertheless, we find that on average the composite cognitive age measure does appear to change linearly with chronological age in our population (Figure 2). Finally, given the changing demographic of the U.S. population, we cannot generalize our findings to what might be experienced by future cohorts. Younger generations are acquiring higher levels of education, but at the same time, what the educational degrees represent may also change over time (Lynch 2003). Moreover, the composition and characteristics of racial/minorities groups are changing, suggesting that these results could vary for younger generations, particularly of Hispanics (Downer et al. 2018).
Overall, this study presents a measure that can be used to assess cognitive aging in human populations. We have provided evidence that our measure relates to race/ethnicity, education, APOE, and cardiometabolic factors in a manner that is consistent with the current literature and that would thus be expected of a proxy for the cognitive aging process. Further, this measure benefits from being highly interpretable, and also applicable to studies of cognitive functioning cross-sectionally, as well as those examining longitudinal cognitive decline over the lifespan. In moving forward, this measure can facilitate the examination of the complex biological and social/behavioral dynamics which are believed to influence the human aging process in the brain.
References
- Bäckman L, Small BJ, & Wahlin Å 2001. Aging and memory: Cognitive and biological perspectives Handbook of the Psychology of Aging, ed. Birren JE & Schaie KW, 349–377. San Diego, CA, US: Academic Press. [Google Scholar]
- Brayne C and Calloway P, 1990. The association of education and socioeconomic status with the Mini Mental State Examination and the clinical diagnosis of dementia in elderly people. Age and Ageing, 19(2), pp.91–96. [DOI] [PubMed] [Google Scholar]
- Domingue BW, Belsky DW, Harrati A, Conley D, Weir DR, Boardman JD. 2017. Mortality selection in a genetic sample and implications for association studies. International Journal of Epidemiology, 46(4), pp.1285–1294.. [DOI] [PMC free article] [PubMed] [Google Scholar]
- Cagney KA and Lauderdale DS, 2002. Education, wealth, and cognitive function in later life. The Journals of Gerontology Series B : Psychological Sciences and Social Sciences, 57(2), pp.P163–P172. [DOI] [PubMed] [Google Scholar]
- Caselli RJ, Dueck AC, Osborne D, Sabbagh MN, Connor DJ, Ahern GL, Baxter LC, Rapcsak SZ, Shi J, Woodruff BK, Locke DEC, Snyder CH, et al. , 2009. Longitudinal modeling of age-related memory decline and the APOE ε4 effect. New England Journal of Medicine, 361(3), pp. 255–263. [DOI] [PMC free article] [PubMed] [Google Scholar]
- Craft S 2005. Insulin resistance syndrome and Alzheimer’s disease: age- and obesity-related effects on memory, amyloid, and inflammation. Neurobiology of Aging, 26 Suppl 1: p. 65–9. [DOI] [PubMed] [Google Scholar]
- Crimmins EM, Kim JK, Langa KM and Weir DR, 2011. Assessment of cognition using surveys and neuropsychological assessment: the Health and Retirement Study and the Aging, Demographics, and Memory Study. Journals of Gerontology Series B: Psychological Sciences and Social Sciences, 66(suppl_1), pp. i162–i171. [DOI] [PMC free article] [PubMed] [Google Scholar]
- Cukierman T, Gerstein HC and Williamson JD, 2005. Cognitive decline and dementia in diabetes--systematic overview of prospective observational studies. Diabetologia, 48(12), pp.2460–2469. [DOI] [PubMed] [Google Scholar]
- Crimmins EM, Kim JK, Langa KM and Weir DR, 2011. Assessment of cognition using surveys and neuropsychological assessment: the Health and Retirement Study and the Aging, Demographics, and Memory Study. Journals of Gerontology Series B: Psychological Sciences and Social Sciences, 66(suppl_1), pp.i162–i171. [DOI] [PMC free article] [PubMed] [Google Scholar]
- Daniel J, Walter S, Tchetgen EJ, Kawachi I and Glymour MM, 2013. Validation of a polygenic risk score for dementia in the Health and Retirement Study. Alzheimer’s & Dementia: The Journal of the Alzheimer’s Association, 9(4), p.P172. [Google Scholar]
- Deary IJ, Corley J, Gow AJ, Harris SE, Houlihan LM, Marioni RE, Penke L, Rafnsson SB and Starr JM, 2009. Age-associated cognitive decline. British Medical Bulletin, 92(1), pp.135–152. [DOI] [PubMed] [Google Scholar]
- Domingue BW, Belsky DW, Harrati A, Conley D, Weir DR and Boardman JD, 2017. Mortality selection in a genetic sample and implications for association studies. International Journal of Epidemiology, 46(4), pp.1285–1294. [DOI] [PMC free article] [PubMed] [Google Scholar]
- Downer B, Garcia MA, Raji M and Markides KS, 2018. Cohort Differences in Cognitive Impairment and Cognitive Decline among Mexican-Americans Aged 75 and Older. American Journal of Epidemiology. [DOI] [PMC free article] [PubMed] [Google Scholar]
- Escott-Price V, Sims R, Harold D, Vronskaya M, Holmans P and Williams J, 2015. Using polygenic risk score to predict Alzheimer’s disease. Alzheimer’s & Dementia: The Journal of the Alzheimer’s Association, 11(7), p.P872. [Google Scholar]
- Evans DA, Beckett LA, Albert MS, Hebert LE, Scherr PA, Funkenstein HH and Taylor JO, 1993. Level of education and change in cognitive function in a community population of older persons. Annals of Epidemiology, 3(1), pp.71–77. [DOI] [PubMed] [Google Scholar]
- Evans DA, Hebert LE, Beckett LA, Scherr PA, Albert MS, Chown MJ, Pilgrim DM and Taylor JO, 1997. Education and other measures of socioeconomic status and risk of incident Alzheimer disease in a defined population of older persons. Archives of Neurology, 54(11), pp.1399–1405. [DOI] [PubMed] [Google Scholar]
- Farrer LA, Cupples LA, Haines JL, Hyman B, Kukull WA, Mayeux R, Myers RH, Pericak-Vance MA, Risch N and Van Duijn CM, 1997. Effects of age, sex, and ethnicity on the association between apolipoprotein E genotype and Alzheimer disease: a meta-analysis. Journal of the American Medical Association, 278(16), pp.1349–1356. [PubMed] [Google Scholar]
- Gatz M, Pedersen NL, Berg S, Johansson B, Johansson K, Mortimer JA, Posner SF, Viitanen M, Winblad B and Ahlbom A, 1997. Heritability for Alzheimer’s disease: the study of dementia in Swedish twins. The Journals of Gerontology Series A: Biological Sciences and Medical Sciences, 52(2), pp.M117–M125. [DOI] [PubMed] [Google Scholar]
- Fisher GG, Hassan H, Faul JD, Rodgers WL, and Weir DR, 2017. Health and Retirement Study Imputation of Cognitive Functioning Measures: 1992 – 2014. Ann Arbor: University of Michigan. [Google Scholar]
- Haring B, Leng X, Robinson J, Johnson KC, Jackson RD, Beyth R, Wactawski‐Wende J, von Ballmoos MW, Goveas JS, Kuller LH and Wassertheil‐Smoller S, 2013. Cardiovascular Disease and Cognitive Decline in Postmenopausal Women: Results from the Women’s Health Initiative Memory Study. Journal of the American Heart Association, 2(6), p.e000369. [DOI] [PMC free article] [PubMed] [Google Scholar]
- Hughes TF, Borenstein AR, Schofield E, Wu Y and Larson EB, 2009. Association between late-life body mass index and dementia: The Kame Project. Neurology, 72(20), pp.1741–1746. [DOI] [PMC free article] [PubMed] [Google Scholar]
- Kalyani RR, Corriere M and Ferrucci L, 2014. Age-related and disease-related muscle loss: the effect of diabetes, obesity, and other diseases. The Lancet Diabetes & Endocrinology, 2(10), pp.819–829. [DOI] [PMC free article] [PubMed] [Google Scholar]
- Klemera P and Doubal S, 2006. A new approach to the concept and computation of biological age. Mechanisms of Ageing and Development, 127(3), pp.240–248. [DOI] [PubMed] [Google Scholar]
- Lambert JC, Ibrahim-Verbaas CA, Harold D, Naj AC, Sims R, Bellenguez C, Jun G, DeStefano AL, Bis JC, Beecham GW and Grenier-Boley B, 2013. Meta-analysis of 74,046 individuals identifies 11 new susceptibility loci for Alzheimer’s disease. Nature Genetics, 45(12), p.1452. [DOI] [PMC free article] [PubMed] [Google Scholar]
- Langa KM, Larson EB, Crimmins EM, Faul JD, Levine DA, Kabeto MU and Weir DR, 2017. A comparison of the prevalence of dementia in the United States in 2000 and 2012. Journal of the American Medical Association Internal Medicine, 177(1), pp.51–58. [DOI] [PMC free article] [PubMed] [Google Scholar]
- Langa KM, Larson EB, Karlawish JH, Cutler DM, Kabeto MU, Kim SY and Rosen AB, 2008. Trends in the prevalence and mortality of cognitive impairment in the United States: is there evidence of a compression of cognitive morbidity? Alzheimer’s & Dementia, 4(2), pp.134–144. [DOI] [PMC free article] [PubMed] [Google Scholar]
- Leritz EC, McGlinchey RE, Kellison I, Rudolph JL and Milberg WP, 2011. Cardiovascular disease risk factors and cognition in the elderly. Current cardiovascular risk reports, 5(5), p.407. [DOI] [PMC free article] [PubMed] [Google Scholar]
- Levine ME and Crimmins EM, 2012. Sarcopenic obesity and cognitive functioning: the mediating roles of insulin resistance and inflammation? Current Gerontology and Geriatrics Research, 2012. [DOI] [PMC free article] [PubMed] [Google Scholar]
- Levine ME, 2012. Modeling the rate of senescence: can estimated biological age predict mortality more accurately than chronological age? Journals of Gerontology Series A: Biomedical Sciences and Medical Sciences, 68(6), pp.667–674. [DOI] [PMC free article] [PubMed] [Google Scholar]
- Levine M and Crimmins E, 2014. Not all smokers die young: a model for hidden heterogeneity within the human population. PloS One, 9(2), p.e87403. [DOI] [PMC free article] [PubMed] [Google Scholar]
- Levine ME and Crimmins EM, 2015. A genetic network associated with stress resistance, longevity, and cancer in humans. Journals of Gerontology Series A: Biomedical Sciences and Medical Sciences, 71(6), pp.703–712. [DOI] [PMC free article] [PubMed] [Google Scholar]
- Liu CC, Kanekiyo T, Xu H and Bu G, 2013. Apolipoprotein E and Alzheimer disease: risk, mechanisms and therapy. Nature Reviews Neurology, 9(2), p.106. [DOI] [PMC free article] [PubMed] [Google Scholar]
- Luchsinger JA, Tang MX, Stern Y, Shea S and Mayeux R, 2001. Diabetes mellitus and risk of Alzheimer’s disease and dementia with stroke in a multiethnic cohort. American Journal of Epidemiology, 154(7), pp.635–641. [DOI] [PubMed] [Google Scholar]
- Luchsinger JA and Gustafson DR, 2009. Adiposity, Type 2 diabetes, and Alzheimer’s disease. Journal of Alzheimer’s Disease, 16(4), pp.693–704. [DOI] [PMC free article] [PubMed] [Google Scholar]
- Lynch SM, 2003. Cohort and life-course patterns in the relationship between education and health: A hierarchical approach. Demography, 40(2), pp.309–331. [DOI] [PubMed] [Google Scholar]
- Marden JR, Walter S, Tchetgen Tchetgen EJ, Kawachi I and Glymour MM, 2014. Validation of a polygenic risk score for dementia in black and white individuals. Brain and Behavior, 4(5), pp.687–697. [DOI] [PMC free article] [PubMed] [Google Scholar]
- Manley J and Mayeux R, 2004. Ethnic Differences in Dementia and Alzheimer’s Disease. In National Research Council and Committee on Population, 2004. Critical Perspectives on Racial and Ethnic Differences in Health in Late Life. National Academies Press, pp. 95–142. [Google Scholar]
- Profenno LA, Porsteinsson AP and Faraone SV, 2010. Meta-analysis of Alzheimer’s disease risk with obesity, diabetes, and related disorders. Biological Psychiatry, 67(6), pp.505–512. [DOI] [PubMed] [Google Scholar]
- Purcell S, Neale B, Todd-Brown K, Thomas L, Ferreira MA, Bender D, Maller J, Sklar P, De Bakker PI, Daly MJ and Sham PC, 2007. PLINK: a tool set for whole-genome association and population-based linkage analyses. The American Journal of Human Genetics, 81(3), pp.559–575. [DOI] [PMC free article] [PubMed] [Google Scholar]
- Ridge PG, Mukherjee S, Crane PK and Kauwe JS, 2013. Alzheimer’s disease: analyzing the missing heritability. PloS One, 8(11), p.e79771. [DOI] [PMC free article] [PubMed] [Google Scholar]
- Seshadri S, Beiser A, Kelly-Hayes M, Kase CS, Au R, Kannel WB and Wolf PA, 2006. The lifetime risk of stroke: estimates from the Framingham Study. Stroke, 37(2), pp.345–350. [DOI] [PubMed] [Google Scholar]
- Singh-Manoux A, Kivimaki M, Glymour MM, Elbaz A, Berr C, Ebmeier KP, Ferrie JE and Dugravot A, 2012. Timing of onset of cognitive decline: results from Whitehall II prospective cohort study. British Medical Journal, 344, p.d7622. [DOI] [PMC free article] [PubMed] [Google Scholar]
- Smith C, Graham DI, Murray LS, Stewart J and Nicoll JAR, 2006. Association of APOE e4 and cerebrovascular pathology in traumatic brain injury. Journal of Neurology, Neurosurgery & Psychiatry, 77(3), pp.363–366. [DOI] [PMC free article] [PubMed] [Google Scholar]
- Sonnega A, Faul JD, Ofstedal MB, Langa KM, Phillips JW and Weir DR, 2014. Cohort profile: The health and retirement study (HRS). International Journal of Epidemiology, 43(2), pp.576–585. [DOI] [PMC free article] [PubMed] [Google Scholar]
- Sperling RA, Aisen PS, Beckett LA, Bennett DA, Craft S, Fagan AM, Iwatsubo T, Jack CR Jr, Kaye J, Montine TJ and Park DC, 2011. Toward defining the preclinical stages of Alzheimer’s disease: Recommendations from the National Institute on Aging Alzheimer’s Association workgroups on diagnostic guidelines for Alzheimer’s disease. Alzheimer’s and Dementia, 7(3), pp.280–292. [DOI] [PMC free article] [PubMed] [Google Scholar]
- Suemoto CK, Gilsanz P, Mayeda ER and Glymour MM, 2015. Body mass index and cognitive function: the potential for reverse causation. International Journal of Obesity, 39(9), p.1383. [DOI] [PMC free article] [PubMed] [Google Scholar]
- Vaupel JW and Yashin AI, 1985. Heterogeneity’s ruses: some surprising effects of selection on population dynamics. The American Statistician, 39(3), pp.176–185. [PubMed] [Google Scholar]
- Watson GS and Craft S, 2003. The role of insulin resistance in the pathogenesis of Alzheimer’s disease. CNS Drugs, 17(1), pp.27–45. [DOI] [PubMed] [Google Scholar]
- Whitmer RA, Gunderson EP, Barrett-Connor E, Quesenberry CP and Yaffe K, 2005. Obesity in middle age and future risk of dementia: a 27 year longitudinal population based study. British Medical Journal, 330(7504), p.1360. [DOI] [PMC free article] [PubMed] [Google Scholar]
- Whitmer RA, Gunderson EP, Quesenberry CP, Zhou J and Yaffe K, 2007. Body mass index in midlife and risk of Alzheimer disease and vascular dementia. Current Alzheimer Research, 4(2), pp.103–109. [DOI] [PubMed] [Google Scholar]
- Yashin AI, Manton KG and Vaupel JW, 1985. Mortality and aging in a heterogeneous population: a stochastic process model with observed and unobserved variables. Theoretical Population Biology, 27(2), pp.154–175. [DOI] [PubMed] [Google Scholar]
- Yashin AI, Ukraintseva SV, Boiko SI and Arbeev KG, 2002. Individual aging and mortality rate: how are they related? Social Biology, 49(3-4), pp.206–217. [DOI] [PubMed] [Google Scholar]
- Yashin AI, Arbeev KG, Wu D, Arbeeva LS, Kulminski A, Akushevich I, Culminskaya I, Stallard E and Ukraintseva S, 2013. How lifespan associated genes modulate aging changes: lessons from analysis of longitudinal data. Frontiers in Genetics, 4, p.3. [DOI] [PMC free article] [PubMed] [Google Scholar]