Abstract
Ultra-sensitive detection of proteins is of great importance to proteomics studies. We report here a method to enhance detection sensitivity in surface plasmon resonance (SPR) spectroscopy by coupling a polymerization initiator to a biospecific interaction and inducing inline atom transfer radical polymerization (ATRP) for amplifying SPR response. Bacterial cholera toxin (CT) is chosen as the model protein that has been covalently immobilized on the surface for demonstrating the principle. The specific recognition is achieved by use of biotinylated anti-CT, which allows initiators with a biotin tag to be fixed at the protein binding site through a neutravidin bridge and triggers the localized growth of polymer brushes of poly(hydroxyl-ethyl methacrylate) (PHEMA) via an ATRP mechanism. To further enhance the signal, a second ATRP reaction is conducted that takes advantage of the hydroxyl groups of PHEMA brushes from the first step to form hyper-branched polymers onto the sensing surface. The two consecutive ATRP steps significantly improve SPR detection, allowing low amounts of CT that yield no direct measurement to be quantified with large signals. The resulting polymer film has been characterized by optical and atomic force microscopy. Ascorbic acid (AA) is employed as deoxygen reagent in the catalyst mixture that effectively suppresses oxygen interference, shortening the reaction time and making it possible for applying this ATRP approach to flow injection based SPR detection. A calibration curve of PHEMA amplification for CT detection based on surface coverage has been obtained that displays a correlation in a range from 8.23 × 10⁻¹⁵ mol/cm2 to 3.61 × 10⁻¹² mol/cm2 with a limit of detection of 6.27 × 10⁻¹⁵ mol/cm2. The versatile biotin-neutravidin interaction used here should allow adaptation of ATRP enhancement to many other systems that include DNA, RNA, peptides, and carbohydrates, opening new avenues for ultra-sensitive analysis of biomolecules with flow-injection assay and SPR spectroscopy.
Introduction
Surface plasmon resonance (SPR) has been widely used as a powerful analytical technique for study of a broad range of biomolecular interactions1–6. Label-free and capable of real-time detection, SPR allows for measurement of analyte concentration and binding kinetics7 in a fast, convenient, and nondestructive fashion. Recently, spectroscopic SPR and a closely related technique, imaging SPR, have been further adapted as affinity detection techniques in proteomic and genomics field, especially in protein conformation study8, biomarker profiling, aptamer selections9 and antibody selections10, which have produced high affinity ligands that specifically recognize protein targets. Using the nondestructive nature of the method, captured proteins and tissue extracts11 on a SPR sensing surface have been subjected to mass spectrometric analysis with and without elution of bound material, showing potential of developing hyphenated techniques with SPR.12 In both spectroscopic and imaging SPR, the detection of analytes and analyte interactions on a functionalized surface is achieved through monitoring, via the aid of optical couplers, of the changes of the film thickness and refractive index due to biomolecular binding. The Kretchmann configuration of SPR, which is the most widely employed setup, utilizes a thin (approximately 50 nm) layer of a noble metal (usually gold) deposited on a glass substrate that is attached to a prism13. This arrangement offers the convenience of generating surface plasmons with simple optical components but also presents the physical limitations for performing ultrasensitive detection. As a result, one of the fundamental issues impeding the further development of SPR application in proteomics is the lack of sufficient sensitivity to reliably detect low-abundant, trace amount of proteins, especially those in complex biological solutions where there is a huge excess of interference proteins present. The ability to carry out highly sensitive routine protein measurements for the SPR techniques at picomolar concentrations and lower would be extremely valuable14.
Several approaches have been reported attempting to increase SPR detection sensitivity with instrumental design and experimental optimization, which include signal-to-noise optimization15; use of two wavelength light sources for differential images16; multiple traversing of optical beam through sensing surface17; and use of grating coupled SPR chips that limit propagation of surface plasmons18. However, these methods often suffer the drawback of limited linear range, and the enhancement is only incremental, which is not sufficient enough for ultra sensitive detection. Novel surface chemistries, in particular particle attachment, have been extensively investigated for signal enhancement. For instance, a layer of protein-Au colloid complexes was used in a measurement that has led to 25 fold increase in the SPR resonance angle shift19, and a layer-by-layer assembly of Au nanoparticles and polyelectrolytes results in high SPR resonance angle shift under certain solution conditions20. With the particle-enhanced sandwich immunoassay, the solution protein concentration of human immunoglobulin G in the picomolar range could be detected19, and the detection limit of chloramphenicol was enhanced to 0.74 fg/mL21. In addition, poly(T)-coated gold nanoparticles have been hybridized to a sensing surface to amplify signals from surface-bound miRNA, which attained a 5 attomol detection limit22. Streptavidin-coated latex microbeads have also been employed for sandwich immunoassay, amplifying the detection limit of prostate-specific antigen (PSA) to 2.4 ng/mL23. Another elegant strategy for SPR signal enhancement is the use of enzymatic amplification24–27. These include measurement of signal increase induced by localized precipitation24, 25 and detection of signal decrease caused by selective hydrolysis of RNA-DNA heteroduplexes26,27. In addition, polymers have been explored as signal enhancing materials as well. Aniline monomers have been adsorbed on DNA backbones through electrostatic interactions for a peroxide-initiated polymerization, improving the detection limit to 0.1 pM28. Despite these efforts, generic methods allowing signal enhancement for highly sensitive detection of proteins with a broad, versatile fashion in flow-injection based analysis are still lacking.
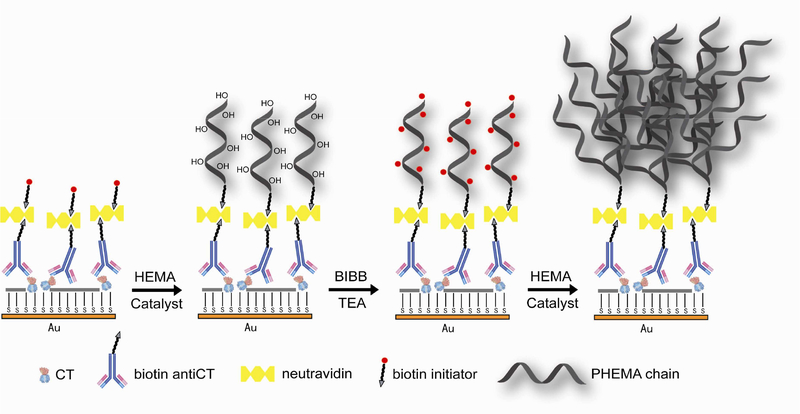
In this work, we report the development of a polymer-based amplification strategy for a generic and highly sensitive SPR detection of protein molecules. The method is based on the atom transfer radical polymerization (ATRP) reaction, a controlled radical-based process with repetitive addition of monomers to radicals generated from dormant alkyl halides in a reversible redox process29–31. ATRP has been used to graft polymer brushes on a solid support and yield polymers with high molecular weight, low polydispersity, and controllable thickness and density32. Brushes based on poly (ethylene glycol) methacrylate, poly (ethylene glycol) methyl methacrylate, and poly sulfobetaine methacrylate have been used as biomimetic fouling-resistant materials to suppress nonspecific protein adsorption33–35. Brushes generated from thermosensitive polymers such as N-isopropylacrylamide have been used for the programmed adsorption and release of proteins36,37. A number of ATRP reactions are known for effective polymerization in aqueous solution and at room temperature38, and has high tolerance of surrounding functional groups. This property renders the reaction to be used along with biomolecularly functionalized surfaces, and the localized polymer growth has been exploited as an amplification tool for colorimetric DNA detection39,40. Scheme 1 shows the general strategy used in this work for surface initiated ATRP amplification of protein detection with SPR. To specifically localize the initiator onto the protein site where signal enhancement is desired, a biotinylated initiator for poly(hydroxyl-ethyl methacrylate) (PHEMA) is synthesized and used along with neutravidin for its attachment to the target proteins via the biotinylated antibody (biot-IgG). The wide availability of biot-IgG against various biomolecules would make this method broadly applicable to almost any proteins of interest. In this work, bacterial cholera toxin (CT) is chosen as the model system because of its biological significance and availability of pure samples and antibody. Pertinent experimental conditions such as deoxygenation steps to suppress oxygen interference for flow-injection analysis (FIA) and use of PEGamine reagent to passivate sensing interface to eliminate nonspecific interaction are developed. In addition, optical and AFM microscopy are used to characterize the polymeric thin films formed on the protein sites through ATRP steps.
Scheme 1.
A cartoon representation of the biotinylated initiator coupled surface and consecutive two steps of in-situ surface ATRP reactions for SPR signal amplification.
EXPERIMENTAL SECTION
Materials.
(+)-Biotin was purchased from Fisher Scientific. NeutrAvidin was obtained from Thermo Scientific (Rockford, IL). Cholera toxin (CT), 11-mercaptoundecanoic acid (MUA), 1,1’-carbonyldiimidazole, 2-(2’-aminoethoxy)ethanol, 2-bromo-2-methyl propionic acid (BIBB), 1,3-dicyclohexylcarbodiimide, 4-(N,N-dimethylamino)pyridine, 2-bromoisobutyryl bromide, 2-hydroxyethyl methacrylate (HEMA), CuBr, 2,2’-bipyridyl (bpy), L-ascorbic acid (AA), and triethylamine (TEA) were purchased from Sigma-Aldrich (St. Louis, MO). Biotinylated rabbit anti-cholera serum was from ViroStat (Portland, Maine). O-(2-Aminoethyl)-methylpolyethylene glycol (PEGamine) 750 was obtained from Fluka. N-hydroxysuccinimide and 1-(3-dimethylaminopropyl)-3-ethylcarbodiimide hydrochloride were purchased from Acros. All proteins solutions were prepared in 20 mM phosphate buffered saline (containing 150 mM NaCl, pH 7.4).
Synthesis of biotinylated ATRP initiator.
The biotinylated ATRP initiator was synthesized according to a published procedure41. Briefly, biotin was activated by 1,1’-carbonyldiimidazole, followed by its coupling to a hydrophilic linker of 2-(2’-aminoethoxy)-ethanol to form biotinylated alcohol. Esterification of biotinylated alcohol with 2-bromo-2-methyl propionic acid was carried out in the presence of 4-(N,N-dimethylamino)pyridine (DMAP) and 1,3-dicyclohexylcarbodiimide (DCC), which afforded the biotinylated ATRP initiator in a 43% yield after purification by flash chromatography. The compound was verified by Hi Res MS and NMR.
AFM and optical microscopy.
Atomic force microscopy (AFM) images were obtained using a Veeco Dimension 5000 atomic force microscope (Santa Barbara, CA) with manufacturer-provided software. All images were obtained in tapping mode. Optical microscopy images were obtained using Zeiss AXIO imager optical microscope under dark field condition.
SPR analysis of protein toxins and signal amplification with ATRP.
A dual channel SPR spectrometer NanoSPR-321 (NanoSPR, Addison, IL) with a GaAs semiconductor laser light source (λ=670 nm) was used for all SPR measurements. The device comes with a high-refractive index prism (n=1.61) and 30 μL flow cell. SPR gold chips were fabricated with a 2-nm thick chromium adhesion layer, followed by deposition of a 46-nm thick gold layer via e-beam evaporation onto cleaned BK-7 glass slides.
Surface interaction and modification were monitored using the angular scanning mode around the minimum angle. After immersed in a piranha solution (7:3 v/v, H2SO4/H2O2) (Caution!) for 1 min to remove inorganic and organic contaminants on the surface, the gold substrate was incubated in 1 mM MUA ethanol solution for 18 hours to form a self-assembled monolayer with carboxyl functional group on the surface. After extensive rinsing with copious ethanol and DI water, the chip was dried under a N2 stream. The gold substrate was then clamped to a flow cell on a prism. To activate the carboxyl acid group, EDC (0.4M)/NHS (0.1M) solution was injected into the flow cell and incubated for 30 min. After rinsing with water, varied concentrations of CT in PBS was injected and incubated for 30 min to allow formation of covalent amide linkages. Passivation of the unused activated carboxyl groups was performed by incubation with 4 mM PEGamine solution for 20 min, which was followed by a 10-min rinsing to eliminate any residual CT in solution. The binding assay was carried out with injection of 0.1 mg/mL biotin-anti CT and 15 min incubation. Following this, 0.25 mg/mL neutravidin was injected and incubated for 10 min. Finally 0.5 mg/mL freshly prepared biotin-initiator was injected, incubated for 20 min before running a 10 min buffer rinsing.
The first stage amplification with ATRP was conducted with an aqueous solution of 20% HEMA monomer and catalyst (9mM CuBr/18mM 2.2’-dipyridyl) that was purged with nitrogen for 30 min to reduce the amount of O2 present. After incubation for 30 minutes, the polymerization was stopped by removal of the HEMA/catalyst mixture with PBS buffer. In the second-stage ATRP reaction, subsequent anchoring of additional initiators on PHEMA formed during the first-stage ATRP was used. Direct coupling of 2-bromoisobutyryl bromide to the hydroxyl groups on the PHEMA side chains was achieved by using a solution of 0.08 M 2-bromoisobutyryl bromide in 0.1 M TEA, similar to a previously reported procedure39.
RESULTS AND DISCUSSION:
Biotinylated initiator for protein detection and in-line ATRP process.
Previous work has used bromoisobutyryl NHS ester to link the initiator to DNA for site-specific ATRP amplification that relied on DNA hybridization42 and for peptides on a solid support43. To develop a direct and flexible method for detection of protein samples, the ATRP initiator has to be fixed to the specific protein site through a broadly available attachment scheme. In this work we developed the attaching scheme to localize the initiators through the well-defined biotinavidin interaction (Scheme 1). Two consecutive stages are thus involved in the method: specific initiator binding via biotinylated antibody and local polymer growth. For simplicity of the experiment, CT is covalently linked to surface to demonstrate the feasibility of polymer-based signal amplification in SPR. To eliminate nonspecific adsorption the free, activated carboxyl acid groups of MUA were blocked by PEGamine. The surface attached CT was recognized by injection of biotinylated anti-CT. Then neutravidin was added that specifically binds to the exposed biotin tag. A high concentration of neutravidin was used to ensure effective binding and the captured neutravidins have additional binding site available for biotin-initiators in the following step. The initial catalyst solution was prepared using literature protocol33 by dissolving CuBr and 2,2’-bipyridine in degassed water. Although a good amplification signal was obtained, the response was unstable and showed poor reproducibility. Most severely, the deposited material for signal enhancement could be removed by extensive rinsing, leading us to speculate that the signal may not be a result of polymerization but rather precipitation of deactivated catalyst when exposed to oxygen under the condition of inline flow injection analysis.
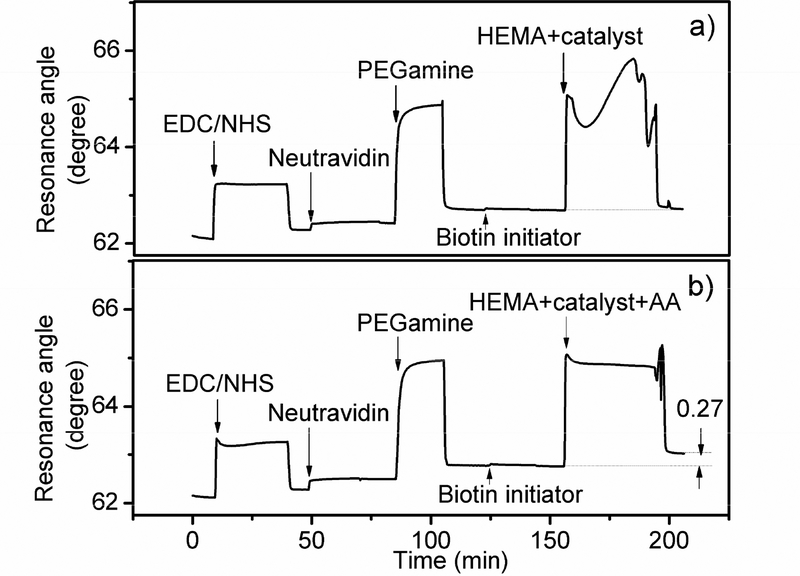
It is well documented that the ATRP process is sensitive to air since oxygen can cause irreversible oxidation of the transition metal catalyst and thus inhibit polymerization44. Several deoxygenation procedures have been used for ATRP to maintain consistent polymer growth, which include the freeze-pump-thaw process45 and placing the reaction system in a container under nitrogen protection34. Although effective, these procedures are labor-intensive and not practical for inline SPR detection. Other approaches include the use of transition metal complexes with higher oxidation states to generate the ATRP initiator in situ46 and addition of deoxygen reagents such as ascorbic acid (AA)44 and glucose47. We found that the catalyst solution (CuBr:2,2’-bipyridine in a 1:2 molar ratio) that was prepared in degassed water and sealed in an eppendorf tube developed a grey blue precipitation after 30 minutes. However, with the addition of AA (CuBr:2,2’-bipyridine:AA in a 1:2:1.5 molar ratio), the catalyst solution showed the original dark brown color after a long period of time (supplement). We then further evaluated the use of AA in ATRP catalyst for flow injection inline SPR detection. Figure 1 shows the comparison of SPR sensorgrams with and without AA addition. In this screening study, neutravidin was covalently attached to the MUA functionalized surface while the biotinylated initiator was injected and incubated, followed by 20% HEMA monomer/catalyst solution. The significant signal increase right after injection was caused by bulk refractive index change. Following the incubation period for polymer growth, the SPR signal increased substantially in both cases. However, without AA in the catalyst solution, the materials formed on the surface could be easily rinsed off by PBS buffer, and the overall SPR signal increase was insignificant as compared to its original level (Fig. 1a). By contrast, with AA in the catalyst solution, there was no visible precipitate formed on the surface, and a large SPR signal increase (0.27 degrees) was observed after even extensive rinsing (Fig. 1b), demonstrating an effective in situ polymer growth in an FIA setting.
Fig. 1.
SPR sensorgrams for the covalently immobilized neutravidin interacting with biotin initiator for ATRP steps with HEMA monomers in the absence (a) and presence (b) of oxygen-suppression reagent ascorbic acid in the catalyst mixture.
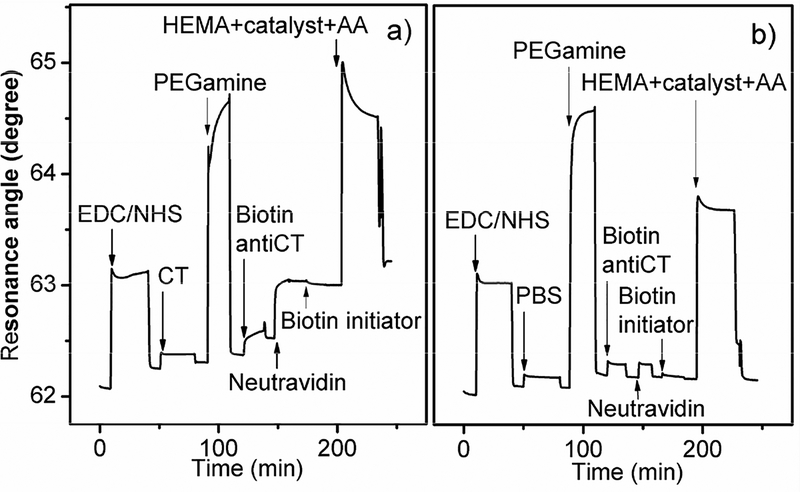
When applying ATRP to CT detection and amplification, the HEMA/catalyst solution with AA in a 5:1 volume ratio was injected into the SPR flow-cell after biotin-initiator coupling. Figure 2 showed the results with 1.2 μM CT used for surface immobilization. PHEMA grew on the surface during a 30 minutes incubation, resulting in an angle shift of 0.22 degrees after PBS rinsing, much larger than the CT attachment alone (0.06 degrees) (Figure 2a). In the control channel, buffer was injected instead of CT under the same condition, followed by biotinylated anti-CT, neutravidin, and biotinylated initiator for ATRP step. There was no measurable SPR signal change for biotin anti-CT, neutravidin, or PHEMA (Figure 2b), demonstrating good specificity of the polymer growth and successful suppression of nonspecific adsorption of the catalyst.
Fig. 2.
SPR sensorgrams for (a) immunoassay of 2.92 × 10⁻¹² mol/cm2 CT with ATRP amplification and (b) the control channel.
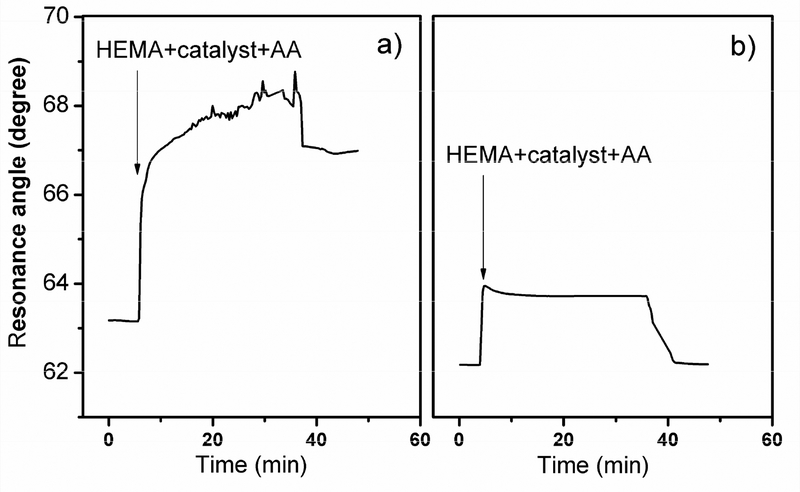
Although SPR signal amplification was achieved with biotinylated-initiator/HEMA, the extent of amplification was not very high, insufficient for ultra-sensitive SPR detection. It seems the surface concentration of initiator is relatively low in this case as compared to self-assembled monolayer of initiator-coupled small molecules40. Furthermore, the ATRP process only generates localized, linear polymers from the sparsely present initiator spots, which can not provide substantial SPR signal enhancement. It has been observed that high yield polymer growth usually requires high surface initiator concentration and long reaction time (hours)33–35. Unfortunately, hours of incubation time for polymer growth is unsuitable for inline based FIA study. Alternatively, formation of hyper-branched polymer molecules can be pursued to obtain substantial materials on the surface48. It is known that initiator precursor could react with hydroxyl groups, multiple hydroxyl groups, or amine groups, and generated hyperbranched polymers via ATRP49,50, which has been used for direct visualization of low concentration target39. Using the hydroxyl groups of the original PHEMA chain as a starting point, we decided to introduce a second ATRP reaction to generate hyperbranched polymer for CT signal amplification. To do this, as illustrated in Scheme 1, the PHEMA was activated with BIBB, which converts the hydroxyl moieties on the PHEMA to bromo groups that can subsequently serve as sites for PHEMA hyper-branches to grow. The resulting higher initiator density would offer high polymer growth efficiency and thus considerable increase in SPR angle shift. It should be mentioned that in addition to hydroxyl groups, neutravidin amine groups could also participate in the coupling reaction, but the more numerous side chain hydroxyl groups and relatively more exposed positions make them more accessible to 2-bromoisobutyryl in the initiator conversion step. After reaction with 2-bromoisobutyryl bromide and incubation with HEMA/catalyst for 30 minutes and PBS rinsing, resonance angle shifted substantially with 3.89 degrees of signal obtained for the bound CT (Figure 3a). The polymerization actually resulted in a considerable change of surface optical property, discernible to the naked eye. The control was performed under the same conditions in the absence of CT. Since there was no formed primary linear PHEMA or neutravidin in the first ATRP step, there was no position available for 2-bromoisobutyryl bromide to couple to. As expected, the second step ATRP only showed a very small signal shift (Figure 3b), demonstrating low background signal and abundant room for lowering the detection limit. Additional control was performed with biot-IgG, which is not specific to surface immobilized CT. The result showed negligible angular shift after two-step ATRP (supplement), further confirming the high specificity of the in-line polymer growth.
Fig. 3.
SPR characterization of the second step ATRP amplification for (a) CT immobilized surface and (b) the control surface without CT.
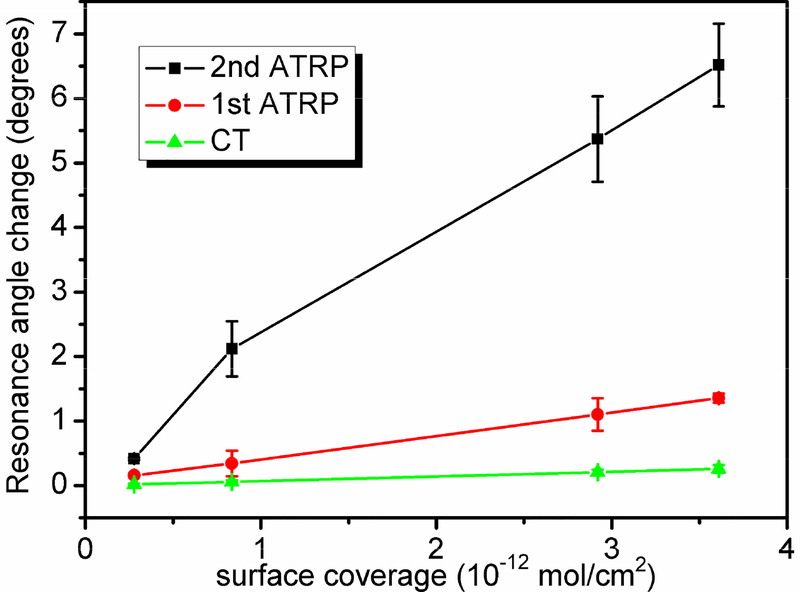
In order to quantify the amplification efficiency, SPR angular shifts for CT attachment, first step ATRP amplification, and second step ATRP amplification were compared. A series of CT-modified surfaces were prepared with various CT concentrations. To best describe the amount of immobilized CT, the surface coverage was used instead of solution concentration. The CT surface coverage was determined according to Jung’s formula51 using SPR angular shift, protein refractive index of 1.652 and the bulk density of protein of 1.43g/cm3 53. Figure 4 shows the resonance angular change under various conditions versus the amount of CT attached. The plot range is from 2.8 × 10⁻¹³ to 3.6 × 10⁻¹² mol/cm2, as the angular shift of CT immobilization was difficult to accurately quantify when the surface coverage was lower than 2.8 × 10⁻¹³ mol/cm2. Above 3.6 × 10⁻¹² mol/cm2, the second step ATRP was so efficient that the signal exceeded the measurement range of the instrument.. From Figure 4, both ATRP steps enhance SPR signal for CT, exhibiting a similar tendency of signal increase with respect to CT surface coverage. But magnitude of enhancement differs substantially. For instance, at 3.61 × 10⁻¹² mol/cm2, first step ATRP amplification increases CT signal by ~ 5 times, whereas the two steps ATRP amplification gives CT signal increase by about 25 times, which is better than many methods currently used for SPR signal enhancement24,25,28, and therefore makes it possible for high-sensitive detection of protein molecules.
Fig. 4.
Comparison of SPR responses for direct CT coupling (▲), after first ATRP amplification (●), and after second ATRP amplification (■).
Morphological characterization of ATRP polymer films.
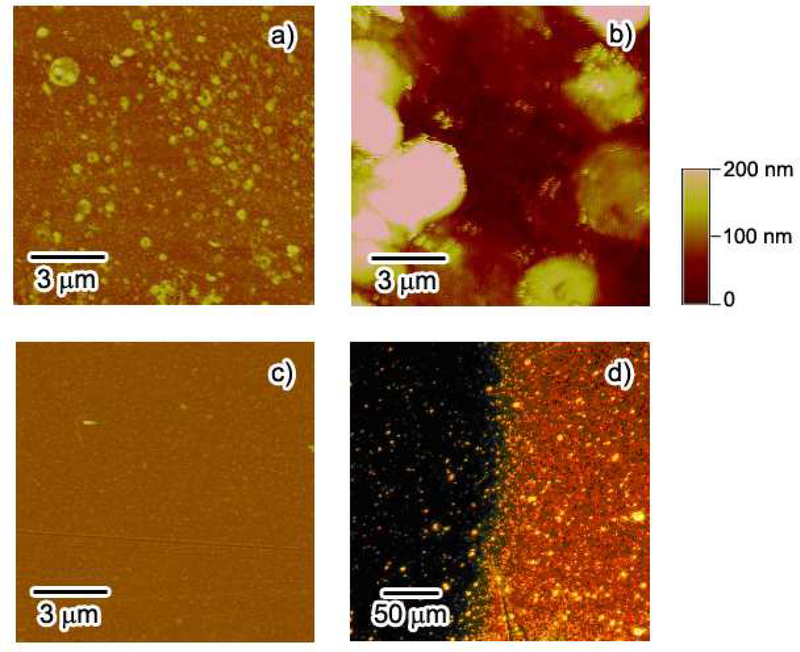
The inline formation of hyper-branched PHEMA was characterized by a number of methods including AFM and optical microscopy. AFM is capable of providing useful topographic information of the polymer branches in the nanometer scale. Figure 5a shows the surface feature of the PHEMA film after first step ATRP by AFM. At a surface coverage of 2.92 × 10⁻¹² mol/cm2 for CT, the linear polymer chains show a rough surface property in some areas due to sparse initiator binding site. After second step ATRP, polymer islands composed of films with thickness above 100 nm and average feature size in the micrometer range were observed (Figure 5b). The hyperbranched PHEMA after second ATRP substantially expended the polymer coverage, but we also observed some thin polymer layers with micrometer-range intervals, possibly because the localized, short linear PHEMA from the first ATRP could not cover the entire surface and therefore limits the polymer growth in the voids. Previous work showed similar polymer morphology by AFM39 with smaller polymer islands and interval distances, likely a result of size difference between the DNA target in their research and protein CT used here. For comparison, the surface is quite flat and featureless in the absence of CT after two-step ATRP, indicating little polymer growth nor nonspecific adsorption occurring at the surface (Figure 5c).
Fig. 5.
AFM images of the polymer films prepared with immobilization of 2.92 × 10⁻¹² mol/cm2 of CT. (a) after the first step ATRP; (b) after the second step ATRP; (c) the control surface without CT immobilization. (d) shows the microscopic image of the polymer film prepared with 3.61 × 10⁻¹² mol/cm2 of CT after the second step ATRP.
Direct inspection of the substrate confirmed the formation of a much thicker polymer layer as the optical quality of the surface changed. An optical image, obtained on the boundary of the flow cell after the ATRP reaction, clearly showed the difference between the two areas (Figure 5d). The right bright area indicates the polymer growth, which was visible to naked eye, while the left dark area shows relatively clean background for the bare gold surface. The surface coverage of CT in Figure 5d is 3.61 × 10⁻¹² mol/cm2, which yielded 6.53 degrees of angular shift after two-step ATRP. The hyperbranched PHEMA film has a clear edge line, showing a substantially large surface density and thickness for areas where CT is attached.
Effectiveness of surface passivation on background suppression.
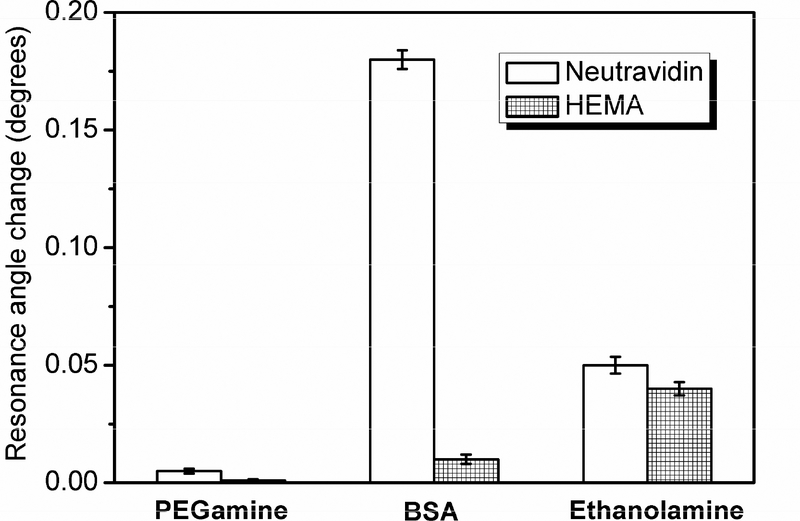
There are two key factors in the ultra-sensitive detection of protein molecules with SPR: amplification of the resonance angular shift and surface passivation. Suppression of nonspecific adsorption is of great importance to this SPR-based amplification method as trace amount of adsorbed species will generate very high signal after the amplification step. Hydrophilic polyethylene glycol is a material known to have a low interfacial free energy, and is capable of resisting nonspecific adsorption of biomolecules including protein54 and DNA55,56. In this work, PEGamine and other surface passivation agents were compared for their effectiveness in passivating the surface that meets the requirement for an amplification method. The carboxyl acid activated Au substrates were treated with PEGamine, 1 mg/mL BSA, and 10% ethanolamine solution, respectively, followed by exposure to 0.25 mg/mL neutravidin and a 20% HEMA solution. The results are summarized in Figure 6. The BSA-passivated surface showed some degree of neutravidin adsorption due to protein interaction and a noticeable extent of HEMA nonspecific adsorption. Slight improvement was observed for ethanolamine-coated surface against neutravidin nonspecific adsorption. However, ethanolamine is not effective as a passivating reagent to reduce HEMA nonspecific adsorption because side chain hydroxyl groups of HEMA may stick to hydroxyl terminal surface, which has been confirmed by previous work57. The PEGamine-passivated surface shows excellent suppression of nonspecific adsorption from both the hydrophilic HEMA monomer and hydrophobic neutravidin. After a 10 min incubation for neutravidin and 30 min incubation for HEMA followed by PBS rinsing, SPR angular shift was negligible as compared to nonspecific adsorption on BSA and ethanolamine-passivated surfaces, making PEGamine an effective background suppression reagent for this polymer-based amplification method.
Fig. 6.
SPR angular shift in response to nonspecific adsorption of 0.25 mg/mL neutravidin (blank) and 20% HEMA (grid) on differently passivated Au substrates.
In addition, biotin-binding proteins have been screened and compared for their ability to decrease nonspecific adsorption on the PEGamine sublayer. Both avidin and neutravidin are commonly used biotin-binding proteins containing four available binding sites, and they share the same major structure except for the deglycosylated character of neutravidin, which is responsible for its near-neutral isoelectric point (pI). Avidin’s high pI leaves it positively charged in PBS at pH 7.4, which led to some degree of nonspecific adsorption on the PEGamine-passivated surface, as measured with an angular shift of 0.22 degrees after ATRP amplification (supplement). Neutravidin, on the other hand, is negatively charged at pH 7.4 and appears to not adhere to the PEGamine covered surface. It showed negligible SPR signal change after 10 minutes incubation and PBS rinsing, making it a suitable protein to be used for linking biotinylated initiator to the specific protein (CT) site.
Highly sensitive detection of protein toxins.
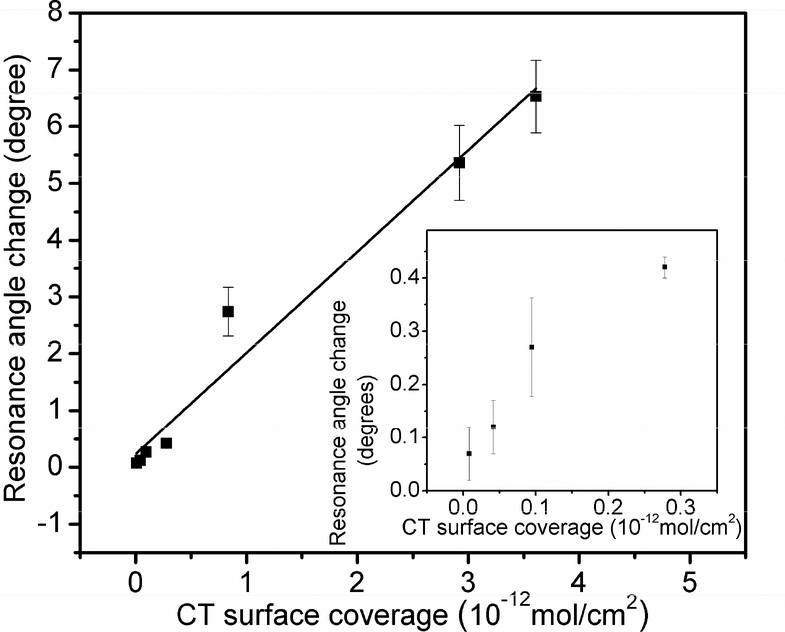
CT, an archetypal member of the AB5 toxin family58, is responsible for the deleterious effects of cholera infection, one of the most severe illnesses in developing countries. In recent years, ultrasensitive detection of CT has drawn considerable interest because of the clinical relevance and excellent property as a model system duo to well characterized interactions between CT and its cell surface ligand59. Figure 7 shows a plot of the SPR signal increase as a function of CT surface coverage after two consecutive ATRP steps, as illustrated in Scheme 1. As the SPR signal for CT below the surface coverage of 2.78×10⁻¹³ mol/cm2 could not be directly measured, the lower surface coverage of CT in the plot was determined with extrapolation of the curve obtained with SPR measurements after neutravidin attachment. The ATRP amplified signal shows a linear correlation to the surface coverage of CT from 8.23 × 10⁻¹⁵ mol/cm2 to 3.61 × 10⁻¹² mol/cm2 (R2=0.9219). Even at 8.23 × 10⁻¹⁵ mol/cm2 (the concentration of CT used in immobilization is 59 pM), the immobilized CT generates discernible SPR signal change after ATRP amplification, which is much lower than most previously reported CT detection including a layer-by-layer SPR amplification60 and colorimetry61. Inset in Figure 7 shows data and error bar for surface coverage less than 2.78 × 10⁻¹³ mol/cm2. Using the 3 S/N principle, the detection limit was determined to be 6.27 × 10⁻¹⁵ mol/cm2, which is almost 150 times more sensitive than the method with DOPC/GM1 membrane62. Taking the flow cell area into calculation, the absolute quantity of detection limit is 2.19 fmol, which is comparable to highly sensitive electrochemical and fluorescence methods63–65.
Fig. 7.
SPR response as a function of CT surface coverage after two steps ATRP amplification with biotinylated initiator and neutravidin. Inset displays the response for CT surface coverage lower than 8.35 × 10⁻¹³ mol/cm2.
Conclusions
We report here a novel SPR signal amplification strategy for highly sensitive detection of proteins based on in-situ surface initiated ATRP reactions. Biotinylated initiators for poly(hydroxyl-ethyl methacrylate) are used with neutravidin for their specific attachment to the targeted protein and subsequent initiation of polymer growth is attained. Two consecutive ATRP processes are realized on the protein sites through converting the linear PHEMA side chain hydroxyl groups from the first step ATRP into new initiators for a second step ATRP. This practice substantially enhances the polymer yield on the surface, and has efficiently shortened the reaction time. The immobilized CT has been detected in the range of 8.23 × 10⁻¹⁵ to 3.61 × 10⁻¹² mol/cm2 and a detection limit as low as 6.27 × 10⁻¹⁵ mol/cm2 (2.19 fmol) has been obtained.
To realize inline polymer growth under ambient conditions, addition of ascorbic acid to the catalyst solution as deoxygen reagent was firstly applied and it proved to be satisfactory for flow-injection based SPR detection. PEGamine has also proven to be an excellent reagent to passivate the sensing interface where nonspecific adsorption of both hydrophilic HEMA monomer and hydrophobic neutravidin are effectively suppressed. Given that a large number of biotinylated antibodies are commercially available as well as coupling kits for protein biotinylation, this ATRP based amplification method can be applied as a universal strategy to highly sensitive detection of nearly all proteins and peptides through flow injection analysis by SPR. Future work will focus on optimizing the immobilization density of initiators and applying the current system to microarray analysis with SPR imaging for high-throughput screening of complex biological systems.
Supplementary Material
Acknowledgement:
The authors would like to acknowledge financial support from NSF grant CHE-0719224 and NIH 1R21EB009551–01A2.
Footnotes
Supporting Information Available
Details about effect of ascorbic acid in the catalyst solution on oxygen suppression, comparison of different biotin binding proteins on nonspecific adsorption, procedure for CT surface coverage calculation are presented. This material is available free of charge via the Internet at http://pubs.acs.org.
Reference
- 1.Turner AP F. Science 2000, 290, 1315–1317. [DOI] [PubMed] [Google Scholar]
- 2.Gao Y; Wolf LK; Georgiadis RM Nucl. Acids Res. 2006, 34, 3370–3337. [DOI] [PMC free article] [PubMed] [Google Scholar]
- 3.Natsume T; Nakayame H; Janssen O; Isobe T; Takio K; Mikoshiba K Anal. Chem. 2000, 72, 4193–4198. [DOI] [PubMed] [Google Scholar]
- 4.Torrance L; Ziegler A; Pittman H; Paterson M; Toth R; Eggleston IJ Virol. Methods 2006, 134, 164–170. [DOI] [PubMed] [Google Scholar]
- 5.Lee HJ; Nedelkov D; Corn RM Anal. Chem. 2006, 78, 6504–6510. [DOI] [PubMed] [Google Scholar]
- 6.Quinn JG; O’Neill S; Doyle A; McAtammey C; Diamond d.; B. D. MacCraith; O’Kennedy R Anal. Biochem. 2000, 281, 135–143. [DOI] [PubMed] [Google Scholar]
- 7.Rich RL; Myszka DG Curr. Opin. Biotechnol. 2000, 11, 54–61. [DOI] [PubMed] [Google Scholar]
- 8.Mcdonnel JM; Boussaad S; Pean J; Tao NJ Anal. Chem. 2000, 72, 222–226. [DOI] [PubMed] [Google Scholar]
- 9.Murphy MB; Fuller ST; Richardson PM; Doyle SA Nucl. Acids Res. 2003, 31, e110. [DOI] [PMC free article] [PubMed] [Google Scholar]
- 10.Wilson S; Howell S Biochem. Soc. Trans. 2002, 30, 794–797. [DOI] [PubMed] [Google Scholar]
- 11.Kikuchi J; Furukawa Y; Hayashi N Mol. Biotechnol. 2003, 23, 203–212. [DOI] [PubMed] [Google Scholar]
- 12.Karlsson RJ Mol. Recognit. 2004, 17, 151–161. [DOI] [PubMed] [Google Scholar]
- 13.Phillips KS; Han J; Martinez M; Wang Z; Carter D; Cheng Q Anal. Chem. 2006, 78, 596–603. [DOI] [PubMed] [Google Scholar]
- 14.Lee HJ; Wark AW; Corn RM Analyst 2008, 133, 975–983. [DOI] [PMC free article] [PubMed] [Google Scholar]
- 15.Zybin A; Boecker D; Mirsky VM; Niemax K Anal. Chem. 2007, 79, 4233–4236. [DOI] [PubMed] [Google Scholar]
- 16.Boecker D; Zybin A; Horvatic V; Grunwald C; Niemax K Anal. Chem. 2007, 79, 702–709. [DOI] [PubMed] [Google Scholar]
- 17.Ho HP; Yuan W; Wong CL; Wu SY; Suen YK; Kong SK; Lin CL Opt. Commun. 2007, 275, 491–496. [Google Scholar]
- 18.Alleyne CJ; Kirk AG; McPhedran RC; Nicorovici NAP; Maystre D Opt. Express 2007, 15, 8163–8169. [DOI] [PubMed] [Google Scholar]
- 19.Lyon LA; Musick MD; Natan MJ Anal. Chem. 1998, 70, 5177–5183. [DOI] [PubMed] [Google Scholar]
- 20.Jiang G; Baba A; Ikarashi H; Xu R; Locklin J; Kashif KR; Shinbo K; Kato K; Kaneko F; Advincula RJ Phys. Chem. C 2007, 111, 18687–18694. [Google Scholar]
- 21.Yuan J; Oliver R; Aguilar M; Wu Y Anal. Chem. 2008, 80, 8329–8333. [DOI] [PubMed] [Google Scholar]
- 22.Fang S; Lee HJ; Wark AW; Corn RMJ Am. Chem. Soc. 2006, 128, 14044–14046. [DOI] [PMC free article] [PubMed] [Google Scholar]
- 23.Besselink GAJ; Kooyman RPH; van Os PJHJ; Engbers GHM; Schasfoort RBM Anal. Biochem. 2004, 333, 165–173. [DOI] [PubMed] [Google Scholar]
- 24.Li Y; Lee J; Corn RM Anal. Chem. 2007, 79, 1082–1088. [DOI] [PMC free article] [PubMed] [Google Scholar]
- 25.Cao C; Sim SJ Biosens. Bioelectron. 2007, 22, 1874–1880. [DOI] [PubMed] [Google Scholar]
- 26.Goodrich TT; Lee HJ; Corn RM Anal. Chem. 2004, 76, 6173–6178. [DOI] [PubMed] [Google Scholar]
- 27.Goodrich TT; Lee HJ; Corn RMJ Am. Chem. Soc. 2004, 126, 4086–4087. [DOI] [PubMed] [Google Scholar]
- 28.Su X; Teh HF; Aung K,M; Zong Y; Gao Z Biosens. Bioelectron. 2008, 23, 1715–1720. [DOI] [PubMed] [Google Scholar]
- 29.Sawamoto M; Kamigaito M Trends Polym. Sci. 1996, 4, 371–377. [Google Scholar]
- 30.Wang JS; Matyjaszewski K Macromolecules 1995, 28, 7572–7573. [Google Scholar]
- 31.Patten TE; Matyjaszewski K Adv. Mater. 1998, 10, 901–915. [Google Scholar]
- 32.Matyjaszewski K; Xia J Chem. Rev. 2001, 101, 2921–2990. [DOI] [PubMed] [Google Scholar]
- 33.Lee BS; Chi YS; Lee K; Kim Y; Choi IS Biomacromolecules 2007, 8, 3922–3929. [DOI] [PubMed] [Google Scholar]
- 34.Ma H; Wells M; Beebe TP Jr.; Chilkoti A Adv. Funct. Mater. 2006, 16, 640–648. [Google Scholar]
- 35.Zhang Z; Chen S; Chang Y; Jiang SJ Phys. Chem. B 2006, 110, 10799–10804. [DOI] [PubMed] [Google Scholar]
- 36.Huber DL; Manginell RP; Samara MA; Kim B-I; Bunker BC Science 2003, 301, 352–354. [DOI] [PubMed] [Google Scholar]
- 37.Li M; Femando G; Waasbergen LG; Cheng X; Ratner BD; Kinsel GR Anal. Chem. 2007, 79, 6840–6844. [DOI] [PubMed] [Google Scholar]
- 38.Coullerez G; Carlmark A; Malmstrom E; Jonsson MJ Phys. Chem. A. 2004, 108, 7129–7131. [Google Scholar]
- 39.Lou X; Lewis MS; Gorman CB; He L Anal. Chem. 2005, 77, 4698–4705. [DOI] [PubMed] [Google Scholar]
- 40.Lou X; He L Langmuir 2006, 22, 2640–2646. [DOI] [PubMed] [Google Scholar]
- 41.Qi K; Ma Q; Remsen EE; Clark CG; Wooley KLJ Am. Chem. Soc. 2004, 126, 6599–6607. [DOI] [PubMed] [Google Scholar]
- 42.Lou X; He L Polym. Prepr. 2004, 45, 455–456. [Google Scholar]
- 43.Mei Y; Beers KL; Byrd HCM; VanderHart DL; Washburn NRJ Am. Chem. Soc. 2004, 126, 3472–3476. [DOI] [PubMed] [Google Scholar]
- 44.Min K; Jakubowski W; Matyjaszewski K Macromol. Rapid Commun. 2006, 27, 594–598. [Google Scholar]
- 45.Hansen NL; Haddleton DM; Hvilsted SJ Polym. Sci. Pol. Chem. 2007, 45, 5770–6780. [Google Scholar]
- 46.Tang W; Matyjaszewski K Macromolecules 2007, 40, 1858–1863. [Google Scholar]
- 47.Jakubowski W; Min K; Matyjaszewski K Macromolecules 2006, 39, 39–45. [Google Scholar]
- 48.Matyjaszewski K Polym. Mater. Sci. Eng. 2001, 84, 363–364. [Google Scholar]
- 49.Narain R; Armes SP Macromolecules 2003, 36, 4675–4678. [Google Scholar]
- 50.Narain R; Armes SP Chem. Commun. 2002, 23, 2776–2777. [DOI] [PubMed] [Google Scholar]
- 51.Jung LS; Campbell CT; Chinowsky TM; Mar MN; Yee SS Langmuir 1998, 14, 5636–5648. [Google Scholar]
- 52.Armstrong SH Jr.; Budka MJE; Morrison KC; Hasson MJ Am. Chem. Soc. 1947, 69, 1747–1753. [DOI] [PubMed] [Google Scholar]
- 53.Connolly MLJ Mol. Graph. 1993, 11, 139–141. [DOI] [PubMed] [Google Scholar]
- 54.Li L; Chen S; Zheng J; Ratner B; Jiang SJ Phys. Chem.. B 2005, 109, 2934–2941. [DOI] [PubMed] [Google Scholar]
- 55.Lee C; Nguyen PT; Grainger DW; Gamble LJ; Castner DG Anal. Chem. 2007, 79, 4390–4400. [DOI] [PMC free article] [PubMed] [Google Scholar]
- 56.Lee C; Gamble LJ; Grainger DW; Castner DG Biointerphases 2006, 1, 82–92. [DOI] [PubMed] [Google Scholar]
- 57.Lou X; He L Sensor. Actuat B 2008, 129, 225–230. [Google Scholar]
- 58.Minke WE; Roach C; Hol WGJ; Verlinde CLMJ Biochemistry 1999, 38, 5684–5692. [DOI] [PubMed] [Google Scholar]
- 59.Viswanathan S; Wu L; Huang M; Ho JA Anal. Chem. 2006, 78, 1115–1121. [DOI] [PubMed] [Google Scholar]
- 60.Taylor JD; Linman MJ; Wilkop T; Cheng Q Anal. Chem. 2009, 81, 1146–1153. [DOI] [PubMed] [Google Scholar]
- 61.Schofield CL; Field RA; Russell DA Anal. Chem. 2007, 79, 1356–1361. [DOI] [PubMed] [Google Scholar]
- 62.Santos O; Arnebrant TJ Colloid. Interf. Sci. 2009, 329, 213–221. [DOI] [PubMed] [Google Scholar]
- 63.Bunyakul N; Edwards KA; Promptmas C; Baeumner AJ Anal. Bioanal. Chem. 2009, 393, 177–186. [DOI] [PubMed] [Google Scholar]
- 64.Phillips KS; Cheng Q Anal. Chem. 2005, 77, 327–334. [DOI] [PubMed] [Google Scholar]
- 65.Phillips KS; Dong Y; Carter D; Cheng Q Anal. Chem. 2005, 77, 2960–2965 [DOI] [PubMed] [Google Scholar]
Associated Data
This section collects any data citations, data availability statements, or supplementary materials included in this article.


