Abstract
Many imaging probes have been developed for a wide variety of imaging modalities. However, no optical imaging probe could be utilized for both microscopic and whole animal imaging. To fill the gap, the dual-wavelength fluorescent imaging nanoprobe was developed to simultaneously carry both visible-range fluorescent dye and near-infrared (NIR) dye. Emission scan confirms that the nanoprobe exhibits two separate peaks with strong fluorescent intensity in both visible and NIR ranges. Furthermore, the dual-wavelength fluorescent nanoprobe has high photostability and colloidal stability, as well as long shelf-life. In vitro cell culture experiments show that the nanoprobe has the ability to label different types of cells (namely, esophageal, prostate, fibroblast and macrophage cell) for fluorescent microscope imaging. More importantly, cell tracking experiments confirm that cell migration and distribution in various organs can be tracked in real time using in vivo whole-body NIR imaging and in vitro microscopic imaging, respectively.
Keywords: Nanoparticle, Nanoprobe, Fluorescence, Histology, In vivo imaging, In vitro imaging, Cell labeling, In vivo cell tracking
Graphical Abstract
1. Introduction
Cell and biological molecule imaging in both in vitro and in vivo provide a great insight to how each component works and interacts.1–3 In recent years, the biological imaging field has grown rapidly with new methods to improve sensitivity, resolution and imaging quality. The most recent discoveries are Magnetic Resonance Imaging (MRI), Computed Tomography (CT), Positron Emission Tomography (PET), and fluorescent imaging. Each method has its own advantages and limitations.4 For example, MRI provides high contrast to soft tissues and unlimited penetration depth for imaging of the entire human body, while suffering from poor spatial resolution, low sensitivity, and lack of molecular information. CT modality has the great advantages of low cost, short acquisition time, and high resolution; however, some shortcomings due to the harmful effects of ionizing radiation and poor sensitivity need to be overcome. Among all imaging modalities, PET shows the highest sensitivity as well as unlimited penetration depth; however, its inherent weaknesses are very low spatial resolution and harmful radiation to the cell/tissue.5 Recently, fluorescent/optical imaging has drawn a lot of attention due to the following advantages: non-invasiveness, super-sensitivity, low cost, and use of non-ionizing radiation. In spite of these benefits, fluorescent imaging has many limitations for in vivo imaging due to light scattering, autofluorescence and poor tissue penetration depth.4,6–7 It is generally believed that multi-imaging modality agents would provide higher sensitivity and accuracy as well as simpler experimental procedures to integrate the observations from both in vitro cell culture and in vivo human/animal studies. Based on this assumption, many new imaging modalities have been developed using combined imagining techniques to compensate for each other’s disadvantages.8–9 For example, optical/MRI dual-imaging nanoprobes were fabricated from glycol chitosan to exhibit high sensitivity and resolution in vivo imaging.10 Furthermore, dual-imaging probe was synthesized by mesoporous silica nanoparticle conjugating europium and gadolinium ions for both in vitro and in vivo imaging.11 Although this nanoprobe gives high contrast imaging, it has poor detection sensitivity and high cell toxicity. Recently, quantum dots were extensively used as imaging probes in cell and animal studies; however, they tend to have high multi-valency and cytotoxicity.12–14 Very recently, a dual-wavelength fluorescent small molecular probe has been developed to estimate sub-surface tissue depth in vivo.15 However, these small molecular fluorescent probes have many inherent limitations, including poor photostability, short circulation time, and low fluorescence quantum yield which limits their utilities in biological system.16 To overcome these shortcomings, a study has shown that multiple dyes can be easily encapsulated into one single probe to enhance image contrast.17 Coincidentally, dye encapsulation can also significantly reduce photobleaching since the matrix where the fluorophores are entrapped is impervious to the biological fluids, and thus, avoids direct contact between the fluorophores and hazardous oxidative reagents. Finally, functional decoration of nanoprobe surface allows us to post-conjugate targeting/binding ligand for passive cell/tissue uptake.17–18 In spite of these promising advantages, to the best of our knowledge, no multiple-wavelength fluorescent nanoprobe has been developed to permit simultaneously whole body NIR imaging and microscopic examination.
To fill the gap, this study’s objective is to design a biocompatible fluorescent nanoprobe for both microscopic examination and NIR imaging using visible and near-infrared fluorescence dye, respectively. There’s a variety of fluorescence dyes that are detectable at different wavelengths and suitable for either in vitro or in vivo studies.19 For in vivo imaging, fluorescence dye agents at NIR wavelength range (from 700nm to 1000 nm), including cyanine, rhodamine and porphyrin, have been used to give high contrast resolution with minimal background fluorescence.19 On the other hand, fluorescent dye agents in visible range, such as diaminophenyl-indole (DAPI), Hoechst, or fluorescein isothiocyanate (FITC), are highly desirable for microscopic imaging and observation.19 Thus, by incorporating these two types of fluorescent dyes, a new cell-labeling probe may be developed for both in vitro and in vivo imaging. It should be noted that, to obtain high accuracy and specificity in both imaging fields, the difference in detectable wavelengths of chosen dyes must be as far from each other as possible to avoid interference, also known as quenching.19 Based on these criteria, we have chosen FITC and 1,1′,3,3,3′,3′-hexamethyl-indotricarbocyanine iodide (HITC iodide) in this investigation. FITC (excitation wavelength at 495nm, emission wavelength at 519nm) is extensively used for labeling nanoparticle, bacteria, as well as antigen for in vitro imaging.19–21 HITC iodide (excitation wavelength at 756nm, emission wavelength at 776nm) has been widely used as a cell membrane labeling agent for in vivo animal imaging.22–23
These two fluorescent agents, FITC and HITC iodide were incorporated into imaging nanoprobe via two different methods. FITC is first chemically conjugated to the nanoparticles by introducing FITC-o-acrylate monomer during polymerization process. The HITC iodide is then embedded into the nanoparticles via physical adsorption using a polymer swelling procedure. These two agents are stabilized in particle form, which is composed of 2-Hydroxyethyl Methacrylate (HEMA), styrene (St), Divinylbenzene (DVB) and acrylic acid (AAc). The purpose of introducing styrene is to provide hydrophobic domains within nanoparticles for fluorophore encapsulation.24 On the other hand, hydrophilic HEMA monomer was included in the nanoparticle synthesis to reduce toxicity of the nanoparticle to cells/tissues.25 Furthermore, to keep integration of the nanoparticles in the media, DVB was added to crosslink the nanoparticles, while acrylic acid helps stabilize the nanoparticle by enhancing colloidal stability, as well as allowing further surface post-modification.26 We then determine the optical properties, stability, and cell compatibility of the new cell-labeling probe. Finally, using both in vitro and in vivo models, we evaluated the dual dyes-loaded fluorescent imaging nanoprobe’s ability to permit in vitro cell labeling and in vivo whole-body imaging for cell tracking.
2. Materials and methods
2.1. Materials
Fluorescein-o-acrylate (MW=386g/mol, FITC-acrylate), 2-Hydroxyethyl Methacrylate (MW=130g/mol, HEMA), styrene (MW=104g/mol, ST), Divinylbenzene (MW=130g/mol, DVB), acrylic acid (MW=72g/mol, AAc). Sodium dodecyl sulfate (SDS), Ammonium persulfate (APS), 1,1′,3,3,3′,3′-hexamethylindotricarbocyanine iodide (HITC iodide), tetrahydrofuran (THF), Dimethyl sulfoxide (DMSO), hydrochloric acid and sodium hydroxide were purchased from Sigma-Aldrich. Fetal bovine serum (FBS), Ham’s F-10 medium, RPMI medium and Dulbecco’s modified Eagle’s medium (DMEM) were obtained from Thermo Fischer Scientific.
2.2. Preparation of HITC-FITC nanoparticle (NP)
FITC-NPs were synthesized using an emulsion polymerization procedure as previously reported.25 Briefly, FITC-acrylate (0.036mmole), ST (14.8mmole), DVB (0.2mmole), along with SDS (50mg) were added in an Erlenmeyer flask with 70mL of distilled water. The mixture was magnetically stirred under nitrogen gas and placed in a circulating water bath at 75 °C. To initiate polymerization, 5mL of APS (0.043mM) water was added after 20 minutes of nitrogen purging, and the reaction was run for an hour. Afterward, HEMA (4mmole) and AAc (1mmole) were mixed in a separate vial then added dropwise into the reaction flask. The reaction was allowed to run for another 2 hours. Dialysis was then performed for 7 days to remove excess reagents. Purified nanoparticles’ size was analyzed using a Dynamic Light Scattering (DLS) (Mircotrac’s Nanotrac UPA 1500, Montgomeryville, PA). Morphology of the nanoparticles was analyzed by a Transmission Electron Microscope H-9500 (Hitachi, Japan). To confirm chemical composition of NPs, Fourier-transform infrared spectroscopy (FTIR) was performed by a Thermo Nicolet 6700 FTIR Spectrometer (Waltham, MA). Fluorescence intensity of FITC was also measured by an Infinite M200 PRO Multimode Microplate Reader (Tecan, Switzerland). In addition, NPs without FITC-acrylate was also synthesized to use as control in photostability tests.
Loading of HITC iodide into the FITC-NPs was carried out as previously described.23–24 5mL of FITC-NP solution (10mg/mL in distilled water) was mixed with various amount (2.5, 10, 40, 160, 640 and 1280μL) of HITC iodide solution (0.5mg/mL in THF). Additional THF was added to each sample to have a total volume of 10mL. Samples were shaken in the dark and at room temperature for 24 hours. Then THF was removed by evaporation for another 24 hours. The nanoparticles were then purified by dialysis against DI water for at least 3 days. Finally, the dual dyes-labeling nanoprobes (HITC-FITC NPs) were obtained and stored at 4°C for further use. The sizes of nanoprobes at different stages of fabrication were measured with DLS. Fluorescent emission and excitation scan were performed using a fluorescent microplate reader. Maximum emission and excitation wavelengths were determined and used to measure fluorescent intensity. The sample with highest intensity for both dyes was selected as the optimal batch for further analysis. NPs without FITC-acrylate was also synthesized and labeled with HITC to use as control in photostability tests.
2.3. HITC-FITC NPs characterization
Purified HITC-FITC-NPs was diluted to 10mg/mL with volume of 20mL. Excess 0.1M HCl was added for complete ionization of any base group. Then sample was titrated with 0.01M NaOH and conductivity was monitored by a Five Easy Conductivity Bench Meter Plus (Mettler-Toledo LLC, Columbus, OH). Carboxyl group was calculated from 2 equivalent points of titration curve.27
To determine loading efficiency, a similar procedure for HITC iodide loading (procedure 2.2) was carried out except without dialysis. Instead, after THF evaporation, the dye-loaded nanoparticle solution was ultra-filtrated using Amicon regenerated cellulose centrifuge filters (MWCO: 3 kDa, Millipore, Billerica, MA). Filtrates were collected, and their absorbance was measured at wavelength of 740nm using a DU 640 Spectrometer (Beckman, Fullerton, CA). The loading efficiency of HITC iodide was quantified based on the equation: Loading efficiency= (Wloaded-dye/WNP) × 100%. Where Wloaded-dye is mass of the encapsulated dye, which was determined with the calibration curve of HITC iodide and WNP is mass of the NPs.23
To determine photostability of fluorophores in HITC-FITC NPs, a HITC-FITC NP solution was exposed under an UV-light (Stratagene 2040 EV Transilluminator, Cambridge Scientific, Watertown, MA), and fluorescence intensity for FITC and HITC iodide was recorded every 30 minutes.28 Free FITC and HITC iodide dyes were used as controls.
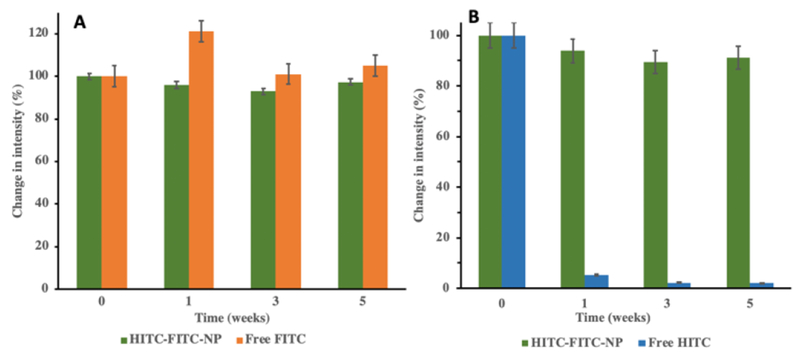
To determine shelf time of the HITC-FITC NPs in an aqueous solution, the HITC-FITC NPs were diluted to concentration of 10 mg/mL, then stored in a 96 well plate and free FITC and HITC dyes were used as the controls. The well plate was completely covered to avoid light exposure and solvent evaporation and was stored at 4 °C. Fluorescence intensity of both HITC-FITC NPs and free dyes (FITC and HITC) were monitored in 0, 1,3 and 5 weeks of incubation.29
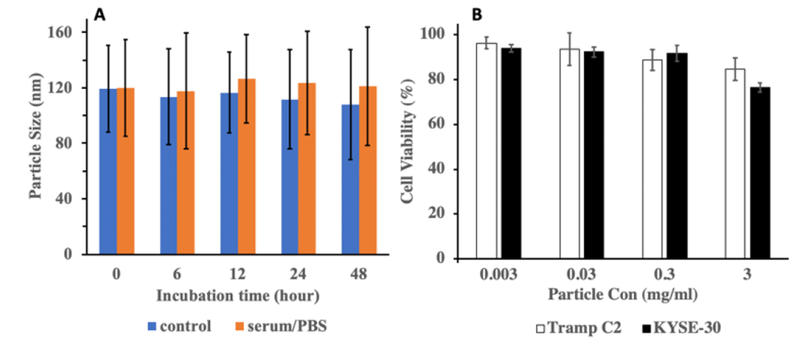
The colloidal stability of HITC-FITC NPs in protein was determined as described previously.30 Briefly, concentration of HITC-FITC NPs was adjusted to 10mg/mL. 3mL of this NPs solution was mixed with 3mL of 10% Fetal Bovine Serum in 1× PBS and incubated at 37°C in Shake ’N Bake™ Rocking Hybridization Oven 136400 (Boekel Scientific, Feasterville, PA). At different time intervals (0, 6, 12, 24 and 48 hours), the NP’s size was monitored using a DLS. HITC-FITC NPs in DI water was used as experimental control.
2.4. In vitro cell culture study
To assess the cytotoxicity and labeling efficiency of the HITC-FITC NPs, 4 types of cell lines were employed in this study. KYSE-30 (human esophageal cancer) and Tramp C2 (murine prostate cancer) were received as gifts from Dr. Zui Pan (University of Texas at Arlington) and Dr. Jer-Tsong Hsieh (University of Texas Southwestern Medical Center at Dallas), respectively. NIH 3T3 (murine fibroblast) and Raw 264.7 (murine macrophage) were purchased from ATCC (Manassas, VA). KYSE 30 esophageal cancer cells were cultured in 1:1 mix of Ham’s F-10 medium and RPMI medium (Thermo Fischer Scientific, Grand Island, NY) supplemented with 5% fetal bovine serum (Atlanta Biologicals, Flowery Branch, GA) and 1% Penicillin-Streptomycin (Gibco, Waltham, MA). Tramp C2 cancer cells were cultured in DMEM 1× high glucose w/L-glutamine & w/o sodium pyruvate (Gibco, Waltham, MA) supplemented with 5% Nu-Serum IV (Collaborative Biomedical Products, Bedford, MA ), 5% FBS, 5μg/mL insulin (Sigma, St. Louis, MO), 25μ/mL Penicillin-Streptomycin and 10M 5α-Androstan-17β-ol-3-one From Sigma in 100% alcohol. NIH 3T3 and Raw 264.7 were cultured in Dulbecco’s modified Eagle’s medium (DMEM; Gibco, Waltham, MA) supplemented with 10% fetal bovine serum.
2.5. Study of cell cytotoxicity
The cell cytotoxicity of the HITC-FITC NP was performed on KYSE-30 and Tramp C2 cells using the Alamar Blue assay.31 Briefly, 10,000 cells were seeded in 96 well plate and incubated with various concentration of HITC-FITC NPs (0.003, 0.03, 0.3 and 3mg/mL). After 24 hours of incubation, the HITC-FITC NP were removed and replaced with 100μL of assay medium consisting of complete medium and 10% Alamar Blue (Bio-Rad, Hercules, CA). After 4 hours of incubation, the assay medium was collected, and the optical density was read at 550 nm and 600 nm. The viability of the cells was reported as percentage of non-treated control groups.
2.6. In vitro cell labeling
NIH 3T3, Tramp C2, KYSE-30, and Raw 264.7 were seeded in 35mm petri dish with No. 1.5 cover glass (MatTek, Ashland, MA). After adhesion of the cells, the medium was replaced with FITC-HITC NPs (0.3 mg/mL) in cell media. After 2-hour incubation, the media were discarded, and the image of the cells was taken using a confocal laser scanning microscopy (Leica TCS SP8 SMD, Leica, Buffalo Grove, IL) at different channels: FITC (Excitation: 490nm, Emission: 525nm Exposure time: 800ms) and White light channel (Exposure time: 100ms).
2.7. In vivo cell tracking
All animal experiment protocols were approved by Animal Care and Use Committee of the University of Texas at Arlington. Cancer metastasis mice model was used to determine the ability of HITC-FITC NPs to track esophageal cancer cell migration in vivo. For that, 1 million of KYSE-30 esophageal cancer cells were harvested and labeled with HITC-FTIC-NPs (300μg/mL). HITC - FITC-NPs labeled esophageal cancer cells were administered intravenously into the 4-8 weeks mice (Balb/c, female, Taconic Biosciences). The whole body in vivo imaging was captured at a different time points using a Kodak In-Vivo Imaging System FX Pro (Carestream Health Inc., New Haven, CT, USA) as described previously.32 At the end of the study, cell biodistribution was performed and histological analysis was carried out as previously described.33 Briefly, 10μm thick of cryosections were made and microscopic images were taken utilizing a Leica fluorescence microscope (Leica Microsystem GmbH, Wetzlar, Germany) combined with a Retiga-EXi CCD camera (QImaging, Surrey, BC, Canada).
2.8. Statistical analysis
All the data were evaluated using two-tailed student t-test and presented as mean ± standard deviation. Statistical analyses of all data were performed by a Student t-test. The results showed significance when p value <0.05. All tests were conducted triplicate for statistical analysis.
3. Result and discussion
1. Characterizations of HITC-FITC NPs
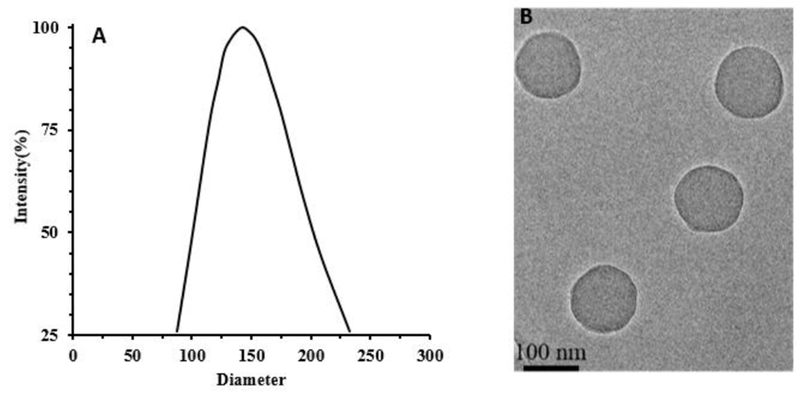
To prepare dual dyes-loaded NPs, FITC fluorophore with different amounts was first chemically incorporated into the nanoparticle during polymerization. By measuring fluorescent intensity of the as-prepared NPs at FITC channel, it was found that, with increasing amount of FITC-acrylate (up to 0.645%w/w), fluorescent intensity of the NPs was augmented. However, further increase of FITC amount (FITC-acrylate, 1.51%w/w) led to the decrease of NPs’ fluorescent intensity (Fig.S1). This phenomenon is possibly due to the self-quenching occurrence of FITC in heavily doped NPs as documented in previous publications.34–35 The NP exhibiting the highest fluorescence intensity (FITC-acrylate, 0.64%w/w) was chosen to prepare dual dyes-loaded NPs. The dynamic light scattering measurement shows (Fig.1A&B) that the average size of the NPs is 146.8nm (in diameter), and the round shape is observed under TEM despite the slight reduction of the NP’s size due to the dehydration of the NPs during the TEM sample preparation.
Fig.1.
A) Particle size distribution of FITC NPs by DLS, B) TEM image of FITC NPs.
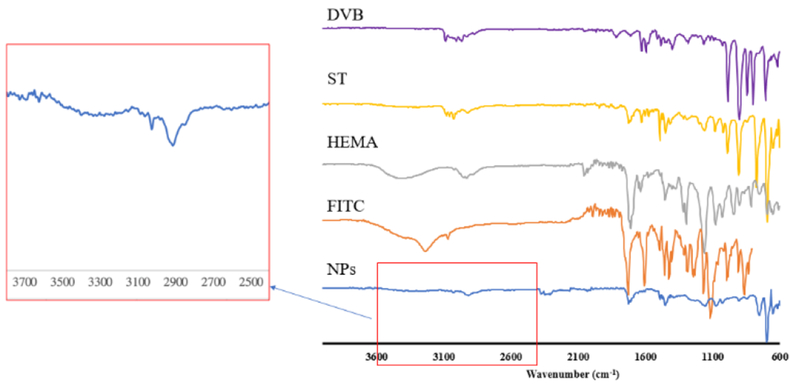
Next, FTIR was performed to confirm NPs’ chemical composition and identify each reagent’s presence (Fig.2). Peak between 3650 and 3200cm−1 confirms the presence of alcohol’s O-H bond from HEMA, while peak at 3300-2500cm−1 shows the presence of acrylic acid’s O-H bond. Peak at 1250-1050cm−1 is due to C-O single bond, as well as peak with strong intensity at 1780-1650cm−1 is a characteristic of C═O double bond, which is from either HEMA or FITC-acrylate. There’s also a strong signal in 1500-1430cm−1 from benzene ring from styrene.36 To improve colloidal stability of the NPs as well as allowing further surface modification, acrylic acid was conjugated into the NPs. Content of carboxyl group in NPs was determined quantitatively to be 0.276mmole of carboxyl group per gram of NPs via a conductivity titration (Fig.2S). The integration of AAc contributes the negative zeta potential (−14.46mV) of NPs.
Fig.2.
FTIR spectra of FITC-NPs and monomers
To prepare HITC-FITC NPs, HITC was further incorporated into the NPs by physical entrapment. Size of the NPs before and after loading of HITC iodide dye was monitored with dynamic light scattering (Fig.S3). One can find that before loading HITC, the size of the NPs is 146.8nm; however, when the NP solution was mixed with an identical volume of THF, the size of the NPs significantly increased to 430nm due to the swelling of the NPs in the THF/water media. After complete removal of THF, the size of the NPs shrunk back to 155nm. The swelling/de-swelling ability of the NPs in different media is highly due to solubility parameter of polymer segments of the NPs in different polar solvents. Namely, the NPs exhibit the ability to either relax in THF or restrain in water.37 As a result, this ability makes tight encapsulation of HITC inside the NPs possible.
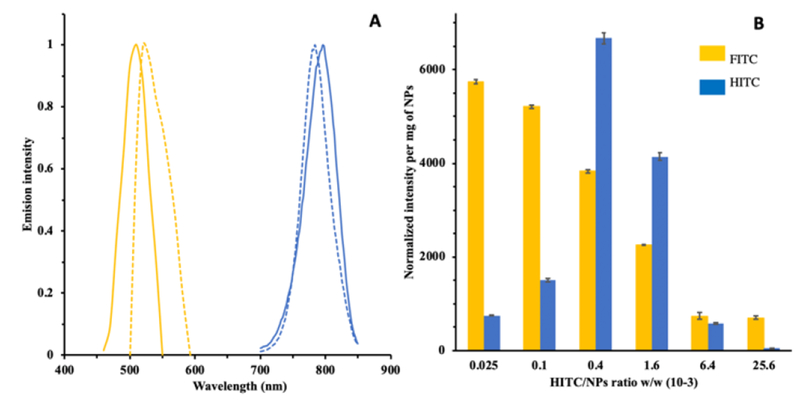
Fluorescence spectrum of the above-prepared HITC-FITC NPs was measured using a fluorescence microplate reader. Emission scan (Fig.3A) confirms successful encapsulation of both FITC and HITC iodide fluorophores into the NPs. In the visible range, a maximal fluorescence peak at 510 nm was observed compared to the one at 520nm for free FITC. Similarly, in the NIR range, HITC-FITC NPs showed a maximal emission peak at 796nm compared to free HITC iodide’s emission peak at 784nm. The slight shift of the spectra for both fluorophores embedded within NP’s environment is possibly dues to the solvent effect (Fig. S4).38 Specifically, the HITC-FITC NPs were dispersed in water during fluorescence measurement while free FITC-acrylate and free HITC iodide (insoluble in water) have to be dissolved in compatible solvents (DMSO for FITC-acrylate and THF for HITC) and then diluted in water. Thus, the differences between solvents’ polarities could cause the fluorescence spectrum shift of FITC and HITC.
Fig.3.
A) Emission fluorescence spectrum of HITC-FITC NPs and their free fluorophores, respectively. FITC emission peak from HITC-FITC NPs (yellow solid line); free FITC emission peak (yellow dot line); HITC emission peak from HITC-FITC NPs (blue solid line); free HITC emission peak (blue dot line). B) Fluorescence intensity for FITC and HITC of HITC-FITC NPs vs. different amount of HITC added during encapsulation. FITC fluorescence intensity was measured at excitation/emission of 470/510nm, and HITC was at 760/796nm. All samples were prepared in DI water.
To search for the optimal amount of HITC dye needed, the FITC-NPs were incubated with various amounts of HITC iodide and their maximal emission intensities were recorded (Fig.3B). We found that the increasing HITC dosages would reduce FITC intensity, while causing a bell-shaped HITC intensity distribution with a maximal emission peak at HITC/NPs ratio of 0.4 ×10⁻³ w/w%. However, measurement of loading efficiency of HITC confirms that the amounts of encapsulated HITC increased with rising HITC dyes in reactions (Table S1.). The bell-shaped fluorescence intensity distribution is possibly due to self-quenching of HITC dye when the concentration of HITC dye loaded into the NPs is too high.38 This phenomenon had been observed in FITC-NP’s preparation (Fig.S1). Interestingly, we also observed that FITC intensity is inversely proportional to amount of HITC iodide loaded into the NPs. Dynamic quenching mechanism cannot explain the observation since dynamic quenching only occurs where there’s an overlap of fluorophores’ fluorescence spectrum. In our case, the spectrum gap between FITC and HITC iodide is more than ~100nm apart, thus, too big for dynamic quenching to efficiently occur.39–40 One possible explanation for this observation is static quenching, at which HITC and FITC form a complex that attenuates fluorescent intensity of FITC.41 Thus, addition of HITC makes more complex formation possible, leading to the decrease in the fluorescent intensity of FITC. Based on these results, HITC-FITC NPs with ratio of 0.4 ×10⁻³ w/w% were prepared for the following studies.
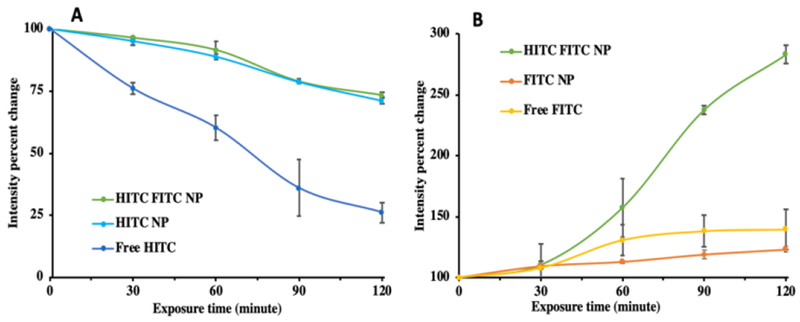
To investigate photostability of the HITC-FITC NPs, HITC-FITC NPs, along with free FITC, HITC and a mixture of single dye NPs, were undergoing accelerated decay by exposure to UV light and changes in fluorescence intensity were monitored (Fig.4A&B). Free HITC iodide was decaying at a faster rate than HITC-FITC NPs and single HITC iodide NPs (Fig.4A). At the end of 2 hours, free HITC iodide decayed completely while fluorescent intensity of HITC-FITC NPs is only reduced by 20%. This is mainly because the polymer matrix of the NPs possibly protects the entrapped HITC from oxygen and UV radiation, thus significantly reducing its photobleaching.23,42 Interestingly, after 2 hours of UV irradiation, fluorescent intensity of FITC fluorophore increases by 1.5-folds in HITC-FITC NPs, while slightly remaining constant in free dye and single dye NPs (Fig.4B). This change in intensity is possibly due to a reduction in static quenching between HITC and FITC fluorophores. As mentioned previously, physical contact between FITC and HITC causes them to form a complex which reduces fluorescent intensity at FITC range. Therefore, with photo bleaching of HITC dye, some FITC is recovered from the FITC/HITC complexes, thus resulting in the slight increase of FITC fluorescence intensity over time.
Fig.4.
Photostability of HITC-FITC NPs. Utilizing UV light exposure, photostability of HITC -FITC NPs and free fluorophores was monitored at A) HITC channel (Excitation: 760nm, Emission: 796nm). B) FITC channel (Excitation: 470nm, Emission: 510nm).
Shelf time of the HITC-FITC NPs in aqueous media was also investigated (Fig.5A&B) using free FITC and free HITC as the controls. Free FITC-acrylate and its NP form were highly photostable during a 5-week period. Similarly, fluorescence intensity of HITC in HITC-FITC NPs has no significant change over 5 weeks (reduced by 9%) even though >90% of free HITC dye has already decayed by the end of the first week. This result suggests that encapsulation of both FITC and HITC into NPs can extend their lifetime.43
Fig.5.
Shelf time of HITC-FITC NPs. The nanoprobes were stored in 4°C in closed environment to avoid light and solvent evaporation, and fluorescence intensity was frequently monitored at A) HITC channel (Excitation: 760nm, Emission: 796nm). B) FITC channel (Excitation: 470nm, Emission: 510nm).
Colloidal stability of the nanoparticles is critical for its use in cell culture system. To predict the colloidal stability of HITC-FITC NPs HITC-FITC NPs were incubated with serum and DI water (as a control), and the change in particle size was monitored using dynamic light scattering over 48 hours (Fig.6A). There is no significant difference in the particle’s size over 48-hrs incubation in protein media as well as DI water (p≤0.05). Thus, HITC-FITC NPs are colloidally stable in presence of protein, suggesting that the HITC-FITC NPs may be used to label cells for in vitro/in vivo applications.
Fig.6.
A) Colloidal stability of HITC-FITC NPs in protein serum and DI water. B) Cytotoxicity of HITC-FITC-NPs to Tramp C2 and KYSE-30 cells.
2. In vitro study
Cytotoxicity of the HITC-FITC NPs to cells was carried out in vitro using Alamar Blue assay, which evaluates cell viability based on the reduction potential of metabolically active cells. The cell viability is reported as a percentage of the reduction of each group compared to the control group without any treatment (Fig. 6B). No significant signs of toxicity were observed for different concentrations of HITC-FITC NPs up to 0.3mg/mL (~85% for Tramp C2 cells and ~77% for KYSE-30 cells). However, the result shows that the cell treatment with 3mg/mL of HITC-FITC NPs for 24 hours triggers significant cytotoxic effect on the KYSE-30 and Tramp C2 cells (p ≤ 0.01). Therefore, concentration of 0.3mg/mL was chosen for all the following in vitro and in vivo studies.
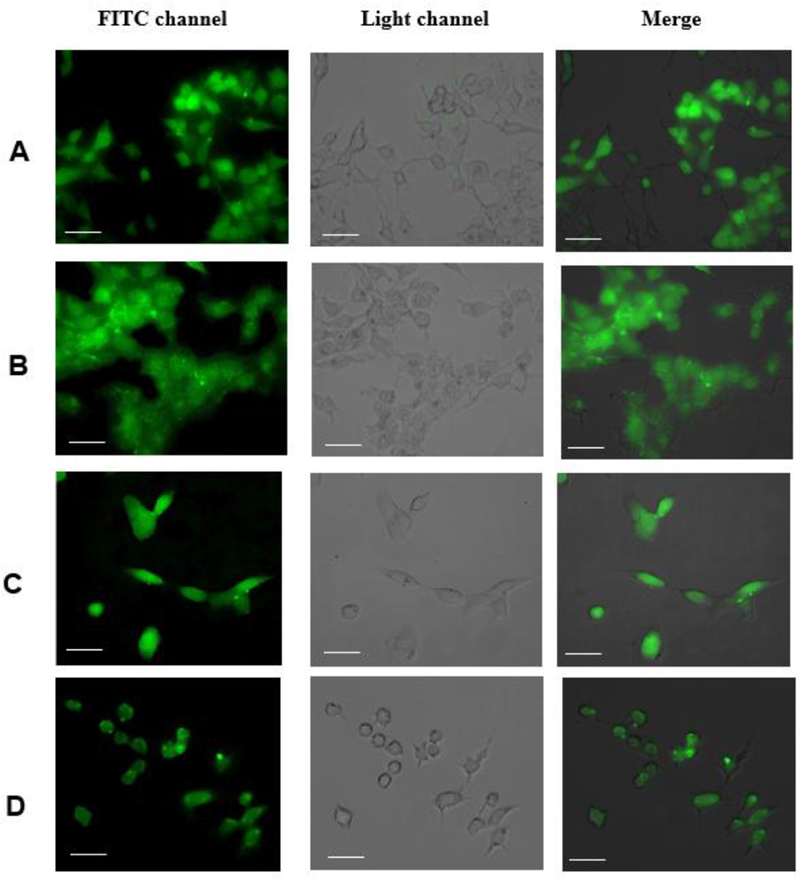
To investigate ability of the HITC-FITC NPs to label cells, 4 different types of cell (namely, KYSE-30 human esophageal cancer cells, Tramp C2 murine prostate cancer cells, NIH 3T3 murine fibroblast cells and murine Raw 264.7 macrophage) were employed. The image results (Fig.7) show that all four types of the cells are successfully labeled with HITC-FITC NPs and can be easily observed under a fluorescence microscope, suggesting that the HITC-FITC NPs can be used to label cells for microscopic examination.
Fig.7.
The efficiency of HITC-FITC-NPs to label the cells. 4 different types of the cells were incubated with 0.3mg/mL of the nanoprobe for 2 hours. The images were taken by fluorescence microscope using FITC channel. A) Murine Fibroblast cells (3T3 cells). B) Murine Prostate cancer (Tramp C2). C) Human Esophageal cancer (KYSE 30 cells). D) Murine Macrophage (Raw 264.7). (The scale bars indicate 5μm)
3. In vivo cell tracking
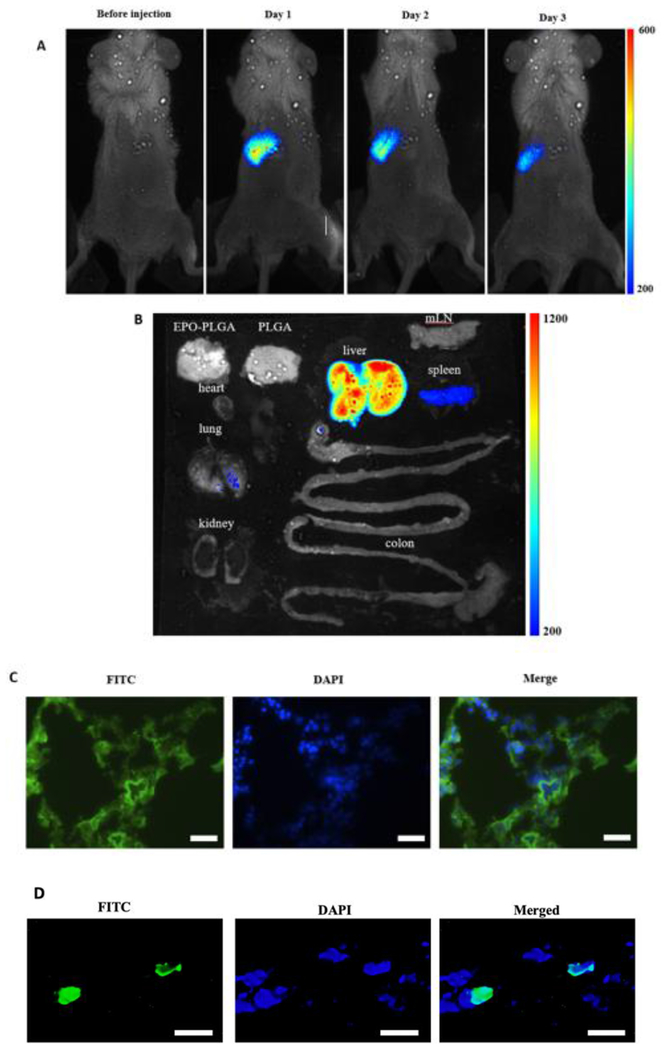
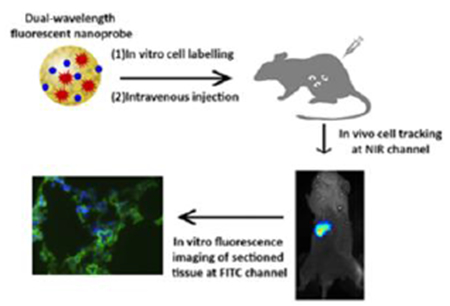
We then investigate the ability of HITC-FITC NPs to track cancer cell migration in vivo. For that, 1 millions of esophageal cancer cells (KYSE-30) labeled with HITC-FITC NPs were injected intravenously from retro-orbital vein. At different time points, whole-body in vivo imaging was captured under an NIR channel (excitation: 760nm and emission: 830nm) and the result was shown in Fig.8A. The high intensity and great affinity of dye in cancer cells allow us to monitor cell accumulation for several days. On the third day, biodistribution was executed to confirm the cell accumulation (Fig.8B). Most labeled cells had moved to the liver while the rest occupied in the spleen and lungs. Histology was utilized to investigate the cellular level of labeled cancer cells. 10μm thick of lung sections were made and images of sections were taken under FITC (HITC -FITC NPs, green) and DAPI (nucleus, blue) channels. Merged pictures show that cancer cells invaded into lungs and the intensity of FITC can be detected even though less cancer cells migrated there (Fig.8C). Therefore, the HITC-FITC NPs allow for cell imaging in both cells labeling in vitro, cell migration tracking in vivo as well as subsequent histology, consecutively.
Fig.8.
In vivo imaging of HITC-FTIC-NPs labeled cancer cells. A) HITC-FITC NPs labeled esophageal cancer cells (KYSE-30) were monitored using Kodak In-Vivo Imaging System for 3 days. Cells accumulated near left ribs of the mouse. B) Biodistribution test showed that most of the NPs labeled cancer cells accumulated at the liver while some deposit in the spleen and the lung after 3 days. Both of in vivo images and biodistribution were taken with excitation wavelength at 760nm and emission wavelength at 830nm. C) Fluorescent microscope images of lung sections were taken under FITC (NPs, green) and DAPI (nucleus, blue) channels. (The scale bars indicate 400μm). D) Higher magnification fluorescent microscope images of lung sections were taken under FITC (NPs, green) and DAPI (nucleus, blue) channels. (The scale bars indicate 10μm)
In addition, in agreement with our findings, Veeranarayanan et al found that FITC loaded nanomaterials has significantly higher photostability while lower photobleaching comparing free FITC dyes.44 Similarly with HITC iodide, particles when loaded with HITC iodide exhibit higher stability as well as higher intensity for in vivo imaging than free dye.45,46 In conclusion, our dual fluorescence wavelength nanoprobes not only simplify cell labeling by shortening the process with one step labeling, but also provide higher quality images and higher stability probe.
4. Conclusion
A dual fluorescence wavelength nanoprobe has been prepared with high fluorescent intensity at both visible and NIR ranges. Comparing to free dyes, the nanoprobe exhibits significantly higher photostability and longer shelf time. Cytotoxicity experiments show that the nanoprobe triggers minimal toxicity to cells. Using four different types of cells, in vitro cell labelling test shows that strong fluorescent intensity can be easily observed under a fluorescence microscope. In vivo cell tracking experiments confirm that we can track cell migration and distribution in various organs using in vivo whole-body and in vitro microscopic imaging, respectively. Therefore, the nanoprobe can be used as a cell labeling agent for both whole body and microscopic imaging applications. Furthermore, by utilizing the existing carboxyl group on the nanoprobe’s surface, cell or biomolecule targeting moiety can be conjugated to improve nanoprobe’s specificity.
Supplementary Material
Acknowledgments
This work was partially supported by grants from NIH GM101776 and Wilson Charitable Foundation Trust.
Footnotes
Publisher's Disclaimer: This is a PDF file of an unedited manuscript that has been accepted for publication. As a service to our customers we are providing this early version of the manuscript. The manuscript will undergo copyediting, typesetting, and review of the resulting proof before it is published in its final citable form. Please note that during the production process errors may be discovered which could affect the content, and all legal disclaimers that apply to the journal pertain.
Conflict of interest
Zhou and Tang have a potential research conflict of interest due to a financial interest with Progenitec Inc. A management plan has been created to preserve objectivity in research in accordance with UTA policy.
References and notes
- 1.Huang Y; Zhou J; Hakamivala A; Wu J; Hong Y; Borrelli J; Tang L Sci Rep. 2017, 7, 10906. [DOI] [PMC free article] [PubMed] [Google Scholar]
- 2.Peng Z; Zhou J; Dacy A; Zhao D; Kearney V; Zhou W; Tang L; Hu W J Biomed Opt. 2017, 22, 16010. [DOI] [PMC free article] [PubMed] [Google Scholar]
- 3.Zhang XH; Wang B; Xia YQ; Zhao SM; Tian ZH; Ning PB; Wang ZL Acs Appl Mater Inter 2018, 10, 25146–25153. [DOI] [PubMed] [Google Scholar]
- 4.Key J; Leary JF Int J Nanomedicine 2014, 9, 711–26. [DOI] [PMC free article] [PubMed] [Google Scholar]
- 5.Hahn MA; Singh AK; Sharma P; Brown SC; Moudgil BM Anal Bioanal Chem 2011, 399, 3–27. [DOI] [PubMed] [Google Scholar]
- 6.Kherlopian AR; Song T; Duan Q; Neimark MA; Po MJ; Gohagan JK; Laine AF Bmc Syst Biol 2008, 2. [DOI] [PMC free article] [PubMed] [Google Scholar]
- 7.Kiani A; Esquevin A; Lepareur N; Bourguet P; Le Jeune F; Gauvrit JY Contrast Media Mol I 2016, 11, 92–98. [DOI] [PubMed] [Google Scholar]
- 8.Liu L; Wang JP; You Q; Sun Q; Song YL; Wang YD; Cheng Y; Wang SY; Tan FP; Li N J Mater Chem B 2018, 6, 4239–4250. [DOI] [PubMed] [Google Scholar]
- 9.Wang YB; Chen JW; Yang B; Qiao HY; Gao L; Su T; Ma S; Zhang XT; Li XJ; Liu G; Cao JB; Chen XV: Chen YD; Cao F Theranostics 2016, 6, 272–286. [DOI] [PMC free article] [PubMed] [Google Scholar]
- 10.Nam T; Park S; Lee SY; Park K; Choi K; Song IC; Han MH; Leary JJ; Yuk SA; Kwon IC; Kim K;Jeong SY Bioconjug Chem 2010, 21, 578–82. [DOI] [PubMed] [Google Scholar]
- 11.Chan MH; Lin HM Biomaterials 2015, 46, 149–58. [DOI] [PubMed] [Google Scholar]
- 12.Zhai C; Zhang H; Du N; Chen B; Huang H; Wu Y; Yang D Nanoscale Res Lett 2011, 6, 31. [DOI] [PMC free article] [PubMed] [Google Scholar]
- 13.Rosenthal SJ; Chang JC; Kovtun O; McBride JR; Tomlinson ID Chem Biol 2011, 18, 10–24. [DOI] [PMC free article] [PubMed] [Google Scholar]
- 14.Jin Z; Hildebrandt N Trends Biotechnol 2012, 30, 394–403. [DOI] [PubMed] [Google Scholar]
- 15.Miller JP; Maji D; Lam J; Tromberg BJ; Achilefu S Biomedical optics express 2017, 8, 3095–3109. [DOI] [PMC free article] [PubMed] [Google Scholar]
- 16.Zhang X; Bloch S; Akers W; Achilefu S Current protocols in cytometry 2012, 60, 12.27. 1–12.27. 20. [DOI] [PMC free article] [PubMed] [Google Scholar]
- 17.Chen G; Roy I; Yang C; Prasad PN Chemical reviews 2016, 116, 2826–2885. [DOI] [PubMed] [Google Scholar]
- 18.Mérian J; Gravier J; Navarro F; Texier I Molecules 2012, 17, 5564–5591. [DOI] [PMC free article] [PubMed] [Google Scholar]
- 19.Arranz A; Ripoll J Front Pharmacol 2015, 6, 189. [DOI] [PMC free article] [PubMed] [Google Scholar]
- 20.Ramachandran S; Thiyagarajan S; Dhinakar Raj G Int J Vet Sci Med 2017, 5, 187–195. [DOI] [PMC free article] [PubMed] [Google Scholar]
- 21.Zhu X; Jin H; Gao C; Gui R; Wang Z Talanta 2017, 162, 65–71. [DOI] [PubMed] [Google Scholar]
- 22.Tang EN; Nair A; Baker DW; Hu WJ; Zhou J J Biomed Nanotechnol 2014, 10, 856–863. [DOI] [PMC free article] [PubMed] [Google Scholar]
- 23.Zhou J; Tsai YT; Weng H; Baker DW; Tang LP Biomaterials 2011, 32, 9383–9390. [DOI] [PMC free article] [PubMed] [Google Scholar]
- 24.Behnke T; Wurth C; Hoffmann K; Hubner M; Panne U; Resch-Genger U J Fluoresc 2011, 21, 937–944. [DOI] [PubMed] [Google Scholar]
- 25.Wu X; Griffin P; Price GJ; Guy RH Mol Pharmaceut 2009, 6, 1449–1456. [DOI] [PubMed] [Google Scholar]
- 26.Sambalova O; Thorwarth K; Heeb NV; Bleiner D; Zhang YC; Borgschulte A; Kroll A Acs Omega 2018, 3, 724–733. [DOI] [PMC free article] [PubMed] [Google Scholar]
- 27.Kawaguchi S; Yekta A; Winnik MA Journal of colloid and interface science 1995, 176, 362–369. [Google Scholar]
- 28.Santra S; Wang K; Tapec R; Tan W Journal of biomedical optics 2001, 6, 160–167. [DOI] [PubMed] [Google Scholar]
- 29.McNamara KP; Rosenzweig Z Analytical Chemistry 1998, 70, 4853–4859. [Google Scholar]
- 30.Lazzari S; Moscatelli D; Codari F; Salmona M; Morbidelli M; Diomede L Journal of nanoparticle research 2012, 14, 920. [DOI] [PMC free article] [PubMed] [Google Scholar]
- 31.Ahmed SA; Gogal RM Jr; Walsh JE Journal of immunological methods 1994, 170, 211–224. [DOI] [PubMed] [Google Scholar]
- 32.Ko C-Y; Wu L; Nair AM; Tsai Y-T; Lin VK; Tang L Biomaterials 2012, 33, 876–885. [DOI] [PMC free article] [PubMed] [Google Scholar]
- 33.Nair A; Shen J; Lotfi P; Ko C-Y; Zhang CC; Tang L Acta biomaterialia 2011, 7, 3887–3895. [DOI] [PMC free article] [PubMed] [Google Scholar]
- 34.Genovese D; Bonacchi S; Juris R; Montalti M; Prodi L; Rampazzo E; Zaccheroni N Angewandte Cliemie 2013, 125 , 6081–6084. [DOI] [PubMed] [Google Scholar]
- 35.Yuan Y; Zhang J; Cao Q; An L; Liang G Analytical chemistry 2015, 87, 6180–6185. [DOI] [PubMed] [Google Scholar]
- 36.Larkin P Infrared and Raman spectroscopy: principles and spectral interpretation. Elsevier: 2017. [Google Scholar]
- 37.Gauthier M; Luo J; Calvet D; Ni C; Zhu X; Garon M; Buschmann M Polymer 2004, 45, 8201–8210. [Google Scholar]
- 38.Lakowicz JR Effects of Solvents on Fluorescence Emission Spectra, In Principles of Fluorescence Spectroscopy, Springer US: Boston, MA, 1983. [Google Scholar]
- 39.Chowdhury S; Wu Z; Jaquins-Gerstl A; Liu S; Dembska A; Annitage BA; Jin R; Peteanu LA The Journal of Physical Chemistry C 2011, 115, 20105–20112. [DOI] [PMC free article] [PubMed] [Google Scholar]
- 40.Willard DM; Carillo LL; Jung J; Van Orden A Nano Letters 2001, 1, 469–474. [Google Scholar]
- 41.Wang L; Li H; Yang Y; Zhang D; Wu M; Pan B; Xing B Water research 2017, 122, 337–344. [DOI] [PubMed] [Google Scholar]
- 42.Saxena V; Sadoqi M; Shao J Journal of Photochemistry and Photobiology B: Biology 2004, 74, 29–38. [DOI] [PubMed] [Google Scholar]
- 43.Rodriguez VB; Henry SM; Hoffman AS; Stayton PS; Li X; Pun SH Journal of biomedical optics 2008, 13, 014025. [DOI] [PubMed] [Google Scholar]
- 44.Veeranarayanan S; Cheruvathoor Poulose A; Mohamed S; Athulya A; Nagaoka Y; Yoshida Y; Maekawa T; Kumar D,S J Fluoresc 2012, 22:537–548. [DOI] [PubMed] [Google Scholar]
- 45.He S; Tourkakis G,; Berezin O; Gerasimchuk N; Zhang, 1 Haying Zhou H; Izraely A; Akers WA; Berezin MYJ Name., 2013. 00, 1–3. [Google Scholar]
- 46.Madala HR; Punganuru SR; Ali-Osman F; Zhang R; SrivenugopaL KS Oncotarget, 2018, 9, 3459–3482. [DOI] [PMC free article] [PubMed] [Google Scholar]
Associated Data
This section collects any data citations, data availability statements, or supplementary materials included in this article.


