Abstract
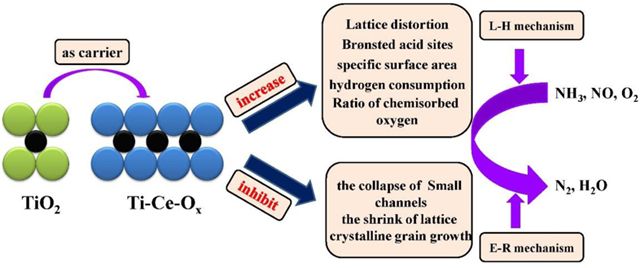
A series of TiO2 catalyst carriers with ceria additives were prepared by a precipitation method and tested for selective catalytic reduction (SCR) of NO by NH3. These samples were characterized by XRD, N2-BET, NH3-TPD, H2-TPR, TEM, XPS and in situ DRIFTS, respectively. Results showed that the appropriate addition of ceria can enhance the catalytic activity and thermostability of TiO2 catalyst carriers significantly. The maximum catalytic activity of Ti-Ce-Ox-500 is 98.5% at 400 °C with a GHSV of 100 000 h−1 and the high catalytic activity still remains even after the treatment at high temperature for 24 h. The high catalytic performance of Ti-Ce-Ox-500 can be attributed to a series of superior properties, such as larger specific surface area, more Brønsted acid sites, more hydrogen consumption, and the higher proportion of chemisorbed oxygen. Ceria atoms can inhibit the crystalline grain growth and the collapse of small channels caused by high temperatures. Furthermore, in situ DRIFTS in different feed gases show that the SCR reaction over Ti-Ce-Ox-500 follows both E-R and L-H mechanisms.
Keywords: TiO2, catalyst carrier, thermostability, nitrogen oxide, selective catalytic, reduction, cerium oxide
Graphical Abstract
1. Introduction
Nitrogen oxides (NOx) are major contributors to certain worsening environment problems such as acid rain and photochemical smog [1–3]. Selective catalytic reduction of NOx with NH3 (NH3-SCR) is a well-established and widely employed technology to reduce NOx from stationary sources [4, 5]. According to its reaction temperature window, the NH3-SCR technology can be divided to low-, medium- and high- temperature reactions [6]. The reaction temperatures from 250 °C to 450 °C are often classified as the medium-temperature region. In heat-engine plants and coal-fired boilers, the most commercially used catalysts are V2O5/TiO2 and CeO2/TiO2 catalysts [7]. However, both the V2O5/TiO2 and CeO2/TiO2 catalysts still suffer a lot from their poor thermostability. In other words, their catalyst carriers can be sintered when the reaction temperature is too high (usually higher than 600 °C) at times, which leads to the decrease of their catalytic activity permanently. Moreover, the sublimation of V2O5 occurs at high temperatures even after modification with molybdenum and tungsten species for the V2O5-based catalyst [8]. Therefore, developing novel medium-temperature catalyst carriers with high thermostability to overcome these disadvantages is an urgent demand.
Owing to its chemical inertness, long-term stability and environmental friendliness, TiO2 has been applied in many fields, such as gas sensor application [9], coating [10] and photocatalysis [11]. TiO2 is often used as a catalyst carrier for the NH3-SCR, and has been employed to develop many catalysts, such as CeO2/TiO2 [12, 13], V2O5/TiO2 [14–17], Ce-W-Ox/TiO2 [18–20], Ce-Zr-Ox/TiO2 [21, 22], Mn-Ce-Ox/TiO2 [23–25] and so on. Along with TiO2, CeO2 is a widely used catalytic material on account of its unique redox properties in many fields such as photocatalysis [26], fuel cell [27] and oxygen permeation membrane [28]. It is well known that the unit cell volume of TiO2 swells after the process at high temperatures. On the other hand, the ionic radius of Ce4+ is larger than that of Ti4+ [29]. The swell action of anatase TiO2 might be suppressed with the appropriate addition of CeO2, thus improved the thermostability.
With this hypothesis, to investigate the effect of CeO2, the pure TiO2 powder (the general commercial catalyst carrier prepared by the precipitation method) and the unpurified TiO2 (from Shandong Gemsky Environmental Technology Corporation) were used as the blank samples. The unpurified TiO2 often contains a small amount of WO3 (Ti: W molar ratio =100: 3). Therefore, WO3 can be replaced by CeO2 in the production of TiO2 to improve the thermostability. Guided by this hypothesis, a novel TiO2 catalyst carrier with high thermostability was synthesized by a precipitation method, which can attract more attention in addressing environmental issues [30]. Through a series of characterization, it was found that ceria atoms can inhibit the collapse of the small channels caused by high temperatures. The large specific surface area, abundant Brønsted acid sites, and the high proportion of chemisorbed oxygen of the TiO2/CeO2 warrant excellent catalytic performance even after the process of high temperatures.
2. Experiment
2.1. Catalyst carrier preparation
The TiO2 powder (general commercial catalyst carrier, blank sample) was prepared by a precipitation method. In a typical preparation, the appropriate hydrous titanium oxides and distilled water were mixed under vigorous stirring. Then the aqua ammonia was added until the pH reached 12. The resulting precipitate was dried at 80 °C for 6 h, then calcined at 500 °C for 2 h (designated as ΤiO2-500). When the thermostability was investigated, the ΤiO2-500 was calcined at 600 °C for 24 h (designated as TiO2-600). Furthermore, two kinds of the unpurified commercial TiO2 for the production of denitration catalysts from the Shandong Gemsky Environmental Technology Corporation were used for comparison (designated as TiO2-SA and TiO2-CA).
CeO2 modulated TiO2 was prepared by a co-precipitation method. The appropriate hydrous titanium oxides, Ce(NO3)3 6H2O, and distilled water were mixed under vigorous stirring (Ti/Ce molar ratio=100:3). Then the same procedures as the TiO2 preparation were followed for the rest preparation steps. The two samples (calcined at 500 °C and 600 °C) were designated as Ti-Ce-Ox-500 and Ti-Ce-Ox-600, respectively.
2.2. Catalytic activity and thermostability measurement
The catalyst carriers (0.5 mL, particle sizes of 0.3~0.45 mm) were added into a fixed-bed quartz reactor (6 mm inner diameter) to investigate the NH3-SCR catalytic activities. The 833 mLmin−1 gas flow rate corresponded to a GHSV of 100 000 h-1. The reactant gas was composed of 600 ppm NO, 600 ppm NH3, 6 vol.% O2 and balance N2. The NO concentrations at the inlet and outlet of the reactor were obtained by the flue gas analyzer (MRU VarioPlus, Germany). The catalytic activity (XNo) was calculated by equation (1). Data were recorded after the reaction was stabilized.
| Eq. (1) |
2.3. Characterization of catalyst carriers
X-ray diffraction (XRD) patterns were obtained from an X-ray diffractometer (Smartlab TM 3Kw, Rigaku, Japan). The scan speed was 5 ° min−1 and the 2θ scans covered 10~80 °. The X-ray photoelectron spectroscopy (XPS) patterns were acquired by an AXIS ULTRA DLD instrument (Al-Κα radiation, 1486.6 eV), and the vacuum degree was maintained at 10−7 Pa. The samples were dried at 100 °C for 24 h to remove moisture and then were tested without surface treatment. The curve fitting was performed by using XPSPEAK 4.1 with a Shirley-type background. The N2 adsorption/desorption isotherms of the samples were obtained by a surface area analyzer (Micromeritics, 2020M V3.00H). After the samples were treated at 350 °C under vacuum for 3 h, the samples were measured at −196 °C. The microstructural nature of the catalysts was investigated using a transmission electron microscopy (JEOL, JEM-2010UHR).
The temperature programmed desorption of ammonia (NH3-TPD) was conducted on the CHEMBET-3000 (Quantachrome) to obtain the surface acid properties. All the catalyst carriers were preheated at 450 °C under a helium stream for 1 h, and then cooled to 60 °C for the ammonia adsorption. Afterwards, ammonia was desorbed from 60 °C to 550 °C at a heating rate of 10 ° C min−1. The Semiautomatic Micromeritics TPD/TPR 2900 instrument was used for the temperature programmed reduction of hydrogen (H2-TPR). All the catalyst carriers were preheated to 400 °C under an argon stream for 1 h, and cooled to 50 °C. Then 5% H2/Ar flow was switched, and the temperature increased from 50 °C to 800 °C at a 10 ° C min−1 heating rate. The data were collected throughout the whole temperature range.
In situ Diffuse Reflectance Infrared Fourier Transform Spectra (in situ DRIFTS) were also collected by a Nicolet is50 spectrometer. All the catalyst carriers were preheated at 300 °C under a N2 stream for 2 h, and then cooled to the desired temperature. For the NH3-adsorption and the NO+O2 adsorption, 600 ppm NH3 and 600 ppm NO+5% O2 were pumped into the system for 30 min, respectively, when the temperature was cooled to 150 °C. Then the in situ DRIFT spectra were collected as the temperature increased. For the reaction between NH3 and adsorbed NO+O2, 600 ppm NO+5% O2 was pumped into the system for 30 min. After the temperature was increased to 450 °C, the flow of NO+O2 was stopped and 600 ppm NH3 started to be pumped into the system. The in situ DRIFT spectra were collected at different times. For the reaction between NO+O2 and adsorbed NH3, the order of gas was inverse but the steps were similar with that of the reaction between NF3 and adsorbed NO+O2.
3. Results and discussion
3.1. Structural and textural characteristics
The XRD patterns of different catalyst carriers were analyzed, and the results were shown in Fig. 1 and Fig. S1. All the reflections of the catalyst carriers provided diffraction patterns for the anatase TiO2 (2θ=25.3 °, 37.8 °, 48.0°, 53.9 °, 55.1 °) (PDF-ICDD 78–2486). The diffraction peak intensities of TiO2-CA and TiO2-SA were similar, but much higher than that of ΤiO2-500, which indicated that the prepared ΤiO2-500 by the precipitation method had poorer crystallinity. As shown in Fig 1 (b), the peaks of ceria was not observed obviously in the spectra of the catalysts, indicating that the ceria species were well dispersed in the TiO2 carriers, entered into the lattice of TiO2 or were present as amorphous species. In addition, the TiO2 peak positions shifted to a lower-angle region (Fig. S1), which implied that the unit cell volume of TiO2 swelled after the process at high temperatures. However, after the doping of ceria, the diffraction peaks of TiO2 shifted to a higher-angle region after the process at high temperatures. In other words, the ceria atom inhibited the swelling of TiO2 caused by high temperatures. The average particle sizes of TiO2 were calculated based on the Scherrer formula and the results were shown in Table 1. The average particle sizes of TiO2-SA and TiO2-CA were higher than those of TiO2-500, indicating that the crystallinity of TiO2 prepared by the precipitation method was suppressed. Moreover, the crystalline grain grown with the increase of temperature and the appropriate addition of ceria inhibited this phenomenon. In a word, ceria atoms inhibit the grain growth and the swelling of TiO2 caused by high temperatures. This would neutralize the negative effect of high temperature on the TiO2 catalyst carrier.
Fig.1.
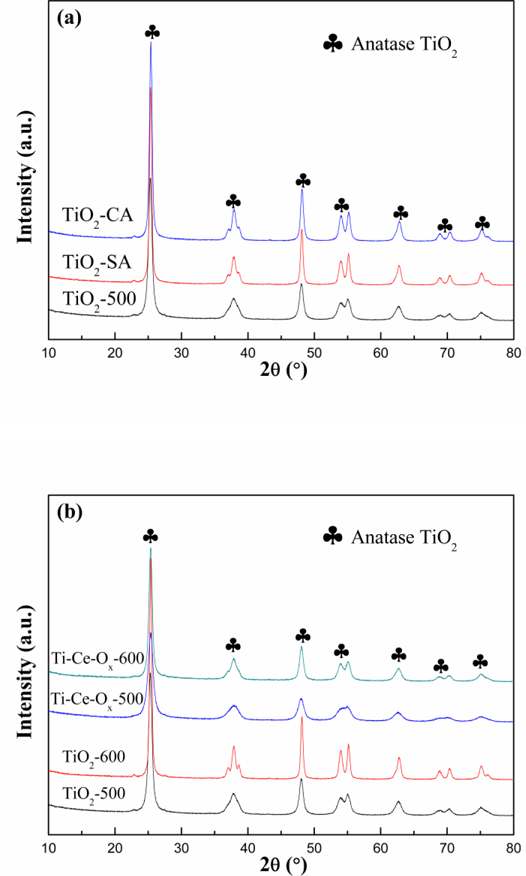
X-ray diffraction patterns of different catalyst carriers.
Table 1.
Crystallite sizes of different catalyst carriers.
| Sample | TiO2-CA | TiO2-SA | TiO2-500 | TiO2-600 | Ti-Ce-Ox-500 | Ti-Ce-Ox-600 |
|---|---|---|---|---|---|---|
| Crystallit e size (nm) |
18.8 | 20.6 | 12.8 | 22.9 | 8.9 | 14.1 |
The microstructural nature of the catalysts was investigated by TEM, and the results were shown in Fig. 2 and Fig. S2. Both the average sizes of TiO2-500 and Ti-Ce-Ox-500 increased obviously after the process at high temperatures. On the other hand, the appropriate addition of ceria inhibited the grain growth, which was consistent with the XRD results. In addition, the lattice fringes with an interplanar spacing of 0.35 nm and 0.235 nm were consistent with the d-spacing of (101) and (001) facets, respectively. As shown in Fig. S2, the addition of ceria exposed the high energy (001) facets of TiO2, which was beneficial for the increase of NH3-SCR activity.
Fig.2.
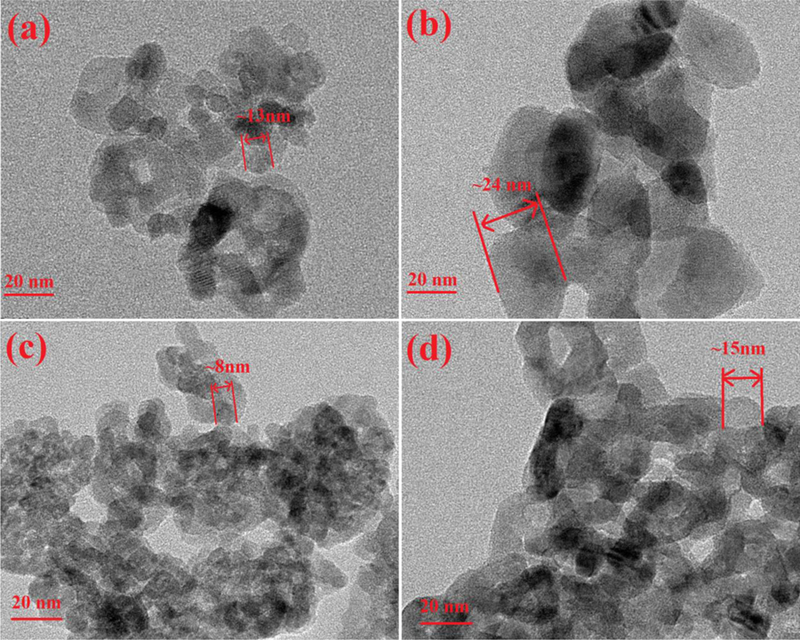
HRTEM images of (a) TiO2-500, (b) TiO2-600, (c) Ti-Ce-Ox-500, and (d) Ti-Ce-Ox-600.
The N2 adsorption-desorption isotherms and pore diameter distribution of different catalyst carriers were also studied. As shown in Fig. 3 (a), all of the N2 adsorption and desorption isotherms were separated at the medium-sized relative pressure, which confirmed the adsorption curve of Langmuir IV. The hysteresis loop of these catalyst carriers belonged to H1-type as defined by IUPAC, implying that structure of these catalyst carriers contained well-ordered channels [31]. As depicted in Fig. 3 (b), the TiO2-500 prepared by the precipitation method had narrower pore diameter distribution than that of TiO2-CA and TiO2-SA. In addition, the pore diameter distribution dispersed and the most probable pore size increased after the process at high temperature. However, the catalyst carriers obtained narrower distribution with appropriate addition of ceria. That is, the addition of ceria inhibited the collapse of small channels caused by the high temperature. The textural characteristics of different catalyst carriers were summarized in Table 2. The increase of the TiO2 crystallite size could reduce the specific surface area. Consequently, the specific surface area of TiO2-500 decreased seriously after the process of high temperature and the specific surface areas of TiO2-500 and TiO2-600 were 129.7 m2.g−1 and 55.3 m2.g−1, respectively. With the addition of ceria, the catalyst carrier increased to 144.3 m2.g−1 and 77.9 m2.g−1, respectively. Furthermore, the specific surface areas of TiO2-CA and TiO2-SA were significantly lower than that of TiO2-500, implying that the TiO2 prepared by the precipitation method had higher specific surface area.
Fig.3.
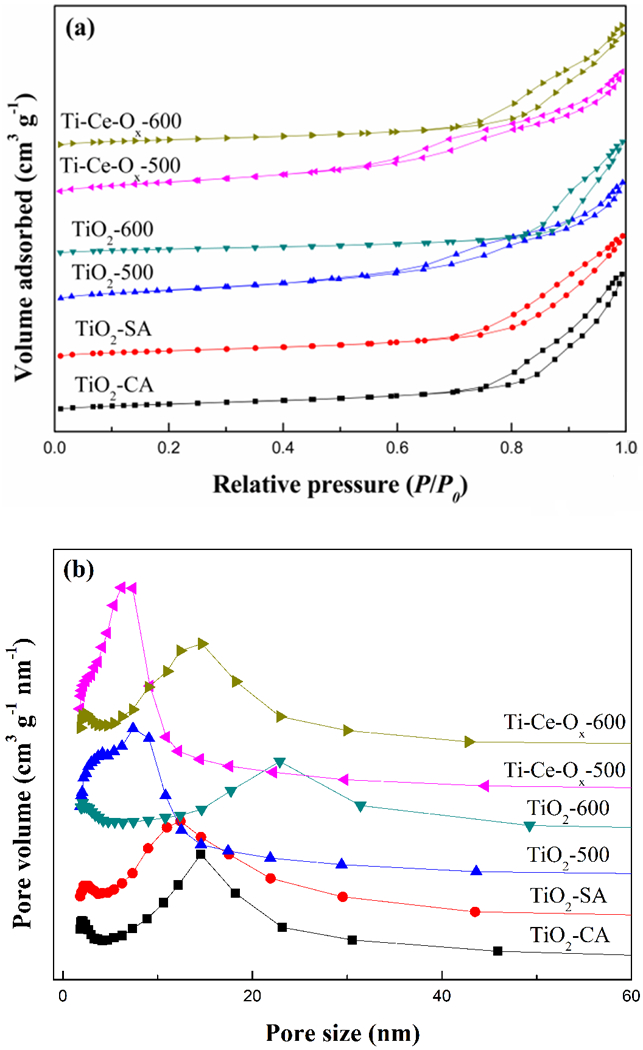
(a) N2 adsorption-desorption isotherms and (b) pore diameter distribution of different catalyst carriers.
Table 2.
Physical properties of different catalyst carriers.
| Sample | BET surface area/(m2·g−1) | Pore volume/(cm3·g−1) | Average pore diameter/nm |
|---|---|---|---|
| TiO2-CA | 78.3 | 0.378 | 15.10 |
| TiO2-SA | 79.9 | 0.339 | 14.29 |
| TiO2-500 | 129.7 | 0.344 | 8.61 |
| TiO2-600 | 55.3 | 0.308 | 17.52 |
| Ti-Ce-Ox-500 | 144.3 | 0.358 | 8.23 |
| Ti-Ce-Ox-600 | 77.9 | 0.337 | 14.39 |
3.2. Surface acid property
It was well known that the surface acid property of a denitration catalyst played an important role in the NH3 adsorption [32]. The surface acid properties of these catalyst carriers were tested by NH3-TPD, and their corresponding profiles were presented in Fig. 4. Previous literatures had proved that the area and position of the NH3 desorption peaks corresponded to the amount and strength of acid sites [33, 34]. All of the ammonia desorption from the catalyst carriers displayed at least two desorption peaks: one desorption peak spanned at 100–300 °C representing the weak acid sites, and one desorption peak spanned at 300–550 °C representing the strong acid sites [35]. As shown in Fig. 4 (a), there were no great difference among the peak positions of TiO2-500, TiO2-SA and TiO2-CA, meaning that the TiO2-500 prepared by the precipitation method had similar strength of acid sites to these two commercial catalyst carriers. As depicted in Fig. 4 (b), both the peak positions shifted to lower temperatures when the catalyst carriers were heated at 600 °C for 24 h, indicating that the strength of acid sites decreased after the treatment of high temperature. In addition, the appropriate addition of ceria contributed to the slight decrease of the strength of strong acid sites for TiO2-500. However, the strength of acid sites was enhanced with the addition of ceria for TiO2–600. In other words, the effect of the ceria addition on the strength of acid sites was not obvious for TiO2.
Fig.4.
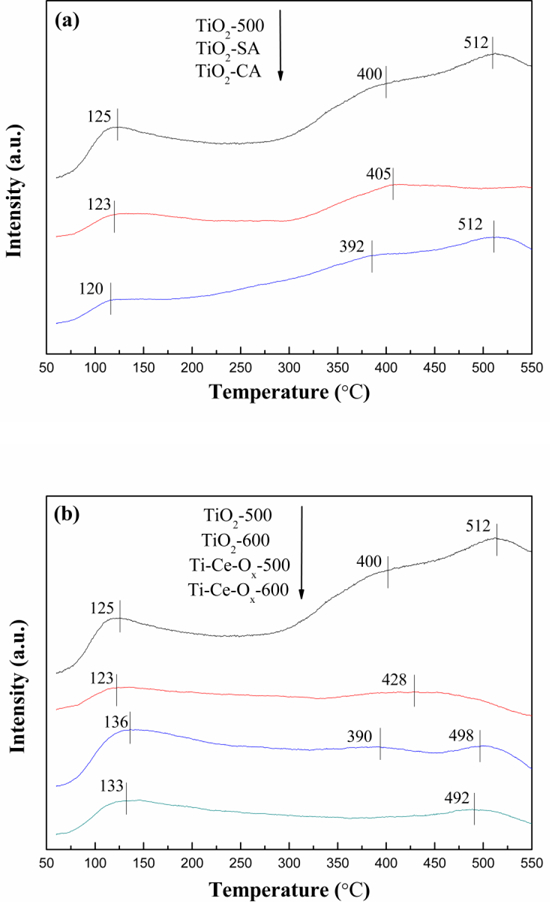
NH3-TPD profiles of different catalyst carriers.
The stability of NH4+ ions bonded on Brønsted acid sites was inferior to that of NH3 molecules coordinated to Lewis acid sites, so the desorption peaks at low temperature (300 °C <) could be ascribed to Brønsted acid sites [34], while the desorption peaks at high temperature (> 300 °C) could be related to Lewis acid sites [36]. The amount of acid sites was calculated and the related result was shown in Table 3. The process of high temperature had no effect on the amount of Brønsted acid sites, but it would reduce obviously the amount of Lewis acid sites. On the other hand, the amount of Lewis acid sites and total amount of acid sites decreased and the amount of Brønsted acid sites increased with the addition of ceria. Moreover, the amounts of acid sites of both TiO2-CA and TiO2-SA were far less than that of TiO2-500.
Table 3.
Surface acid property of different catalysts carriers.
| Sample | weak acidity/(mmol NH3/g-catalyst) | strong acidity/(mmol NH3/g-catalyst) | Total acidity/(mmol NH3/g-catalyst) |
|---|---|---|---|
| TiO2-CA | 0.168 | 1.085 | 1.253 |
| TiO2-SA | 0.209 | 0.327 | 0.536 |
| TiO2-500 | 0.407 | 1.630 | 2.037 |
| TiO2-600 | 0.415 | 0.447 | 0.862 |
| Ti-Ce-Ox-500 | 0.883 | 0.864 | 1.747 |
| Ti-Ce-Ox-600 | 0.751 | 0.346 | 1.097 |
3.3. Reduction behavior
Fig. 5 showed the H2-TPR results of different catalyst carriers to evaluate the redox properties. The peak temperature and hydrogen consumption obtained by H2-TPR patterns were also listed in Table 4. All of the hydrogen reduction of the catalyst carriers displayed one broad peak spanned at 400–600 °C, which was attributed to the reduction of the TiO2 surface. For Ti-Ce-Ox-500 and Ti-Ce-Ox-600, the relative content of CeO2 was so low that there was no obvious reduction peak representing CeO2. The peak position shifted to lower temperatures, whether the catalyst carrier was treated by high temperature or the addition of ceria. Therefore, the redox properties of TiO2-500 could be enhanced by the treatment of high temperature and the addition of ceria. As shown in Table 4, the hydrogen consumption of TiO2-500, TiO2–600, Ti-Ce-Ox-500 and Ti-Ce-Ox-600 was 0.383 mmol-g−1, 0.268 mmol-g−1, 0.561 mmol-g−1 and 0.933 mmol-g−1, respectively. It can be speculated that the hydrogen consumption of TiO2 was reduced by the treatment of high temperature. However, the hydrogen consumption of pure CeO2 was much higher than that of TiO2, and more crystalline CeO2 were formed after the treatment of high temperature rather than existed in the amorphous form. This was the reason why the hydrogen consumption of Ti-Ce-Ox-500 increased after treatment of high temperature. In addition, the hydrogen consumption of TiO2-CA and TiO2-SA was 0.298 mmol g−1 and 0.100 mmol g−1, respectively. The peak temperatures were also higher than those of other catalyst carriers. Therefore, the addition of ceria enhances the redox properties and increases the hydrogen consumption of ΤiO2-500, presenting better properties than that of TiO2-CA and TiO2-SA.
Fig.5.
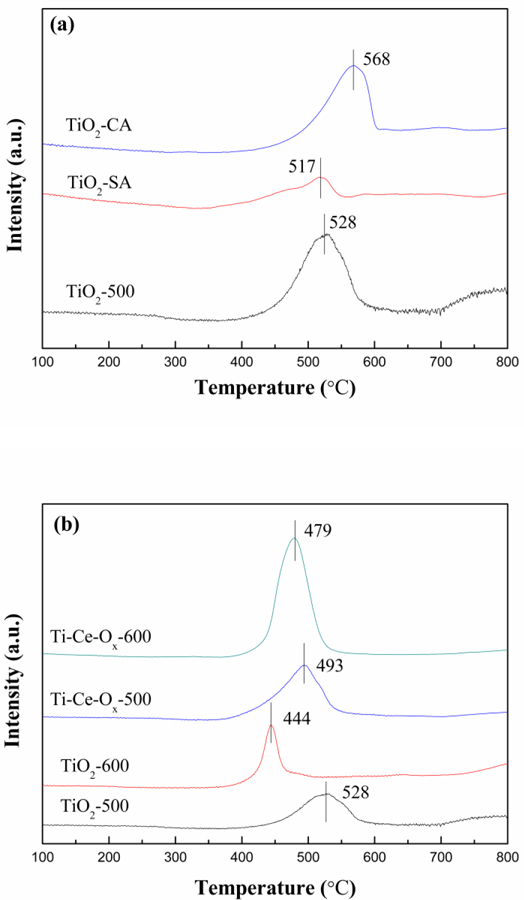
H2-TPR profiles of different catalyst carriers.
Table 4.
Redox property of different catalysts carriers.
| Sample | Peak temperature/(°C) | H2 consumption/(mmol H2/g-catalyst) |
|---|---|---|
| TiO2-CA | 568 | 0.298 |
| TiO2-SA | 517 | 0.100 |
| TiO2-500 | 528 | 0.383 |
| TiO2-600 | 444 | 0.268 |
| Ti-Ce-Ox-500 | 493 | 0.561 |
| Ti-Ce-Ox-600 | 479 | 0.933 |
3.4. Surface analysis
The surface composition and oxidation states of catalyst carriers play an important role in the SCR reaction, so XPS was performed to investigate the surface properties of these catalyst carriers. Fig. 6 showed the O 1s, Ti 2p and Ce 3d XPS high-resolution scan spectra of different catalyst carriers. The O 1s peaks can be fitted into two peaks referred as the chemisorbed oxygen (hereafter denoted as Oα) and the lattice oxygen (hereafter denoted as Oβ) [37]. The O 1s peaks of TiO2 showed a shift toward the lower binding energy with the addition of ceria, indicating strong interactions between Ce and O atoms. In addition, it was reported that the chemisorbed oxygen was the most active oxygen and played a significant role in oxidation of NO to NO2 [38]. It could also promote the progress of the SCR reaction through a ‘fast SCR’ route [39]. Therefore, the content of Oα/(Oα+ Oβ) was calculated and listed in Table 5. The content of Oα/(Oα+ Oβ) on the surface of ΤiO2-500, TiO2-600, Ti-Ce-Ox-500 and Ti-Ce-Ox-600 were 0.47, 0.38, 0.67, and 0.43 respectively. It could be seen that the addition of ceria would increase the proportion of Oα while the treatment of high temperature decreased the proportion.
Fig.6.
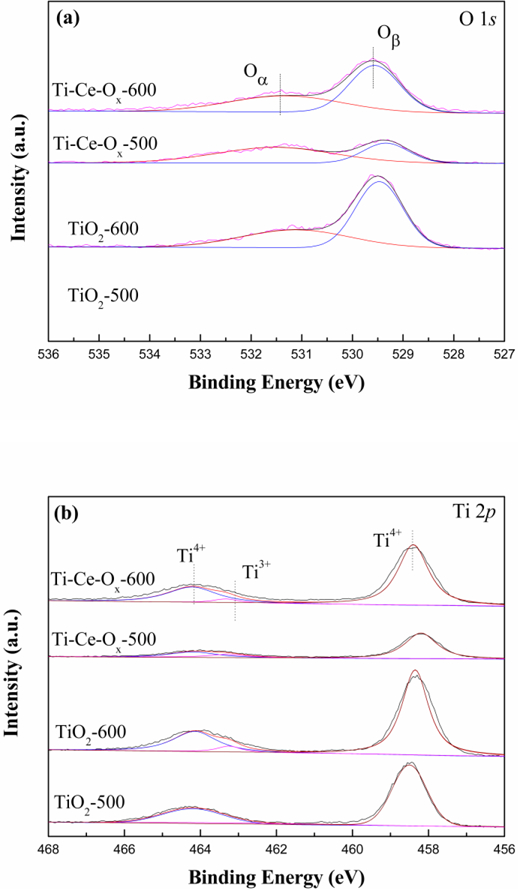
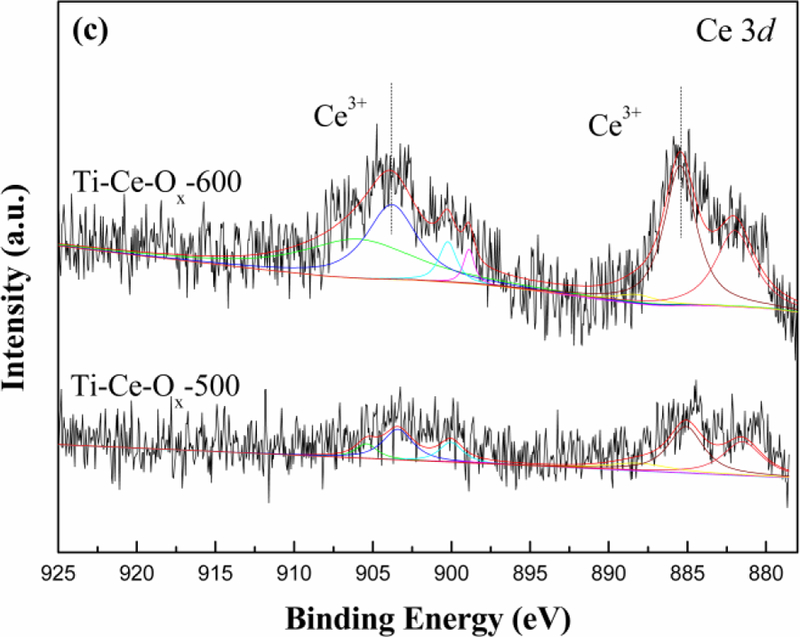
(a) O 1s, (b) Ti 2p and (c) Ce 3d XPS high-resolution scans spectra of different catalyst carriers.
Table 5.
Atomic ratios on the surface of different catalyst carriers.
| Sample | Oα/(Oα+Oβ) | Ti3+/(Ti3++Ti4+) | Ce3+/(Ce3++Ce4+) |
|---|---|---|---|
| TiO2-500 | 0.47 | 0.09 | — |
| TiO2-600 | 0.38 | 0.04 | — |
| Ti-Ce-Ox-500 | 0.67 | 0.10 | 0.49 |
| Ti-Ce-Ox-600 | 0.43 | 0.04 | 0.48 |
As shown in Fig. 6 (b), the Ti 2p can be divided into two contributions of Ti3+ and Ti4+ [40]. The change of binding energy corresponded well to a similar law that the addition of ceria resulted in the negative shift of binding energy peak, implying that the electron transfer between Ce and Ti ions in Ti-Ce-Ox catalyst carriers existed. By comparing with the intensity of Ti 2p, Ti-Ce-Ox decreased dramatically, which indicated that the amount Ti of the catalyst carrier surface decreased with the addition of Ce. Additionally, the atomic ratio of Ti3+ was calculated and shown in Table 5. It can be found that the atomic ratio of Ti3+ decreased obviously after the treatment of high temperature while there was no significant difference between TiO2 and Ti-Ce-Ox catalyst carriers. The TiO2 grain growth was completed gradually, so the amount of Ti3+ defect reduced after the treatment of high temperature.
Fig. 6(c) showed the Ce 3d XPS spectra of Ti-Ce-Ox-500 and Ti-Ce-Ox-600 catalyst carriers. Both of the spectral peaks were observed at binding energies of 903 eV and 884 eV [41–43]. Therefore, the Ce 3d spectra can be ascribed to Ce4+ and Ce3+. The intensity of Ce 3d peaks increased obviously after the treatment of high temperature. In other words, the CeO2 existed mainly in an amorphous form when the calcination temperature was 500 °C. The high temperature treatment resulted in the growth of CeO2 grain and the content of amorphous CeO2 decreased. For the Ti-Ce-Ox catalyst carrier, the existence of Ce3+ meant the formation of oxygen vacancy conducive to of the improvement of the catalytic performance for SCR reactions [44]. In addition, it could be seen from Table 5 that the high temperature had no effect on the atomic ratio of Ce3+.
3.5. Catalytic performance
Fig. 7 displayed the NO conversion obtained from TiO2-500, TiO2-SA and TiO2-CA catalyst carriers. As shown in Fig. 7, the TiO2-500 exhibited the best catalytic performance, which showed the maximum catalytic activity (98.7%) at 500 °C. The maximum catalytic activity decreased in the following order TiO2-500>TiO2-CA>TiO2-SA. As mentioned earlier, TiO2-500 prepared by the precipitation method had poorer crystallinity, larger specific surface area, more acid sites and H2 consumption than these two commercial catalyst carriers. All of these were beneficial to the improvement of catalytic performance.
Fig.7.
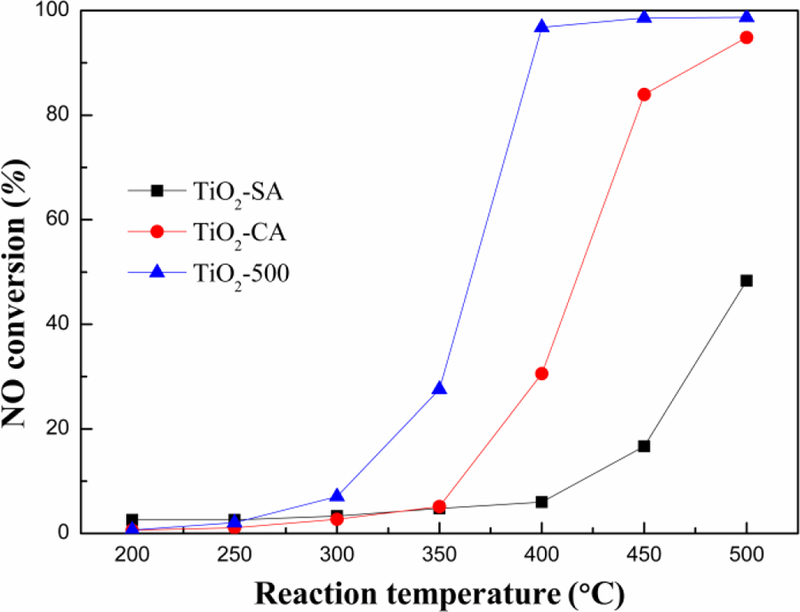
NO conversion ratios of different TiO2 catalyst carriers under 600 ppm NO, 600 ppm NH3, 6% O2, GSHV of 100 000 h−1 and N2 balance gas.
Fig. 8 displayed the catalytic activity obtained from TiO2-500, TiO2-600, Ti-Ce-Ox-500 and Ti-Ce-Ox-600 catalyst carriers. The initiation temperature (the temperature of Xno=50%) of TiO2-500 was 365 °C and its maximum catalytic activity was 98.7% at 500 °C with a GHSV of 100 000 h-1. The appropriate addition of ceria enhanced the catalytic activity significantly. The initiation temperature of Ti-Ce-Ox-500 decreased to 280 °C, and its maximum catalytic activity was 98.5% at 400 °C with a GHSV of 100 000 h-1. Furthermore, comparing with TiO2-500, TiO2-600 showed obvious decrease of the catalytic activity, especially when the reaction temperature was higher than 400 °C (decreased 16% at 400 °C). On the other hand, there were no significant changes in the catalytic activity between Ti-Ce-Ox-600 and Ti-Ce-Ox-500 in the whole testing temperatures. Ti-Ce-Ox-500 exhibited excellent thermostability and its catalytic performance remained high even after the treatment of high temperatures for 24 h. As described above, the ceria atom could inhibit the crystalline grain growth and the collapse of small channels caused by high temperatures. Moreover, the addition of ceria also enhanced the redox properties, increased the hydrogen consumption and the proportion of Oα. These advantages warranted the excellent thermostability of Ti-Ce-Ox-500.
Fig.8.
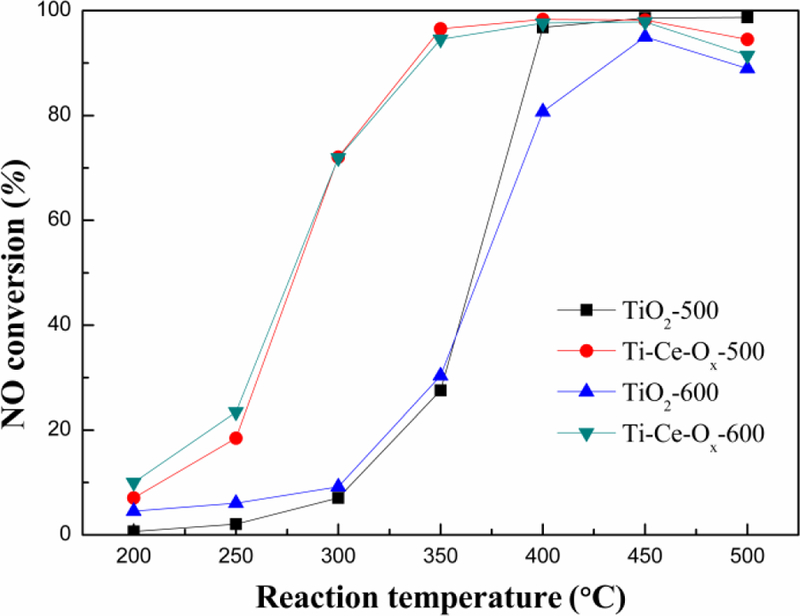
NO conversion ratios of different catalyst carriers under 600 ppm NO, 600 ppm NH3, 6% O2, GSHV of 100 000 h−1 and N2 balance gas.
As shown in Fig. 8, the catalytic activity increases at low temperatures, which may be resulted from the increased effective collision frequency with the increase of temperature [45]. The ammonia oxidation occurred when the reaction temperature was too high, which reduced the reducing agent content, leading to the catalytic activity to decrease gradually. Furthermore, Fig. 9 presented the thermal stability of TiO2-500 and Ti-Ce-Ox-500 catalyst carriers. The catalytic activities of ΤiO2-500 and Ti-Ce-Ox-500 maintained high at 96.8% and 98.5% at 400 °C for 40 h, respectively.
Fig.9.
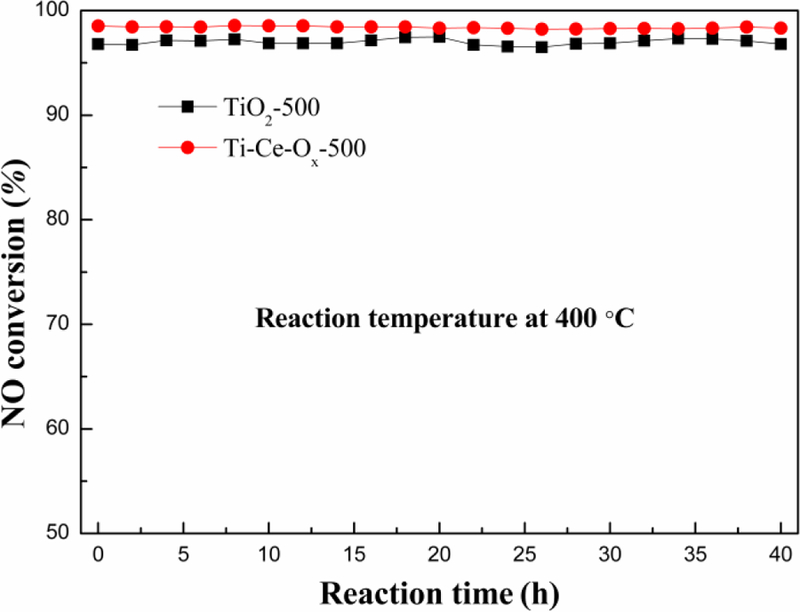
Stability test of different catalyst carriers under 600 ppm NO, 600 ppm NH3, 6% O2, GSHV of 100 000 h−1 and N2 balance gas.
3.6. Interaction with reactants (in situ DRIFTS)
To investigate the NH3-SCR reaction mechanism over Ti-Ce-Ox-500, the in situ DRIFT spectra were collected and the related results were shown in Fig. 10. As shown in Fig. 10 (a), the bands at 3361 cm−1, 3250 cm−1 and 3169 cm−1 can be assigned to NH stretching vibration of coordinated NH3 [46, 47]. The bands at 1601 cm−1 and 1181 cm−1 can be ascribed to asymmetric and symmetric bending of NH bonds in coordinated NH3 on Ti-O-Ti Lewis acid sites [48], and the band at 1284 cm−1 corresponds to the coordinated NH3 on Ti-O-Ce Lewis acid sites [49]. The band at 1446 cm−1 is attributed to asymmetric and symmetric bending vibrations of NH4+ on Brønsted acid sites [50, 51]. Obviously, the Lewis acid sites coexist with Brønsted acid sites on the Ti-Ce-Ox-500 catalyst carrier surface, which implies that NH3 molecules can be adsorbed on both Lewis acid sites and Brønsted acid sites. All the peaks gradually decreased in intensity with the increase of the temperature, indicating that less and less NH3 species wereadsorbed on the Ti-Ce-Ox-500 catalyst carrier surface. As shown in Fig.10 (a), the peak attributed to Brønsted acid sites has disappears and the peak attributed to Lewis acid sites still exists when temperature increased to 400 °C. The analysis results about NH3 adsorption are in accordance with that of NH3-TPD.
Fig.10.
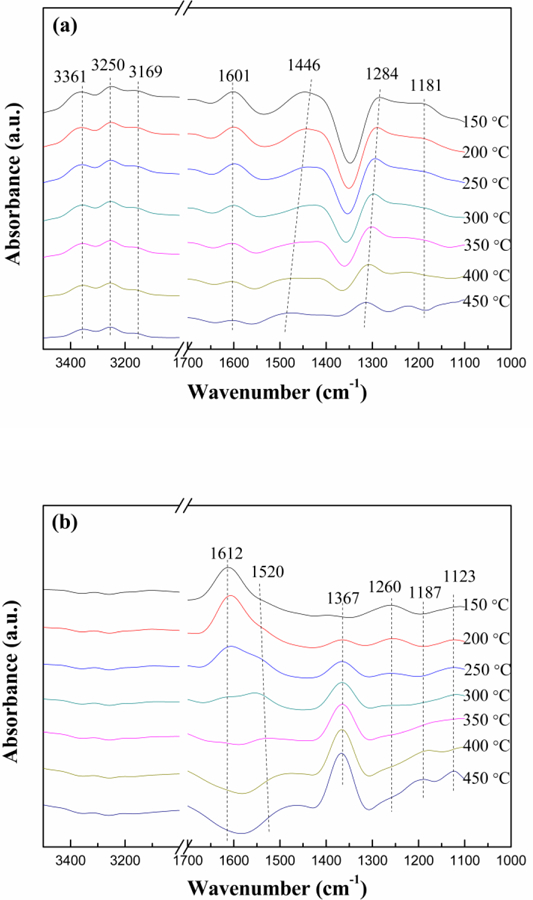
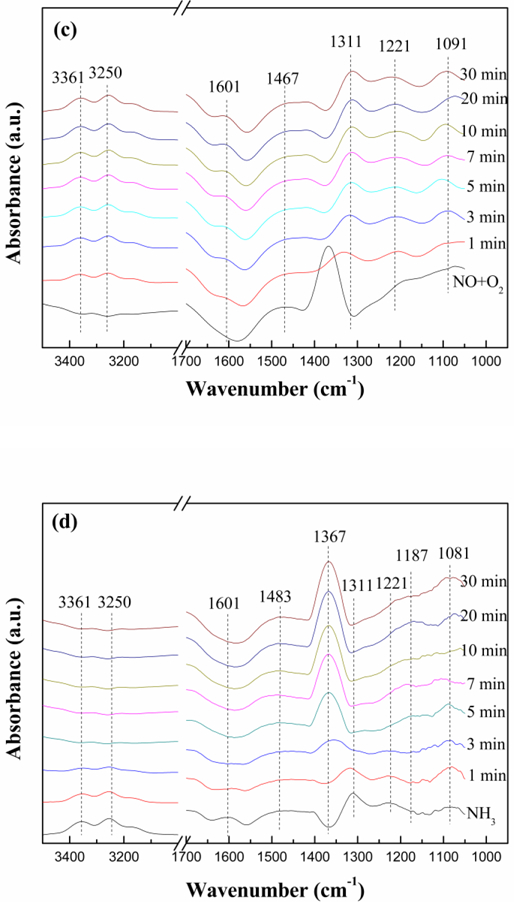
In situ DRIFT spectra of (a) NH3 adsorption, (b) NO+O2 adsorption, (c) NH3 reacted with pre-adsorbed NO+O2, and (d) NO+O2 reacted with pre-adsorbed NH3 at 450 °C over Ti-Ce-Ox-500.
Fig. 10 (b) presented the in situ DRIFT spectra of NO+O2 adsorption over Ti-Ce-Ox-500 at different temperatures. The band at 1612 cm−1 can be attributed to the adsorption of NO2 molecules [52]. The bands at 1520 cm−1 and 1260 cm−1 are due to bidentate nitrates and bridging nitrates, respectively [53, 54]. The bands at 1367 cm−1, 1187 cm−1 and 1123 cm−1 can be ascribed to monodentate nitrite [55, 56]. When the temperature is low (e.g. 150 °C), NO and O2 are absorbed as NO2 and bridging nitrates formed by NO oxidation. As the temperature increases, the bands at 1612 cm−1 and 1260 cm−1 disappear while the bands at 1520 cm−1, 1367 cm−1, 1187 cm−1 and 1123 cm−1 increase gradually. In other words, the main adsorbed species on the Ti-Ce-Ox-500 surface are transformed to bidentate nitrates and monodentate nitrite.
Fig. 10 (c) recorded the in situ DRIFT spectra of the reaction between NH3 and preadsorbed NO+O2 species at 450 °C for different time periods. For the Ti-Ce-Ox-500 catalyst carrier, the NO+O2 co-adsorption resulted in the appearance of bidentate nitrates (1467 cm−1) and monodentate nitrite (1367 cm−1), which was also proven in Fig.10 (b). After the introduction of NH3, the bands due to monodentate nitrite disappeared in 1 min while the band corresponding to bidentate nitrate still existed. This indicates that the bidentate nitrate can exist stably on the Ti-Ce-Ox-500 catalyst carrier surface at 450 °C. Meanwhile, the intensity of bands attributed to adsorbed NH3 species (coordinated NH3 and NH4+ species) increased gradually. Therefore, the monodentate nitrite reacted with NH3 on the Ti-Ce-Ox-500 catalyst carrier surface and the reaction rate was very high. In addition, the intensity of bands attributed to adsorbed NH3 species remained unchanged when the time reached to 10 min. The change of the spectra shows that the reaction between NH3 and pre-adsorbed NO+O2 species agrees with the Langmuir-Hinshelwood (L-H) mechanism and the Ti-Ce-Ox-500 is a good carrier for NH3-SCR.
Fig.10 (d) recorded the in situ DRIFT spectra of the reaction between NO+O2 and pre-adsorbed NH3 species at 450 °C for different time periods. After the introduction of NH3, all bands belonging to the NH3 species, such as NH stretching vibration (3361 cm−1 and 3250 cm−1), the coordinated NH3 to Lewis acid sites (1601 cm−1, 1311 cm−1 and 1232 cm−1), the bending vibrations of NH4+ on Brønsted acid sites (1483 cm−1) and the weakly adsorbed NH3 (1081 cm−1) became more and more weak with the increasing exposed time of NO+O2 [57]. In the meantime, the intensity of bands ascribed to monodentate nitrite (1367 cm−1 and 1187 cm−1) increased gradually and replaced the bands of NH3 species completely within 5 min. So both coordinated NH3 and ionic NH4+ can react with NO, and both of them play a significant role in the SCR reaction [58]. The change of the spectra illustrated that the reaction between NO+O2 and pre-adsorbed NH3 species accords with the Eley-Rideal (E-R) mechanism.
3.7. Reaction mechanism
Combined with aforementioned reactions, the NH3-SCR over Ti-Ce-Ox-500 catalyst carrier followed both L-H and E-R mechanisms. The in situ DRIFT spectra has proven that both the reaction of adsorbed monodentate NO2- with adsorbed NH4+ and that of adsorbed NH4+ with gas-phase NO existed over the Ti-Ce-Ox-500 catalyst carrier surface. Thus, the reaction mechanism of Ti-Ce-Ox-500 was proposed and displayed in Scheme 1. The ceria atoms entered into the lattice of TiO2, inhibiting the shrinkage of lattice and the collapse of small channels caused by high temperatures. Therefore, the Ti-Ce-Ox-500 is more suitable for the catalyst carrier for the NH3-SCR reaction.
Scheme. 1.
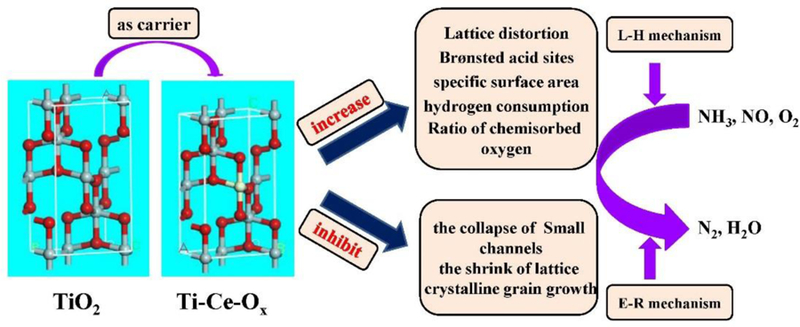
The proposed NH3-SCR reaction mechanism over Ti-Ce-Ox-500.
For the reaction between NH3 and pre-adsorbed NO+O2 species, the bands attributed to adsorbed NH3 species (coordinated NH3 and NH4+) existed within 1 min and the monodentate NO2- disappeared. In addition, the adsorption of NH3 was stronger than that of NO+O2 [36]. It can be speculated that the adsorption of NH3 was obligatory for the NH3-SCR reaction [57], Therefore, the NH3-SCR occurred by the following reaction:
| Eq. (2) |
| Eq. (3) |
As to the reaction between NO+O2 and pre-adsorbed NH3 species, the bands attributed to monodentate NO2- gradually appeared and strengthened after the NH4+ disappeared, and the reaction time lasted for 5 min, which indicated that the reaction of NH4+ and gas-phase NO was the rate-controlling step. In other words, the NH3-SCR reaction occurred via the following reaction mechanism:
| Eq. (4) |
| Eq. (5) |
4. Conclusions
In this work, a series of TiO2 catalyst carriers with the modulation of CeO2 were synthesized by a precipitation method, and then used as catalyst carriers to study the thermostability and catalytic performance in the selective catalytic reduction of NO by NH3. It was found that appropriate addition of CeO2 can enhance the catalytic activity and thermostability of TiO2. This is mainly because ceria atoms inhibit the crystalline grain growth and the collapse of small channels caused by high temperatures. All these factors contributed to the enhanced thermostability of TiO2, as evidenced by a series of characterizations by XRD, N2-BET, NH3-TPD, H2-TPR, XPS, TEM and in situ DRIFTS. Furthermore, the addition of ceria also enhanced the redox properties, and increased the hydrogen consumption and the proportion of surface chemisorbed oxygen, which guaranteed superior catalytic activity of the Ti-Ce-Ox-500 at low temperatures. At the last, the reaction mechanism was discussed based on the in situ DRIFT spectra. It was found that the SCR reaction over Ti-Ce-Ox-500 followed both E-R and L-H mechanisms. With enhanced thermostability and excellent catalytic performance for NH3-SCR, Ti-Ce-Ox-500 has great potential for wide industrial applications.
Supplementary Material
Highlights.
The CeO2 modified novel Ti12 catalyst carriers exhibit excellent thermostability for selective catalytic reduction of NO by NH3.
The TiO2/CeO2 catalyst carriers still maintain excellent catalytic activity even after the treatment of high temperature for 24 h.
In situ DRIFTS in different feed gases show that the SCR reaction over Ti-Ce-Ox-500 follows both E-R and L-H mechanisms.
The TiO2/CeO2 catalyst carriers have great potential for wide industrial applications.
Acknowledgements:
We would like to acknowledge the financial support from the National Natural Science Foundation of China (51772149), National Key Research and Development Program of China (2016YFC0205500), the Priority Academic Program Development of Jiangsu Higher Education Institutions (PAPD), the U.S. NSF-PREM program (DMR 1205302), the National Institute of Allergy and Infectious Disease of the NIH (R21AI107415), Emily Koenig Meningitis Fund of Philadelphia Foundation, the Postgraduate Research & Practice Innovation Program of Jiangsu Province, and the Medical Center of the Americas Foundation. X.L. is also grateful to support from the “1000 Talents” program from Tianjin, China.
Footnotes
Publisher's Disclaimer: This is a PDF file of an unedited manuscript that has been accepted for publication. As a service to our customers we are providing this early version of the manuscript. The manuscript will undergo copyediting, typesetting, and review of the resulting proof before it is published in its final citable form. Please note that during the production process errors may be discovered which could affect the content, and all legal disclaimers that apply to the journal pertain.
References:
- [1].Li Y, Wan Y, Li YP, Zhan SH, Guan QX, Tian Y, ACS Appl. Mater. Inter. 8 (2016) 5224–5233. [DOI] [PubMed] [Google Scholar]
- [2].Li Y, Li YP, Wang PF, Hu WP, Zhang SG, Shi Q, Zhan SH Chem, Eng. J. 330 (2017) 213–222. [Google Scholar]
- [3].Sliang Z, Cao JM, Wang L, Guo YL, Lu GZ, Guo Y, Catal. Today. 281 (2017) 605–609. [Google Scholar]
- [4].Zhao HW, Li HS, Li XH, Liu MK, Li YD, Catal. Today. 297 (2017) 84–91. [Google Scholar]
- [5].Paolucci C, Khurana I, Parckh AA, Li SC, Shill AJ, Li H, Di Iorio JR, Albarracin-Caballero JD, Yezerets A, Miller JT, Delgass WN, Ribeiro FH, Schneider WF, Gounder R, Science 357 (2017) 898–903. [DOI] [PubMed] [Google Scholar]
- [6].Zhan SH, Zhang H, Zhang Y, Shi Q, Li Y, Li XJ, Appl. Catal. B: Environ. 203 (2017) 199–209. [DOI] [PMC free article] [PubMed] [Google Scholar]
- [7].Weng XL, Dai XX, Zeng QS, Liu Y, Wu ZB, J. Colloid Interf. Sci. 461 (2016) 9–14. [DOI] [PubMed] [Google Scholar]
- [8].Tang CJ, Zhang HL, Dong L, Catal. Sci. Technol. 6 (2016) 1248–1264. [Google Scholar]
- [9].Appelhans LN, Finnegan PS, Massey LT, Luk TS, Rodriguez MA, Brumbach MT, McKenzie B, Craven JM, Sens. Actuators B: Chem. 228 (2016) 117–123. [Google Scholar]
- [10].Córdoba LC, Montemor MF, Coradin T, Corros. Sci. 104 (2016) 152–161. [Google Scholar]
- [11].Xiao SN, Zhu W, Liu PJ, Liu FF, Dai WR, Zhang DQ, Chem H W, Li X, Nanoscale. 8 (2016) 2899–2907. [DOI] [PubMed] [Google Scholar]
- [12].Gao X, Jiang Y, Zhong Y, Luo ZY, Cen K, J. Hazard. Mater. 174 (2010) 734–739. [DOI] [PubMed] [Google Scholar]
- [13].Liu ZM, Zhang SX, Li JH, Ma LL, Appl. Catal. B: Environ. 144 (2014) 90–95. [Google Scholar]
- [14].Chen L, Li JH, Ge MF, J. Phys. Chemi. C. 113 (2009) 21177–21184. [Google Scholar]
- [15].Kompio PGWA, Brückner A, Hipler F, Auer G, Löffler E, Grünert W, J. Catal. 286 (2012) 237–247. [Google Scholar]
- [16].Liu ZM, Li Y, Zhu TL, Su H, Zhu JZ, Ind. Eng. Chem. Res. 53 (2014) 12964–12970. [Google Scholar]
- [17].Song I, Youn S, Lee H, Lee SG, Cho SJ, Kim DH, Appl. Catal. B: Environ. 210 (2017) 421–431. [Google Scholar]
- [18].Zhang SL, Zhong Q, Shen YG, Zhu L, Ding J, J. Colloid Interf. Sci. 448 (2015) 417–426. [DOI] [PubMed] [Google Scholar]
- [19].Yan LJ, Liu YY, Hu H, Li HR, Shi LY, Zhang DS, ChemCatChem. 8 (2016) 2267–2278. [Google Scholar]
- [20].Shan WP, Liu FD, He H, Shi XY, Zhang CB, Appl. Catal. B: Environ. 115–116 (2012) 100–106. [Google Scholar]
- [21].Jin QJ, Shen YS, Zhu SM, J. Colloid Interf. Sci. 487 (2017) 401–409. [DOI] [PubMed] [Google Scholar]
- [22].Li Y, Wan Y, Li YP, Zhan SH, Guan QX, Tian Y, Appl. Catal. A: Gen. 528 (2016) 150–160. [Google Scholar]
- [23].Jin RB, Liu Y, Wang Y, Cen WL, Wu ZB, Wang HQ, Weng XL, Appl. Catal. B: Environ. 148-149 (2014) 582–588. [Google Scholar]
- [24].Peng Y, Li JH, Si WZ, Li X, Shi WB, Luo JM, Fu J, Crittenden J, Hao JM, Chem. Eng. J. 269 (2015)44–50. [Google Scholar]
- [25].Zhang LJ, Cui SP, Guo HX, Ma XY, Luo XG, J Mol. Catal. a: Chem. 390 (2014) 14–21. [Google Scholar]
- [26].Zeng M, Li YZ, Mao MY, Bai JL, Ren L, Zhao XJ, ACS Catal. 5 (2015) 3278–3286. [Google Scholar]
- [27].Baneshi J, Haghighi M, Jodeiri N, Abdollahifar M, Ajamein H, Energ. Convers. Manage. 87 (2014) 928–937. [Google Scholar]
- [28].Yin X, Hong L, Liu ZL, J. Membrane Sci. 268 (2006) 2–12. [Google Scholar]
- [29].Yong RA, Sakthivel A, Moss TS, Paiva-Santos CO, J. Appl. Crystallogr. 28 (1995) 366–367. [Google Scholar]
- [30].Dou M, Garcia JM, Zhan S, Li X, Chem. Comm. 52 (2016) 3470–3473. [DOI] [PMC free article] [PubMed] [Google Scholar]
- [31].Peng Y, Li KZ, Li JH, Appl. Catal. B: Environ. 140–141 (2013) 483–492. [Google Scholar]
- [32].Lietti L, Nova I, Tronconi E, Forzatti P, Catal. Today. 45 (1998) 85–92. [Google Scholar]
- [33].Michalow-Mauke KA, Lu Y, Kowalski K, Graule T, Nachtegaal M, Krocher O, Ferri D, ACS Catal. 10 (2015) 5657–5672. [Google Scholar]
- [34].Yao XJ, Zhao RD, Chen L, Du J, Tao CY, Yang FM, Dong L, Appl. Catal. B: Environ. 208 (2017) 82–93. [Google Scholar]
- [35].Ning P, Song ZX, Li H, Zhang QL, Liu X, Zhang JH, Tang XS, Huang ZZ, Appl. Surf. Sci. 332 (2015) 130–137. [Google Scholar]
- [36].Zhan SH, Zhang H, Zhang Y, Shi Q, Li Y, Li XJ, Appl. Catal. B: Environ. 203 (2017) 199–209. [DOI] [PMC free article] [PubMed] [Google Scholar]
- [37].Zhang QL, Liu X, Ning P, Song ZX, Li H, Gu JJ, Catal. Sci. Technol. 5 (2015) 2260–2269. [Google Scholar]
- [38].Wu ZB, Jin RB, Liu Y, Wang HQ, Catal. Commun. 9 (2008) 2217–2220. [Google Scholar]
- [39].Liu J, Li XY, Zhao QD, Ke J, Xiao HN, Lv XJ, Liu SM, Tade M, Wang SB, Appl. Catal. B: Environ. 200 (2017) 297–308. [Google Scholar]
- [40].Liu Y, Fang PF, Cheng YL, Gao YP, Chen FT, Liu Z, Dai YQ, Chem. Eng. J. 219 (2013) 478–485. [Google Scholar]
- [41].Smirnov MY, Graham GW, Catal. Lett. 72 (2001) 39–44. [Google Scholar]
- [42].Han J, Meeprasert J, Maitarad P, Nammuangruk S, Shi LY, Zhang DS, J. Phys. Chemi. C. 120 (2016) 1523–1533. [Google Scholar]
- [43].Boningari T, Pappas DK, Ettireddy PR, Kotrba A, Smirniotis PG, Ind. Eng. Chem. Res. 54 (2015) 2261–2273. [Google Scholar]
- [44].Jin QJ, Shen YS, Zhu SM, Liu Q, Li XH, Yan W, J. Rare Earth. 34 (2016) 1111–1120. [Google Scholar]
- [45].Shen YS, Zong YH, Ma YF, Zhu SM, Jin QJ, Fuel. 180 (2016) 727–736. [Google Scholar]
- [46].Liu Y, Cen WL, Wu ZB, Weng XL, Wang HQ, J. Phys. Chemi. C. 116 (2012) 22930–22937. [Google Scholar]
- [47].Chen L, Li JH, Ge MF, Environ. Sci. Technol. 44 (2010) 9590–9596. [DOI] [PubMed] [Google Scholar]
- [48].Long RQ, Yang RT, J. Catal. 190 (2000) 22–31. [Google Scholar]
- [49].Zhan SH, Qiu MY, Yang SS, Zhu DD, Yu HB, Li Y, J. Mater. Chem. A. 2 (2014) 20486–20493. [Google Scholar]
- [50].Cao F, Xiang J, Su S, Wang PY, Hu S, Sun LS, Fuel Process. Technol. 135 (2015) 66–72. [Google Scholar]
- [51].Liu Y, Gu TT, Weng XL, Wang Y, Wu ZB, Wang HQ, J. Phys. Chemi. C. 116 (2012) 16582–16592. [Google Scholar]
- [52].Li Y, Wan Y, Li YP, Zhan SH, Guan QX, Tian Y, ACS Appl. Mater. Inter. 8 (2016) 5224–5233. [DOI] [PubMed] [Google Scholar]
- [53].Liu ZM, Yi Y, Li JH, Woo SI, Wang BY, Cao XZ, Li ZX, Chem. Commun. 49 (2013) 7726–7728. [DOI] [PubMed] [Google Scholar]
- [54].Ettireddy PR, Ettireddy N, Boningari T, Pardemann R, Smirniotis PG, J. Catal. 292 (2012) 53–63. [Google Scholar]
- [55].Yang SJ, Wang CZ, Li JH, Yan NQ, Ma L, Chang HZ, Appl. Catal. B: Environ. 110 (2011) 71–80. [Google Scholar]
- [56].Fornasaria G, Trifiroa F, Vaccaria A, Prinettob F, Ghiottib G, Centic G, Catal. Today. 75 (2002) 421–429. [Google Scholar]
- [57].Gao G, Shi JW, Liu C, Gao C, Fan ZY, Niu CM, Appl. Surf. Sci. 411 (2017) 338–346. [Google Scholar]
- [58].Wang D, Zhang L, Kamasamudram K, Epling WS, ACS Catal. 3 (2013) 871–881. [Google Scholar]
Associated Data
This section collects any data citations, data availability statements, or supplementary materials included in this article.


