

Abstract
Recent high-throughput-sequencing of cancer genomes has identified oncogenic mutations in the B-Raf genetic locus as one of the critical events in melanomagenesis. B-Raf encodes a serine/threonine kinase that regulates the MAPK/ERK kinase (MEK) and extracellular signal-regulated kinase (ERK) protein kinase cascade. In normal cells, the activity of B-Raf is tightly regulated and is required for cell growth and survival. B-Raf gain-of-function mutations in melanoma frequently lead to unrestrained growth, enhanced cell invasion and increased viability of cancer cells. Although it is clear that the invasive phenotypes of B-Raf mutated melanoma cells are stringently dependent on B-Raf-MEK-ERK activation, the downstream effector targets that are required for oncogenic B-Raf-mediated melanomagenesis are not well defined. miRNAs have regulatory functions towards the expression of genes that are important in carcinogenesis. We observed that miR-10b expression correlates with the presence of the oncogenic B-Raf (B-RafV600E) mutation in melanoma cells. While expression of miR-10b enhances anchorage-independent growth of B-Raf wild-type melanoma cells, miR-10b silencing decreases B-RafV600E cancer cell invasion in vitro. Importantly, the expression of miR-10b is required for B-RafV600E-mediated anchorage independent growth and invasion of melanoma cells in vitro. Taken together our results suggest that miR-10b is an important mediator of oncogenic B-RafV600E activity in melanoma.
Introduction
Melanoma is the most aggressive of all the skin cancers. B-Raf is a serine/threonine protein kinase that activates the MEK/ERK-signaling pathway. About 25–70% of malignant melanomas harbor gain-of-function mutations in the oncogene B-Raf [1]. Among several B-Raf gain-of-function mutations, B-RafV600E is the most common mutation and accounts for nearly 80% of them [1]. Not only does B-RafV600E cause a sustained activation of ERK signaling pathway in melanoma, it is also critical for the malignant process and is one of the few identified driver mutations essential for melanoma proliferation and survival. The transformation of melanocytes to melanoma by B-RafV600E requires activation of the MEK-ERK kinases cascade with multiple downstream components [2–4]. The mechanism that integrates the diverse components into a coordinated response to the B-RafV600E mutation remains undefined.
MicroRNAs (miRNAs) are small, non-protein coding RNA molecules and they regulate gene expression through a combination of translational repression and mRNA destabilization [5]. Each miRNA targets ~200 mRNA molecules [6]. Because of their pleiotropic potentials, miRNAs are attractive candidates as master regulators of the B-RafV600E oncogenic transformation program. In this study, we identified for the first time, significant positive correlation between B-RafV600E mutation and microRNA-10b (miR-10b) expression. Furthermore, we show that miR-10b is a novel downstream effector of B-RafV600E and that B-RafV600E plays a causal role in the induction of miR-10b in melanoma cell lines. Our results suggested that B-Raf V600E increased miR-10b expression by increasing the expression levels of helix-loop-helix transcription factor Twist1. We also show that miR-10b induced by B-RafV600E is able to increase invasive capacity and anchorage independent growth of melanoma cells.
Materials and methods
Cell culture
All cell culture media were from HyClone. Fetal bovine serum (FBS) was from Atlanta Biologicals, and newborn calf serum was from Lonza. 10 cm2 and 6 cm2 cell culture plates were from Sarstedt. All the melanoma cell lines were cultured in Dulbecco’s modified Eagle’s medium with 10% FBS and 1% penicillin streptomycin and were grown in a humidified tissue culture incubator at 37°C in 5% CO2. Mel 505 [7], PMWK [8], sk-mel-28 [9], sk-mel-24 [7], VMM39 [7] and MEL 224 [7] cells were kindly provided by Dr. J. Shields (University of North Carolina, Chapel Hill). YUHEF [10] and YUROB [10] cells were a kind gift from Dr. R. Halaban (Yale University, Connecticut). sk-mel-197 [11] cells were received from Memorial Sloan Kettering Cancer Center. M249 [12] cells were a kind gift from Dr. A. Ribas (UCLA).
Chemicals and reagents
PLX4032 (Vemurafenib) and 4-OHT (4-hydroxy tamoxifen) were purchased from Selleck chemicals and Sigma, respectively. ERK (1:1000), phospho ERK (1:1000), B-Raf (1:1000) primary antibodies and horseradish peroxidase secondary antibodies were from Santa Cruz Biotechnology, Twist1 (1:500) antibody was from R&D systems, and tubulin (1:1000) antibody was from Sigma.
Ectopic expression and depletion of miR-10b
Mammalian expression vectors, MDH1-PGK-GFP 2.0-miR-10b and pBABE-puro-miR-10b sponge, were purchased from Addgene (Plasmids were deposited by Weinberg lab) [13]. Melanoma cells were stably transduced with viral particles expressing miR-10b or miR-10 sponge as described previously [14].
In vitro Matrigel invasion assay
The polycarbonate membrane (8μ pore size) of FluoroBlok cell culture inserts (BD Biosciences) was coated with 60 uL of Matrigel (1:26 in serum-free medium) (BD Biosciences) and incubated at 37°C for 2–3 hours. 1x10⁴ of sk-mel-28 or M249 cells were plated on these inserts. 700mL of chemo-attractive medium (Dulbecco’s Modified Eagle’s medium, 1% P/S and 10% FBS) was added to the lower chambers (24-well BD Falcon TC companion plate). After 24 hours of incubation, the insert bottoms were dipped in 1X PBS and stained in Calcein AM reconstituted in DMSO to 1mg/mL- 1ml in 700 ml 1X PBS (BD Biosciences). Digital images were captured on EVOS inverted microscope along with manual cell count and fluorescence reading (485-538nM).
ChIP assay
Chromatin Immunoprecipitations (ChIPs) were performed as described previously [15]. Briefly, cells were crosslinked with 1% formaldehyde for 10 minutes at room temperature. Chromatin was sheared by sonication and immunoprecipitated overnight with control rabbit IgG or an antibody to Twist (Rabbit polyclonal Anti-Twist, Santa Cruz (H-81), sc15393). Following reversal of cross-links, the DNA was purified by proteinase K digestion followed by phenol-chloroform extraction and ethanol precipitation. The purified DNA was subjected to quantitative real-time PCR using SYBR Green Master Mix (Qiagen) with an Applied Biosystems Prism 7500 PCR system and analyzed with the SDS software. Primers for Ebox1 or Ebox2 were described previously [13].
RNA extraction and TaqMan miRNA quantitative real-time PCR assay
RNA extraction was carried out using Qiazol reagent (Qiagen). TaqMan miRNA qRT-PCR was performed according to manufacturer’s instructions (TaqMan). RNU6 or RNU44 were used as the internal control. Briefly, in the reverse transcription (RT) step, cDNA was reverse transcribed from total RNA samples using specific looped miRNA primers from the TaqMan miRNA assays and reagents from the TaqMan. In the PCR step, PCR products were amplified from cDNA samples using the TaqMan miRNA assay together with the TaqMan universal PCR master mix.
Soft agar assay for anchorage independence
1mL layer of 1:1 mixture of 1.2% agar and 2X medium (to give a final 0.6% agar concentration) was evenly spread on 35mm plates. It was allowed to set for 30 minutes at RT. Cells were counted and plated in a mixture of 1.2% agar and 2X medium (1:4) to give a final agar concentration of 0.3%. 3x10³ of sk-mel-28 cells or 1x10⁴ of Mel 505 cells or 1x10⁴ of sk-mel-197 cells were plated. Number of colonies formed were stained with MTT and counted under bright field microscope at 4X objective. Cells were plated in triplicates and four fields were counted per 35 mm plate.
TCGA data analysis
The publicly available TCGA data were directly downloaded from the TCGA Data Portal at https://tcga-data.nci.nih.gov/. TCGA melanoma cases (TCGA-SKCM) annotated for B-Raf WT or V600E mutation were extracted from the GDC portal (https://portal.gdc.cancer.gov). Among those, 407 samples were profiled for both mRNA expression and miRNA expression. Fragments per Kilobase per Million mapped reads (FPKM) from the RNA-sequencing data and reads per million miRNA mapped from the miRNA data were used as normalized read counts. Pearson correlation coefficients and P-values for miR-10b expression with Twist1 and MYC expression were calculated, respectively.
Western blot analysis
Cell extracts were prepared and western blotting was carried out. Briefly, cells were lysed with 20 mM Tris, pH 7.4, 150mM NaCl, 2mM EDTA, and 1% Triton X-100. Samples (10–50 μg protein) were separated by sodium dodecyl sulfate-polyacrylamide electrophoresis and then electrophoretically transferred from the gel to polyvinylidene fluoride membranes (Millipore). All the primary antibodies were diluted in phosphate buffered saline, pH 7.4, 0.2% Tween-20, 5% bovine serum albumin and 0.002% sodium azide. Following three washes, blots were incubated with the appropriate horseradish peroxidase-conjugated secondary antibody for 1 h at room temperature. Proteins were visualized with enhanced chemiluminescence with the BioRad ChemiDoc EQ system.
Statistical analysis
All experiments were performed in triplicates. All the statistical analyses were performed using the two-tailed student’s t-test (GraphPad Prism software).
Results and discussion
We previously reported that the expression of several miRNAs was altered upon introduction of B-RafV600E in primary melanocytes [16]. Among the miRNAs whose expression levels were affected by B-RafV600E, we chose miR-10b for further study because its expression positively correlates with V600E mutation in B-Raf in established melanoma cell lines (Fig 1), clinical melanoma samples (S1 Fig), and because it is involved in several other malignancies [17].
Fig 1. miR-10b expression positively correlates with B-RafV600E mutation status in multiple cell lines.
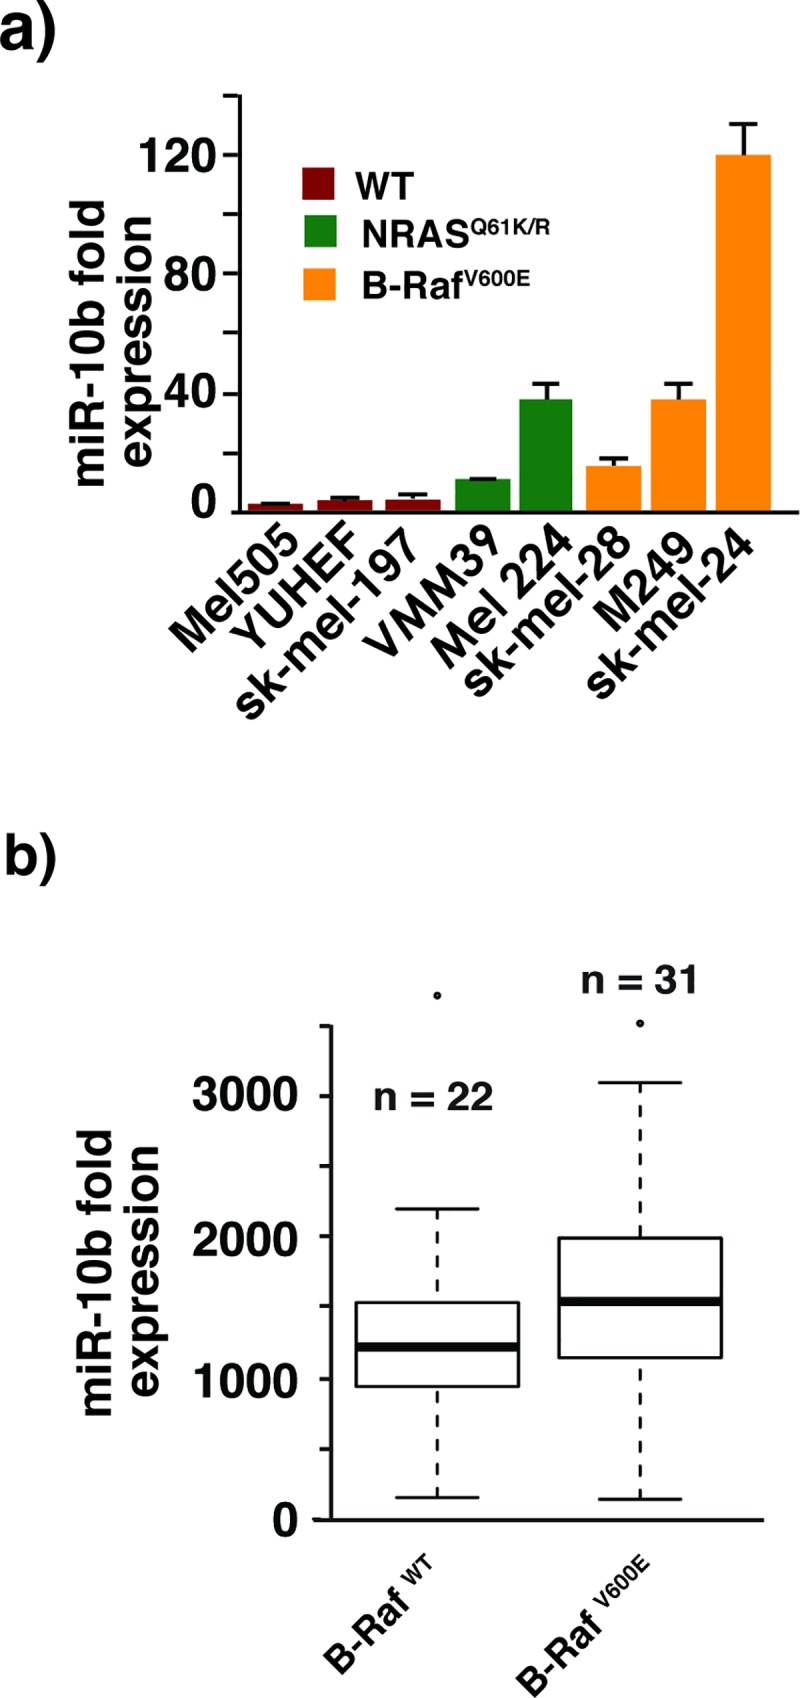
(a) TaqMan reverse transcriptase PCR shows a strong positive correlation of miR-10b expression with B-RafV600E or N-Ras activating mutations in a panel of melanoma cell lines. The experiment was repeated 3X with similar results. (b) A boxplot graph compares miR-10b expression levels in 22 wild-type and 31 B-Raf V600E mutant melanoma cell lines. The mean value for the wild-type cells was 1254.7, and for the mutant cells 1627.4. The p-value for a one-tailed t-test was 0.0422. The data are from GSE89438 [18]. The expression values for miR-10b were downloaded as part of the GSE89438_series_matrix file from NCBI GEO. The miR-10b values were imported into the R programming environment, and the boxplot function was applied to the values for wild-type and B-RafV600E mutant samples.
To investigate if B-RafV600E plays a causal role in regulating miR-10b expression in melanoma cell lines we undertook a loss-of-function approach. We stably knocked down B-RafV600E expression by siRNA in two different B-RafV600E melanoma cell lines. As expected, B-Raf protein expression significantly decreased in B-RafV600E knockdown cells with a concomitant decrease in phosphorylation of ERK1/2. In both studied cell lines, we found that miR-10b expression was significantly down-regulated upon B-RafV600E knock down (Fig 2A). A decrease in miR-10b expression was also observed in M249, which are B-RafV600E positive melanoma cells when B-RafV600E activity was down-regulated by vemurafenib (PLX4032), a pharmacological inhibitor of B-RafV600E (Fig 2B).
Fig 2. B-RafV600E plays a causal role in the induction of miR-10b.

(a) Lower panel shows downregulation of miR-10b expression upon stable knock-down of B-RafV600E in melanoma cell lines sk-mel-24 and sk-mel-28 with B-RafV600E-specific siRNA as determined by TaqMan qRT-PCR. Upper panel: Western blots of lysates from cells expressing siB-RafV600E or siGFP siRNA. (b) TaqMan qRT-PCR shows downregulation of miR-10b upon inhibition of the B-RafV600E in melanoma cell line M249 by PLX4032. Cells were treated at 1μM concentration of PLX4032 (Vemurafenib) or DMSO for a period of 12 hours. (c) Increase in the expression of miR-10b upon ectopic expression of B-RafV600E. Cells were stably transduced with B-RafV600E - or empty vector control (EVC)-expressing retroviruses. Relative levels of B-Raf and tubulin are indicated. (d) Potent induction of miR-10b in B-Raf wild type Mel 505 cell line upon activation of the transduced B-RafV600E-ERT2 following 24 hours 4HT (4-hydroxy tamoxifen) treatment at 1μM concentration as determined by TaqMan qRT-PCR (left panel). Cells were stably transduced with B-RafV600E-ERT2-expressing retrovirus. The expression levels of B-RafV600E-ERT2 in transduced cells were measured with Western blotting with specific B-Raf antibodies (Upper right panel). The effects of 4HT activated B-RafV600E-ERT2 in transduced Mel505 cells on ERK phosphorylation were monitored with Western blotting with indicated specific antibodies (Lower right panel).
We reasoned that if the effect of knocking down of B-RafV600E expression on miR-10b is physiological we should observe an opposite effect with over-expression of the oncogenic B-RafV600E in melanoma cell lines carrying wild-type B-Raf. Indeed, we found that the expression of miR-10b was significantly upregulated in cells ectopically expressing B-RafV600E as compared to empty vector control (Fig 2C). The drawback of over-expression of an oncogene is that the cells might get adapted to its sustained expression and this can lead to non-specific effects that may not be attributable to the expression of the oncogene alone. As a complementary approach, we used an estrogen receptor fusion system where B-RafV600E was rendered functionally hormone-dependent by fusion with synthetic steroid 4-hydroxytamoxifen (4-OHT)-binding domain of mutated estrogen receptor (ERT2) [19]. As expected, upon treating the cells with 4-OHT for 24 hours, we observed potent induction of ERK dual phosphorylation at Thr202 and Tyr204 indicating that the kinase activity of B-RafV600E was temporally turned on by 4-OHT treatment (Fig 2D, lower right panel). Interestingly, transient activation of B-RafV600E is better at activating miR-10b expression than sustained expression of the constitutively active kinase (Compare Fig 2C and 2D). Taken together, our results suggest that the expression of miR-10b in melanoma is B-RafV600E dependent.
In humans, the miR-10b gene resides upstream from the developmental gene Hoxd4. It has been shown that the basic helix-loop-helix transcription factor Twist positively regulates miR-10b expression in breast cancer cells by directly binding to the proximal E-box present in the miR-10b gene promoter. The expression levels of Twist are often deregulated in a vast majority of melanoma tumors and cell lines [20, 21]. Furthermore, the expression of Twist was shown to be regulated at the transcription level by B-RafV600E mutation in human melanoma cells [22], raising the possibility that B-RafV600E may increase miR-10b expression by activating Twist. Indeed, hyper activation of B-Raf signaling pathway increases Twist1 transcript in established melanoma cell lines (Fig 3A). In addition, we also observed significant correlation of miR-10b and Twist1 expression in B-RafV600E mutated but not B-Raf wild-type melanoma clinical samples (Fig 3B and Table 1). The observed correlation is specific as no significant correlation was observed between another E-box transcription factor c-myc and miR-10b (Fig 3C and Table 2). Importantly, knocking down of B-RafV600E diminished Twist1 expression while the expression of Twist was important for miR-10b synthesis (Fig 3D–3F, S2 Fig). It is of interest to note that knocking down of wild type B-Raf in Mel505 cells had no noticeable effect on the expression levels of Twist1 (Fig 3E, right panel). Finally, Twist1 may have a direct effect on miR-10b expression as the promoter occupancy of miR-10b by Twist1 was elevated upon exogenous expression of B-RafV600E in B-Raf wild-type Mel505 melanoma cell line (Fig 3G). Our results therefore suggested that the activation miR-10b expression by B-RafV600E required the presence of Twist1 in melanoma. It is possible that B-Raf gain-of-function mutation is necessary but not sufficient for miR-10b expression in melanoma. Indeed, we did not observe significant correlation of B-Raf mutation status and miR-10b expression level in melanoma TCGA datasets before the clinical samples were stratified into Twist1 positive and negative groups (Fig 3D).
Fig 3. The B-RafV600E-Twist axis regulates miR-10b expression in melanoma.

(a) Twist1 expression positively correlates with B-RafV600E mutation status in multiple cell lines. qRT- PCR shows a strong positive correlation of Twist1 expression with B-RafV600E or N-Ras activating mutations in a panel of melanoma cell lines. (b-c) miR-10b displays significant correlation with Twist1 mRNA expression in B-RafV600E mutant melanoma. Scatter plots showing correlation of miR-10b expression with (b) Twist1 mRNA expression and (c) Myc mRNA expression in B-RafWT and B-RafV600E samples from 407 TCGA-SKCM samples. r denotes Pearson correlation coefficient. p refers to a Pearson correlation P-value. (d) Upper panel: Box plots display miR-10b expression distribution in B-RafWT and B-RafV600E from 201 TCGA-SKCM samples where Twist1 mRNA expression was high. The median expression value for the wild-type samples was 50,343, and for the mutant was 66,002. The p-value for a Mann-Whitney test was 0.0149. Lower panel: Box plots display miR-10b expression distribution in BRafWT and BRafV600E from 206 TCGA-SKCM samples where Twist1 mRNA expression was low. The median expression value for the wild-type samples was 69,160, and for the mutant was 54,373. The p-value for a Mann-Whitney test was 0.02. (e) Protein expression of B-Raf and Twist1 in sk-mel-28 or Mel505 cell lines expressing siRNAs against B-Raf or control siRNAs (siGFP or siCON). Relative levels of B-Raf or Twist1 are indicated. (f) Upper panel, relative Twist1 mRNA expression in sk-mel-24 cells expressing three different Twist1 specific siRNAs or siGFP control as assessed by qRT-PCR. Lower panel, relative mR-10b expression in the indicated siRNA expressing sk-mel-24 cells as assessed by TaqMan qRT-PCR. (g) ChIP analysis on M505 cells with or without the ectopic expression of B-RafV600E. The putative E-boxes in miR-10b promoter are shown as red boxes. The locations of primers used for ChIP assays are marked by black arrows (amplicons). ChIP analysis was conducted using specific antibodies that recognize human Twist1, as well as control IgG.
Table 1. Pearson correlation statistics between Twist1 and miR-10b expression in B-RafWT and B-RafV600E.
| Twist1 vs miR-10b (B-RafWT) | Twist1 vs miR-10b (B-RafV600E) | ||
|---|---|---|---|
| Pearson r | Pearson r | ||
| r | -0.08439 | r | 0.1501 |
| 95% confidence interval | -0.2131 to 0.04721 | 95% confidence interval | 0.005107 to 0.2888 |
| R squared | 0.007122 | R squared | 0.02252 |
| P value | P value | ||
| P (two-tailed) | 0.2083 | P (two-tailed) | 0.0426 |
| P value summary | ns | P value summary | * |
| Significant? (α = 0.05) | no | Significant? (α = 0.05) | yes |
| Number of XY Pair | 224 | Number of XY Pair | 183 |
r denotes parametric Pearson correlation coefficient and r2 (R squared) indicates the coefficient of determination.
* indicates the significance of the P value. Two-tailed P values were calculated for Pearson correlation coefficients.
Table 2. Pearson correlation statistics between Myc and miR-10b expression in B-RafWT and B-RafV600E.
| c-Myc vs miR-10b (B-RafWT) | c-Myc vs miR-10b (B-RafV600E) | ||
|---|---|---|---|
| Pearson r | Pearson r | ||
| r | 0.08854 | r | -0.03904 |
| 95% confidence interval | -0.04304 to 0.2171 | 95% confidence interval | -0.1831 to 0.1066 |
| R squared | 0.007839 | R squared | 0.001524 |
| P value | P value | ||
| P (two-tailed) | 0.1867 | P (two-tailed) | 0.5998 |
| P value summary | ns | P value summary | ns |
| Significant? (α = 0.05) | no | Significant? (α = 0.05) | no |
| Number of XY Pair | 224 | Number of XY Pair | 183 |
r denotes parametric Pearson correlation coefficient and r2 (R squared) indicates the coefficient of determination. Two-tailed P values were calculated for Pearson correlation coefficients.
Studies with cancer cell transplantation and autochthonous cancer mouse models have demonstrated the causal role of miR-10b in breast cancer initiation, growth, progression and metastasis [23–25]. However, the causality of loss- or gain-of-function of miR-10b in other cancers including melanoma is not known. Anchorage-independent growth and increased invasive capacity are two well-characterized hallmarks of cancer. Since Twist-miR-10b axis has a demonstrated role in anchorage-independent growth [26], miR-10b may confer these important cancerous phenotypes on melanoma cells. Indeed, in low-miR-10b-expressing wild-type B-Raf melanoma cells Mel505, ectopic expression of miR-10b was sufficient to increase anchorage-independent growth as measured in soft agar (Fig 4A). This effect was not cell type specific as a similar effect was observed with other wild-type B-Raf melanoma cells sk-mel-197. Similarly, depletion of miR-10b in high-miR-10b-expressing B-RafV600E melanoma cells sk-mel-28 and M249 decreased their invasiveness (Fig 4B). B-RafV600E is an oncoprotein and its presence is essential for anchorage-independent growth and invasive capacity of B-RafV600E melanoma cells. B-RafV600E induces miR-10b expression in melanoma cell lines. Therefore, B-RafV600E melanoma cells may acquire cancer phenotypes partly by increasing the expression levels of miR-10b through increasing the expression of the transcription factor Twist1. Consistent with this line of thinking, as shown in Fig 5A and 5B, ectopic miR-10b expression significantly rescued the decrease in anchorage independent growth and invasiveness due to the loss of B-RafV600E in sk-mel-28 cells.
Fig 4. miR-10b confers anchorage-independence and increases invasive capacity of melanoma cell lines.

(a) Middle two panels show increase in the number of colonies formed in soft-agar upon ectopic expression of miR-10b in Mel 505 and sk-mel-197 melanoma cell lines expressing WT B-Raf. Lower panels are pictures of cells shown in the middle panel photographed at X40 after staining with MTT. Upper panel shows miR-10b fold expression upon ectopic expression of miR-10b. Student’s t-test was performed for statistical analysis, which shows a significant value of 0.002 for Mel 505 and 0.005 for sk-mel-197 cell lines. (b) Middle panels show decrease in number of invading cells upon miR-10b depletion by specific miR-10b sponge in sk-mel-28 and M249 cells. Lower panels show representative fields of Matrigel membranes with invaded cells stained fluorescent green with Calcein AM. Student’s t-test was performed and a significant difference was found with a p-value of 0.0001. Upper panel shows expression levels of miR-10b in miR-10b sponge expressed sk-mel-28 and M249 cells as determined by TaqMan qRT-PCR.
Fig 5. B-RafV600E melanoma cells acquire cancer phenotypes partly by increasing the expression levels of miR-10b.
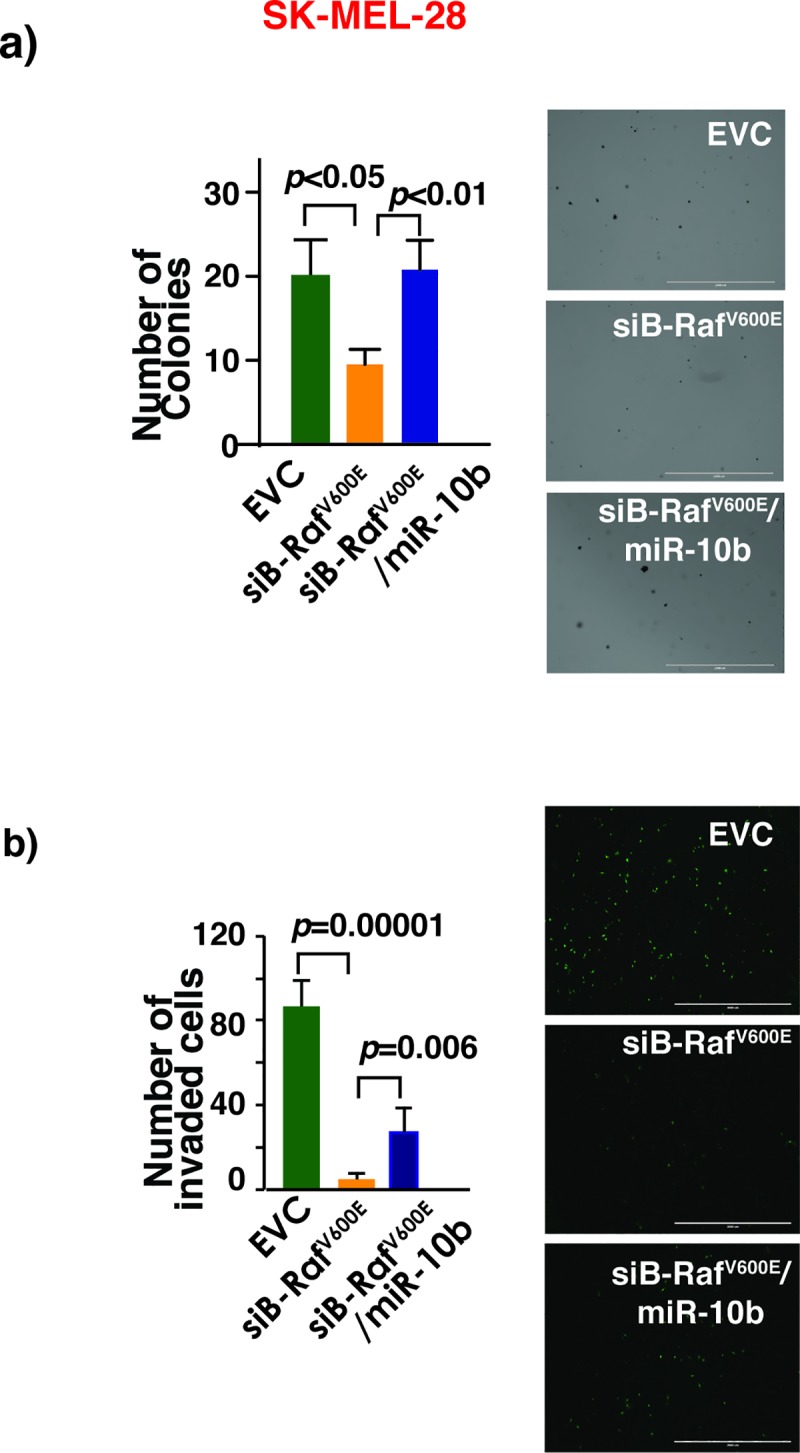
(a) Upper panel: B-RafV600E knockdown decreases number of colonies in soft agar in sk-mel-28 cell line. Restoration of miR-10b expression reversed this effect. This experiment was performed at least twice with triplicates each time. ANOVA was performed followed by Bonferroni’s multiple comparison test where EVC vs siB-RafV600E and B-RafV600E vs B-RafV600E /miR-10b were found to be significant with a p-value <0.05. EVC-empty vector control. (b) Knockdown of B-RafV600E decreases melanoma cell invasion while restoration of miR-10b reverses this effect. Right panel shows a representative field of Matrigel membrane with invading cells staining fluorescent green with Calcein AM. One-way ANOVA was performed with p-value<0.05.
The mechanisms of how augmented miR-10b expression in B-RafV600E melanoma cells enhances their anchorage independent growth and invasiveness is currently not known. miRNAs function mainly by silencing expression of target genes by binding to specific sites of the targeted gene mRNAs. Studies of genetic deletion of miR-10b in MMTV-PyMT mice identified Tbx5, Pten, and HoxD10 as key miR-10b targets [27]. While Tbx5 and Pten are well-characterized tumor suppressor genes, HoxD10 is a proven metastasis suppressor gene. To grow continuously after being detached from extracellular matrix, cancer cells develop resistance to a specific form of caspase-mediated cell death known as anoikis by upregulating the survival pathways. PI3K pathway is a major survival pathway cancer cells employ to overcome anoikis to achieve anchorage-independent growth [28]. Of the three target genes of miR-10b, Pten has been shown to play a pivotal role in dampening the PI3K pathway. It is therefore possible that miR10b enhances anchorage independent growth in melanoma by decreasing the expression of Pten. Both Tbx2 and HoxD10 are transcription factors that can potentially regulate a multitude of genes. It has been shown that HoxD10 represses the expression of metastasis gene RhoC in breast cancer cells and that miR-10b increases cancer cells invasion by repressing the repressor of RhoC expression. RhoC is a well-studied metastasis gene in melanoma and it is possible that B-RafV600E utilizes the same miR-10b-HoxD10-RhoC axis to drive cancer cells invasion. Likewise, Tbx2 can also play an equally important role in mediating the different effects on melanomagenesis resulting from B-Raf mutation.
In 2010, an orally available inhibitor of B-RafV600E increased the median progression-free survival of patients with malignant melanoma harboring this mutation, to more than 7 months [29]. However, patients develop resistance to this drug due to several mechanisms including receptor tyrosine kinase (RTK) or N-Ras upregulation among many others [30]. Recently, combinatorial therapy utilizing B-Raf and MEK inhibition delayed the emergence of resistance while progression-free survival remained more or less similar to B-Raf inhibition alone [31]. However, relapse due to drug-resistance is commonplace and warrants a treatment strategy based on new downstream molecular targets of the mutant B-Raf protein. The expression of miR-10b is often deregulated in cancers including melanoma and its expression was positively associated with worse patient survival [24]. Here we identify miR-10b as a novel molecular target downstream of mutant B-Raf protein raising the possibility that targeting miR-10b and/or its effectors may represent a rational alternative treatment for relapsed patient with B-RafV600E melanoma.
Supporting information
(DOCX)
(n = 4). The B-RafV600E mutation was determined by IHC staining with B-RafV600E specific Ab. Lesions were demarcated from normal tissues with white dotted line.
(TIF)
Upper panel shows the relative Twist1 mRNA expression in sk-mel-24 cells expressing two different Twist1 specific siRNAs or siGFP control as assessed by qRT-PCR. Lower panel shows the relative mR-10b expression in the indicated siRNA expressing sk-mel-24 cells as assessed by TaqMan qRT-PCR.
(TIF)
Acknowledgments
The retroviral expression vector for B-RafV600E-ERT2 is a generous gift of Dr. Martin McMahon of Huntsman Cancer Institute. UT Foundation, a gift from Clement Lam to KCY, and a Translation Research Stimulation Award (TRSA) from UT college of Medicine supported this work.
Data Availability
All relevant data are within the manuscript and its Supporting Information files.
Funding Statement
UT Foundation, a gift from Clement Lam to KCY, and a Translation Research Stimulation Award (TRSA) from University of Toledo, college of Medicine and Life Sciences supported this work.
References
- 1.Garnett MJ, Marais R. Guilty as charged: B-RAF is a human oncogene. Cancer Cell. 2004;6(4):313–9. 10.1016/j.ccr.2004.09.022 [DOI] [PubMed] [Google Scholar]
- 2.Acosta JC, O'Loghlen A, Banito A, Guijarro MV, Augert A, Raguz S, et al. Chemokine signaling via the CXCR2 receptor reinforces senescence. Cell. 2008;133(6):1006–18. 10.1016/j.cell.2008.03.038 [DOI] [PubMed] [Google Scholar]
- 3.Kuilman T, Michaloglou C, Vredeveld LC, Douma S, van Doorn R, Desmet CJ, et al. Oncogene-induced senescence relayed by an interleukin-dependent inflammatory network. Cell. 2008;133(6):1019–31. 10.1016/j.cell.2008.03.039 [DOI] [PubMed] [Google Scholar]
- 4.Wajapeyee N, Serra RW, Zhu X, Mahalingam M, Green MR. Oncogenic BRAF induces senescence and apoptosis through pathways mediated by the secreted protein IGFBP7. Cell. 2008;132(3):363–74. 10.1016/j.cell.2007.12.032 [DOI] [PMC free article] [PubMed] [Google Scholar]
- 5.Eichhorn SW, Guo H, McGeary SE, Rodriguez-Mias RA, Shin C, Baek D, et al. mRNA destabilization is the dominant effect of mammalian microRNAs by the time substantial repression ensues. Mol Cell. 2014;56(1):104–15. 10.1016/j.molcel.2014.08.028 [DOI] [PMC free article] [PubMed] [Google Scholar]
- 6.He L, Hannon GJ. MicroRNAs: small RNAs with a big role in gene regulation. Nat Rev Genet. 2004;5(7):522–31. 10.1038/nrg1379 [DOI] [PubMed] [Google Scholar]
- 7.Park S, Yeung ML, Beach S, Shields JM, Yeung KC. RKIP downregulates B-Raf kinase activity in melanoma cancer cells. Oncogene. 2005;24:3535 10.1038/sj.onc.1208435 [DOI] [PubMed] [Google Scholar]
- 8.Vink J, Thomas L, Etoh T, Bruijn JA, Mihm MC Jr., Gattoni-Celli S, et al. Role of beta-1 integrins in organ specific adhesion of melanoma cells in vitro. Lab Invest. 1993;68(2):192–203. [PubMed] [Google Scholar]
- 9.Zhang XD, Franco A, Myers K, Gray C, Nguyen T, Hersey P. Relation of TNF-related apoptosis-inducing ligand (TRAIL) receptor and FLICE-inhibitory protein expression to TRAIL-induced apoptosis of melanoma. Cancer Res. 1999;59(11):2747–53. [PubMed] [Google Scholar]
- 10.Halaban R, Zhang W, Bacchiocchi A, Cheng E, Parisi F, Ariyan S, et al. PLX4032, a selective BRAF(V600E) kinase inhibitor, activates the ERK pathway and enhances cell migration and proliferation of BRAF melanoma cells. Pigment cell & melanoma research. 2010;23(2):190–200. [DOI] [PMC free article] [PubMed] [Google Scholar]
- 11.Kelly KJ, Brader P, Woo Y, Li S, Chen N, Yu YA, et al. Real-time intraoperative detection of melanoma lymph node metastases using recombinant vaccinia virus GLV-1h68 in an immunocompetent animal model. International journal of cancer. 2009;124(4):911–8. 10.1002/ijc.24037 [DOI] [PMC free article] [PubMed] [Google Scholar]
- 12.Søndergaard JN, Nazarian R, Wang Q, Guo D, Hsueh T, Mok S, et al. Differential sensitivity of melanoma cell lines with BRAF V600E mutation to the specific Raf inhibitor PLX4032. Journal of Translational Medicine. 2010;8(1):39. [DOI] [PMC free article] [PubMed] [Google Scholar]
- 13.Ma L, Teruya-Feldstein J, Weinberg RA. Tumour invasion and metastasis initiated by microRNA-10b in breast cancer. Nature. 2007;449(7163):682–8. 10.1038/nature06174 [DOI] [PubMed] [Google Scholar]
- 14.Ma J, Shi J, Zhao D, Cheng L, Wang W, Li F, et al. Raf kinase inhibitor protein inhibits cholangiocarcinoma cell metastasis by downregulating matrix metalloproteinase 9 and upregulating tissue inhibitor of metalloproteinase 4 expression. Oncology letters. 2015;9(1):15–24. 10.3892/ol.2014.2637 [DOI] [PMC free article] [PubMed] [Google Scholar]
- 15.Keenen B, Qi H, Saladi SV, Yeung M, de la Serna IL. Heterogeneous SWI/SNF chromatin remodeling complexes promote expression of microphthalmia-associated transcription factor target genes in melanoma. Oncogene. 2009;29:81 10.1038/onc.2009.304 [DOI] [PMC free article] [PubMed] [Google Scholar]
- 16.Ren G, Feng J, Datar I, Yeung AH, Saladi SV, Feng Y, et al. A Micro-RNA Connection in BRaf(V600E)-Mediated Premature Senescence of Human Melanocytes. Int J Cell Biol. 2012;2012:913242 10.1155/2012/913242 [DOI] [PMC free article] [PubMed] [Google Scholar]
- 17.Lund AH. miR-10 in development and cancer. Cell Death Differ. 2010;17(2):209–14. 10.1038/cdd.2009.58 [DOI] [PubMed] [Google Scholar]
- 18.Andrews MC, Cursons J, Hurley DG, Anaka M, Cebon JS, Behren A, et al. Systems analysis identifies miR-29b regulation of invasiveness in melanoma. Molecular cancer. 2016;15(1):72–. 10.1186/s12943-016-0554-y [DOI] [PMC free article] [PubMed] [Google Scholar]
- 19.Littlewood TD, Hancock DC, Danielian PS, Parker MG, Evan GI. A modified oestrogen receptor ligand-binding domain as an improved switch for the regulation of heterologous proteins. Nucleic Acids Res. 1995;23:1686–90. [DOI] [PMC free article] [PubMed] [Google Scholar]
- 20.Ansieau S, Bastid J, Doreau A, Morel AP, Bouchet BP, Thomas C, et al. Induction of EMT by twist proteins as a collateral effect of tumor-promoting inactivation of premature senescence. Cancer Cell. 2008;14(1):79–89. 10.1016/j.ccr.2008.06.005 [DOI] [PubMed] [Google Scholar]
- 21.Hoek K, Rimm DL, Williams KR, Zhao H, Ariyan S, Lin A, et al. Expression profiling reveals novel pathways in the transformation of melanocytes to melanomas. Cancer Res. 2004;64(15):5270–82. 10.1158/0008-5472.CAN-04-0731 [DOI] [PubMed] [Google Scholar]
- 22.Weiss MB, Abel EV, Mayberry MM, Basile KJ, Berger AC, Aplin AE. TWIST1 is an ERK1/2 effector that promotes invasion and regulates MMP-1 expression in human melanoma cells. Cancer Res. 2012;72(24):6382–92. 10.1158/0008-5472.CAN-12-1033 [DOI] [PMC free article] [PubMed] [Google Scholar]
- 23.Lu Y, Yao J, Yu J, Wei Q, Cao X. The association between abnormal microRNA-10b expression and cancer risk: a meta-analysis. Scientific Reports. 2014;4:7498 10.1038/srep07498 [DOI] [PMC free article] [PubMed] [Google Scholar]
- 24.Saldanha G, Elshaw S, Sachs P, Alharbi H, Shah P, Jothi A, et al. microRNA-10b is a prognostic biomarker for melanoma. Mod Pathol. 2016;29(2):112–21. 10.1038/modpathol.2015.149 [DOI] [PubMed] [Google Scholar]
- 25.Bai M, Zhang H, Si L, Yu N, Zeng A, Zhao R. Upregulation of Serum miR-10b Is Associated with Poor Prognosis in Patients with Melanoma. Journal of Cancer. 2017;8(13):2487–91. 10.7150/jca.18824 [DOI] [PMC free article] [PubMed] [Google Scholar]
- 26.Högnäs G, Hämälistö S, Rilla K, Laine JO, Vilkki V, Murumägi A, et al. Aneuploidy facilitates oncogenic transformation via specific genetic alterations, including Twist2 upregulation. Carcinogenesis. 2013;34(9):2000–9. 10.1093/carcin/bgt171 [DOI] [PubMed] [Google Scholar]
- 27.Kim J, Siverly AN, Chen D, Wang M, Yuan Y, Wang Y, et al. Ablation of miR-10b Suppresses Oncogene-Induced Mammary Tumorigenesis and Metastasis and Reactivates Tumor-Suppressive Pathways. Cancer Res. 2016;76(21):6424–35. 10.1158/0008-5472.CAN-16-1571 [DOI] [PMC free article] [PubMed] [Google Scholar]
- 28.Paoli P, Giannoni E, Chiarugi P. Anoikis molecular pathways and its role in cancer progression. Biochim Biophys Acta. 2013;1833(12):3481–98. 10.1016/j.bbamcr.2013.06.026 [DOI] [PubMed] [Google Scholar]
- 29.Flaherty KT, Puzanov I, Kim KB, Ribas A, McArthur GA, Sosman JA, et al. Inhibition of mutated, activated BRAF in metastatic melanoma. N Engl J Med. 2010;363(9):809–19. 10.1056/NEJMoa1002011 [DOI] [PMC free article] [PubMed] [Google Scholar]
- 30.Nazarian R, Shi H, Wang Q, Kong X, Koya RC, Lee H, et al. Melanomas acquire resistance to B-RAF(V600E) inhibition by RTK or N-RAS upregulation. Nature. 2010;468(7326):973–7. 10.1038/nature09626 [DOI] [PMC free article] [PubMed] [Google Scholar]
- 31.Long GV, Stroyakovskiy D, Gogas H, Levchenko E, de Braud F, Larkin J, et al. Combined BRAF and MEK inhibition versus BRAF inhibition alone in melanoma. N Engl J Med. 2014;371(20):1877–88. 10.1056/NEJMoa1406037 [DOI] [PubMed] [Google Scholar]
Associated Data
This section collects any data citations, data availability statements, or supplementary materials included in this article.
Supplementary Materials
(DOCX)
(n = 4). The B-RafV600E mutation was determined by IHC staining with B-RafV600E specific Ab. Lesions were demarcated from normal tissues with white dotted line.
(TIF)
Upper panel shows the relative Twist1 mRNA expression in sk-mel-24 cells expressing two different Twist1 specific siRNAs or siGFP control as assessed by qRT-PCR. Lower panel shows the relative mR-10b expression in the indicated siRNA expressing sk-mel-24 cells as assessed by TaqMan qRT-PCR.
(TIF)
Data Availability Statement
All relevant data are within the manuscript and its Supporting Information files.