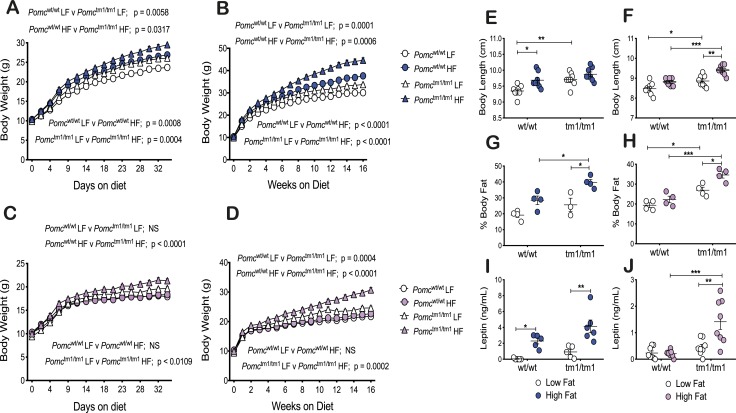
Figure 1.
An HF diet exacerbates male and female Pomctm1/tm1 mouse increased growth and obesity whereas Pomcwt/wt mice exhibit sexually dimorphic HF diet–induced growth and obesity. (A and B) Male body weight. (C and D) Female body weight. (A and C) Body weights were assessed every 3 d for the first 35 d of an LF or HF diet from weaning. Data are shown as mean ± SEM (n = 12). Significant differences for body weights were determined using a two-way repeated measures ANOVA. F statistics and Sidak post hoc analysis data are shown in an online repository (32) and Table 2. (B and D) Body weights were assessed weekly during 16 wk of an LF or HF diet from weaning. Data are shown as mean ± SEM (n = 12). Significant differences for body weights were determined using a two-way repeated measures ANOVA. F statistics and Sidak post hoc analysis data are shown in an online repository (32) and Table 2. (E, G, and I) Male phenotype. (F, H, and J) Female phenotype. (E and F) Body length was measured at 21 to 23 wk for mice fed an LF or HF diet from weaning. Data are shown as mean ± SEM (n = 7 to 8). Significant differences were determined using a two-way ANOVA and Tukey post hoc test. *P < 0.05; **P < 0.01; ***P < 0.001. (G and H) Percentage body fat was calculated from six MRI Dixon images per mouse. Data are shown as mean ± SEM (n = 3 to 4). Representative images are shown in an online repository (32). Significant differences were determined using a two-way ANOVA and Tukey post hoc test. *P < 0.05; ***P < 0.001. (I and J) Fasting plasma leptin measured using a Milliplex MAP kit assay at 21 to 23 wk for mice fed an LF or HF diet from weaning. Data are shown as mean ± SEM (n = 5 to 8). Significant differences were determined using a two-way ANOVA and Tukey post hoc test. *P < 0.05; **P < 0.01; ***P < 0.001.

