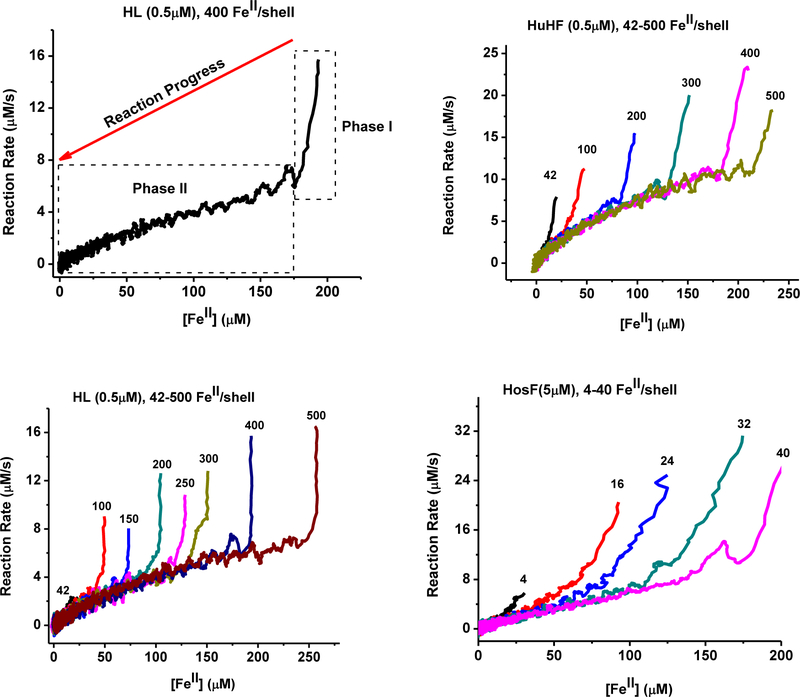
Figure 2.
Plots of the reaction rates vs. the concentration of remaining Fe(II) cations in solution. Top left: typical plot for HL ferritin with 400 FeII/shell; Top right and Bottom: overlay of several reaction rate plots at different ratios of FeII/shell for HuHF, Hl, and HosF, as indicated next to each curve. The experimental conditions are those of Figure 1.

