Abstract
Genetically-Encoded Voltage Indicators (GEVIs) are capable of converting changes in membrane potential into an optical signal. Here, we focus on recent insights into the mechanism of ArcLight-type probes and the consequences of utilizing a pH-dependent Fluorescent Protein (FP). A negative charge on the exterior of the β-can of the FP combined with a pH-sensitive FP enables voltage-dependent conformational changes to affect the fluorescence of the probe. This hypothesis implies that interaction/dimerization of the FP creates a microenvironment for the probe that is altered via conformational changes. This mechanism explains why a pH sensitive FP with a negative charge on the outside of the β-can is needed, but also suggests that pH could affect the optical signal as well. To better understand the effects of pH on the voltage-dependent signal of ArcLight, the intracellular pH (pHi) was tested at pH 6.8, 7.2, or 7.8. The resting fluorescence of ArcLight gets brighter as the pHi increases, yet only pH 7.8 significantly affected the ΔF/F. ArcLight could also simultaneously report voltage and pH changes during the acidification of a neuron firing multiple action potentials revealing different buffering capacities of the soma versus the processes of the cell.
Introduction
Genetically-Encoded Voltage Indicators (GEVIs) convert changes in membrane potential into an optical signal enabling the detection of neuronal activity simultaneously from different regions of a cell or a circuit depending on the optics in use. There are two distinct families of GEVIs currently available (reviewed in Lin & Schnitzer, 2016; Nakajima, Jung, Yoon, & Baker, 2016; Sepehri Rad et al., 2017; St-Pierre, Chavarha, & Lin, 2015; D. Storace et al., 2015; D. Storace et al., 2016; Yang & St-Pierre, 2016). One family of GEVIs utilizes bacterial rhodopsin to sense changes in membrane potential. The other family of GEVIs uses homologs of the voltage-sensing domain (VSD) from the voltage-sensing phosphatase (VSP)(Murata, Iwasaki, Sasaki, Inaba, & Okamura, 2005) fused to a fluorescent protein (FP).
While GEVIs continue to improve, both families of voltage probes exhibit strengths and weaknesses that should be considered when imaging neuronal activity. Unlike calcium, voltage exhibits a multistate dynamic in excitable cells ranging from slight hyperpolarizations during neuronal inhibition to sub-threshold excitatory synaptic depolarizations and ultimately action potentials. Each neuronal state exhibits specific voltage ranges and temporal components. For instance, subthreshold synaptic activity would be well served by a GEVI that gives a large ΔF since the depolarization of the plasma membrane is relatively small. Resolving spike timing of action potentials would require a fast optical response.
The rhodopsin family of GEVIs exhibit fast kinetics. Since the voltage-sensing domain is also the fluorescent output of the protein, these probes are extremely fast but suffer from poor quantum yields. Fusing a bright fluorescent protein (FP) to the rhodopsin domain overcomes the quantum yield problem resulting in a probe capable of resolving action potentials in vivo(Gong et al., 2015; Lou et al., 2016; Piatkevich et al., 2018). However, some rhodopsin-based probes also exhibit a light-induced current(Gong et al., 2015; Gong, Wagner, Zhong Li, & Schnitzer, 2014; Inagaki et al., 2017; Kralj, Douglass, Hochbaum, Maclaurin, & Cohen, 2012; Piatkevich et al., 2018; Zou et al., 2014).
GEVIs that utilize a VSD are not as fast as the rhodopsin-based probes but can give larger changes in fluorescence. The FP of these constructs resides outside the voltage field of the plasma membrane resulting in slightly slower probes. The VSD consists of four transmembrane segments designated S1-S4 (figure 1). The S4 α-helix contains multiple positively charged amino acids that cause a conformational change when the plasma membrane potential is altered. These VSDs traffick well to the plasma membrane of mammalian cells enabling optical recordings from neurons(Baker et al., 2007; Dimitrov et al., 2007). The VSD-based GEVIs have also been used for in vivo recordings(Borden et al., 2017; D. A. Storace, Braubach, Jin, Cohen, & Sung, 2015; D. A. Storace & Cohen, 2017; Yang et al., 2016).
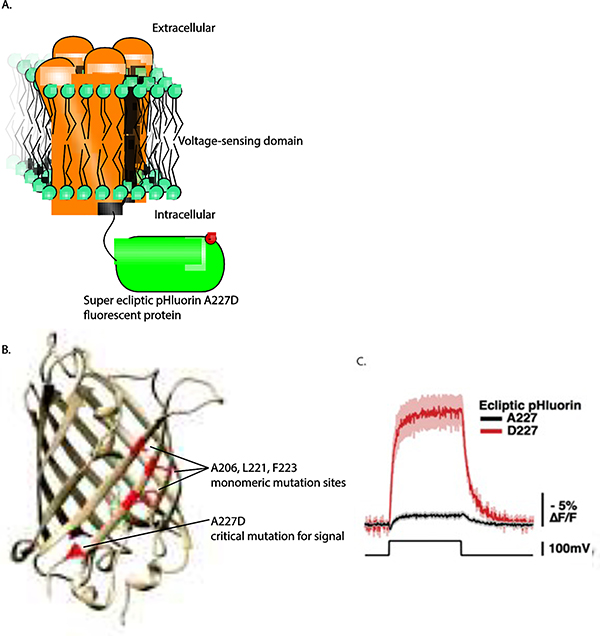
Figure 1. A random mutation on the outside of super ecliptic pHluorin improved the voltagedependent optical signal of the GEVI, ArcLight.
A. Schematic of ArcLight. The voltage-sensing domain resides in the plasma membrane while the fluorescent protein domain is in the cytoplasm. B. The position of A227 in the beta-barrel of the fluorescent protein. C. The A227D mutant gives a large voltage-dependent, optical signal (used with permission (Jin et al., 2012).
There are three different configurations for fusing FPs to the VSD. One involves a Forster Resonance Energy Transfer (FRET) pair where the donor and acceptor can flank the VSD(Akemann et al., 2012; Sung et al., 2015) or reside at the carboxy-terminus as a tandem repeat(Baker et al., 2012; Dimitrov et al., 2007). Voltage-induced conformational changes in the VSD result in a change in the distance and/or alters the orientation between the two FPs resulting in an optical signal. A second configuration involves the use of a circularly-permuted fluorescent protein (cpFP) inserted between the S3 and S4 transmembrane segments(St-Pierre et al., 2014; Yang et al., 2016). The position of the cpFP between α-helixes seems to be important. Probes fusing a cpFP at the carboxy-terminus give smaller signals probably because there is less resistance to strain the β–can of the cpFP during movement of S4(Barnett, Platisa, Popovic, Pieribone, & Hughes, 2012; Gautam, Perron, Mutoh, & Knopfel, 2009). The third and final configuration involves the fusion of a single FP near the carboxy-terminus of the VSD. The probe, ArcLight (figure 1), that uses this configuration gives one of the largest changes in fluorescence reported(Han et al., 2013; Jin et al., 2012). While the mechanism for the voltage-induced fluorescent change is less obvious for ArcLight than the FRET or cpFP designs, there appears to be a requirement for the FP to be environmentally sensitive, ie. changes in physiological pH(Han et al., 2014; Kang & Baker, 2016).
Since ArcLight gives a large ΔF, this report will focus on the physical properties of ArcLight and ArcLight-derived probes and the consequences of having an FP that is sensitive to pH. The voltage-induced fluorescence change is faster than the pH-induced fluorescent signal. Alterations to the intracellular pH (pHi) can affect the resting fluorescence of the GEVI and thereby the ΔF/F. Having a probe that is capable of registering both voltage and pH changes enables the concomitant imaging of pHi and the firing of action potentials in neurons providing additional information on the buffering capacity of different regions of the cell.
Why a pH-sensitive FP?
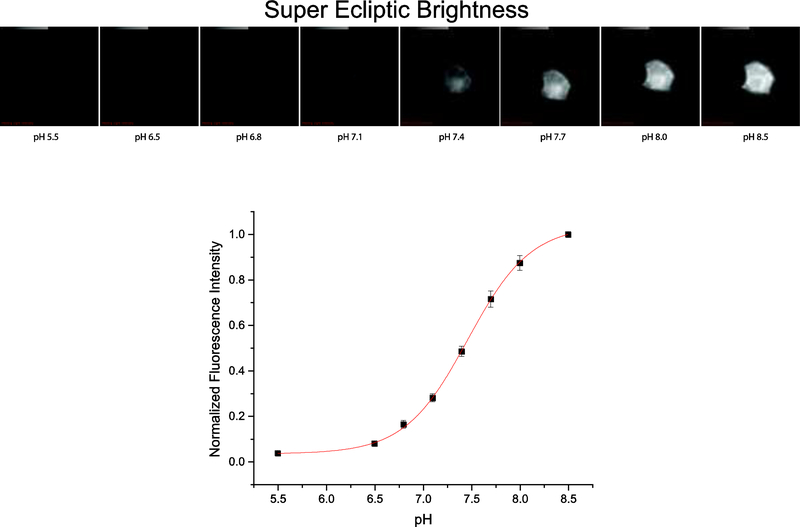
The mechanism of voltage-induced fluorescence changes for a GEVI consisting of a single FP is slowly being discerned. ArcLight was surreptiously discovered during the screening of GEVIs with different FPs using stable cell lines(Jin et al., 2012). Most of the cell lines expressing a VSD fused to the FP, Super Ecliptic pHluorin(Miesenbock, De Angelis, & Rothman, 1998; Ng et al., 2002), exhibited a 1% ΔF/F/100 mV depolarization of the plasma membrane. One cell line, however, showed a remarkable increase to 15% ΔF/F/100 mV depolarization(Jin et al., 2012). Analyzing the mRNA of that cell line revealed a point mutation to the FP, A227D (number corresponds to the position in the FP), which resulted in a negative charge on the outside of the β-can structure. This mutated version of Super Ecliptic pHluorin (SE227D) maintained its pH sensitivity (Figure 2). Optimization of the length of the protein linker between the VSD and SE227D improved the signal size to over 40% ΔF/F/100 mV(Han et al., 2013).
Figure 2. The super ecliptic pHluorin A227D is still responsive to changes in pH.
Top images are of a representative cell expressing SE227D getting brighter as the pH is increased. The bottom trace depicts the dependence of fluorescence on pH (average of 20 cells).
While the addition of the negative charge via the A227D mutation was found to be necessary for an increase in the voltage-dependent signal, the negative charge alone was not sufficient. Homologous substitutions at the A227 position to other FPs did not result in large, voltage-induced, optical signals(Han et al., 2014; Jin et al., 2012). In an attempt to identify the critical residues responsible for the improved voltage signal of SE227D, the Pieribone group systematically introduced SE227D mutations to eGFP and found four mutations that yielded a similar optical signal upon depolarization of the plasma membrane(Han et al., 2014). Interestingly, these mutations also shifted the pKa of eGFP to a physiologically relevant pH suggesting that pH sensitivity as well as a negative, external charge on the β-can of the FP were required for the improved optical response of the GEVI, ArcLight.
A GEVI consisting of a VSD from a voltage-gated proton channel provides insight into the mechanism of the voltage-induced optical signal.
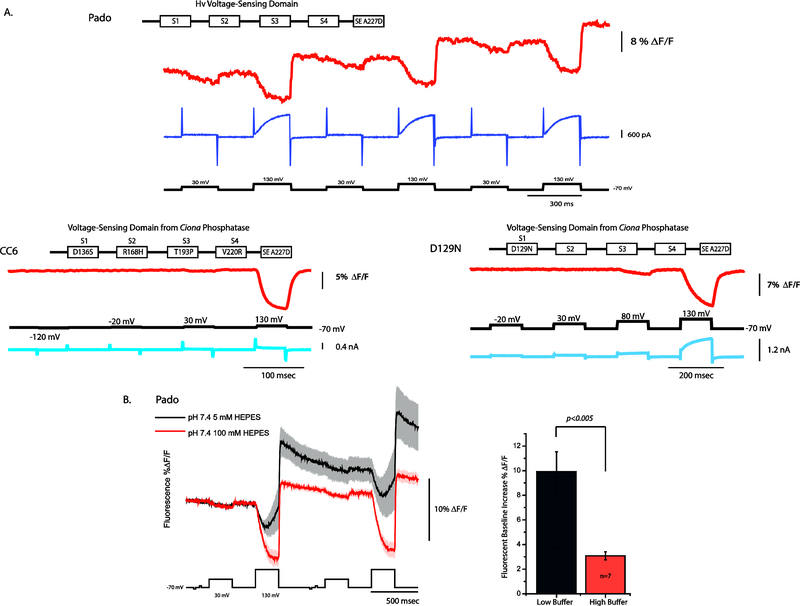
Further understanding of the mechanism behind the voltage-dependent optical signal came from the development of Pado, a GEVI that fused SE227D to the VSD of a voltage-gated proton channel (Hv). The conduction pathway for Hv channels resides in the VSD(Decoursey, 2012; Ramsey, Moran, Chong, & Clapham, 2006) enabling Pado to monitor voltage while manipulating pHi simultaneously (Figure 3A). A 100 mV depolarization of the plasma membrane from a holding potential of −70 mV resulted in a slight decrease in the fluorescent output of Pado. Increasing the depolarization step to 200 mV resulted in a larger decrease in the fluorescent output as well as a voltage-gated current. This voltage-gated current caused the alkalinization of the cytoplasm as protons escaped the cell resulting in a brighter fluorescence of SE227D upon the return to the holding potential (Figure 3A). The presence of a voltage-dependent current does not always affect the resting potential fluorescence. The D129N mutation in the S1 segment of the VSD of a GEVI named CC6 (Piao, Rajakumar, Kang, Kim, & Baker, 2015) resulted in a voltage-dependent current that did not affect the fluorescence of the probe upon the return to the holding potential (Figure 3A).
Figure 3. The pH sensitivity of SE A227D affects the holding potential fluorescence.
A. Comparison of the voltage-dependent optical signals from three different GEVIs expressed in HEK-293 cells. All three GEVIs use the SE A227D as the fluorescent protein. Pado uses a voltage-sensing domain from an Hv channel. CC6 and D129N use mutated version of the Ciona phosphatase voltage-sensing domain (modified with permission (Piao et al., 2015)). Pado and D129N both exhibit a voltage-dependent current, but only Pado exhibits a change in the baseline fluorescence upon the return to the holding potential (modified with permission (Kang & Baker, 2016)). B. The baseline change for Pado is due to a change in the intracellular pH. The black trace is the average from HEK-293 cells expressing Pado using an internal solution with 5 mM HEPES, pH 7.4. The red trace is the average from HEK-293 cells expressing Pado using an internal solution with 100 mM HEPES, pH 7.4. The dark line is the average of 5 cells for the 5 mM HEPES condition. The red trace is the average of 7 cells for the 100 mM HEPES condition. Shaded area is standard error of the mean.
Having a GEVI that exhibited Hv channel activity permitted inhibition studies with zinc that further ellucidated how the probe converts changes in membrane potential into an optical signal. Zinc inhibits the movement of S4 in Hv channels thereby keeping the channel in a closed state(Cherny & DeCoursey, 1999; Musset et al., 2010). Inhibition by zinc reduced the optical signal of Pado indicating that movement of S4 was responsible for the change in fluorescence during membrane depolarizations. Pado was also able to optically demonstrate multiple closed conformations of the channel since the 100 mV depolarization did not elicit a current but did give a transient change in fluorescence. To confirm that the voltage-induced current was altering the pHi, the buffering strength of the pipette solution was increased which diminished the effect of the baseline change during activation of the channel activity (Figure 3B). These results showed that the voltage-dependent signal could be seen even when the pHi changed. Pado, as well as ArcLight, could measure changes in voltage that were distinct from alterations in pH.
Dimerization of the FP, SE227D, is critical for the voltage-dependent, optical signal for ArcLight derived GEVIs.
One potential hypothesis to explain the voltage-dependent fluorescent signal of ArcLight-derived GEVIs involved the dragging of the outer negative charge of A227D across the β-can of the FP of a neighboring probe. The idea is that an environmentally sensitive FP would respond to the displacement of a nearby negative charge. This hypothesis depends on the dimerization (or a close interaction) of the GEVI via the FP domain of the sensor to put the negative charge in position to affect the fluorescence. To test that hypothesis, Kang and Baker introduced mutations to SE227D that favored the monomeric form by reducing the affinity of the FP to dimerize(Kang & Baker, 2016; Zacharias, Violin, Newton, & Tsien, 2002). Introduction of the monomer-favoring, 206K mutation into SE227D reduced the optical signal of the GEVI by 70% suggesting that dimerization or close proximity of the FPs of neighboring probes was important. The possibility of intermolecular interplay between the FP domains of ArcLight derived GEVIs was further strengthened by the reduction to the voltage-dependent optical signal when combinations of monomeric mutations were tested. The diminished signal when monomeric FPs are used in ArcLight-type GEVIs supports the hypothesis that the movement of S4 alters the position of the negative charge along the β-barrels of the FP domains. This change in environment for the FP results in the conversion of membrane potential changes into an optical signal.
The effect of pH on the voltage-dependent optical signal.
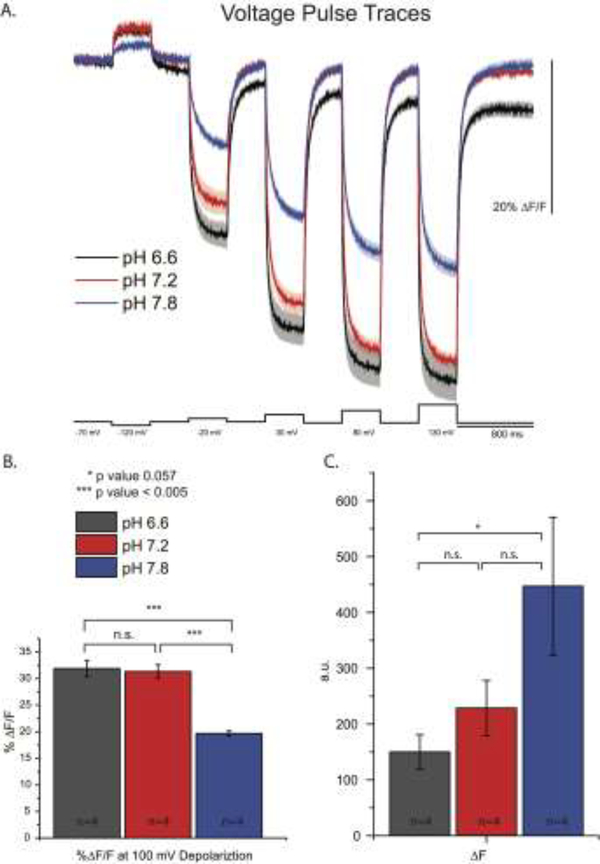
Since ArcLight-type probes seem to require a pH-sensitive FP, we examined the effects of pH on the voltage-induced optical signal. SE pHluorin has a pKa near 7.2 and exhibits the largest fluorescence change in response to changes in pH(Shen, Rosendale, Campbell, & Perrais, 2014). The A227D mutation did not change the pH sensitivity of SE phlourin(Jin et al., 2012). Figure 4A depicts the effect pHi has on the voltage-dependent optical signal of ArcLight. HEK-293 cells expressing ArcLight were whole-cell voltage clamped with different internal solutions varying in pH. The resting fluorescent intensity of SE227D increases as the pHi increases (Figure 4B). This has a consequence on the voltage-dependent optical signal. Since the resting light fluorescence is higher at pH 7.8, the ΔF/F is lower. This effect is most likely due to an increase in the internal fluorescence of the cell which does not respond to changes in plasma membrane potentials. The ΔF/F of ArcLight at pH 6.6 and 7.2 was virtually identical. ΔF was not significantly different for the three pH levels tested (Figure 4C).
Figure 4. Altering the internal pH of HEK 293 cells expressing ArcLight alters the voltage-dependent signal.
A. Optical traces from HEK 293 cells expressing ArcLight voltage-clamped under whole cell patch conditions and subjected to steps as indicated. B. Comparison of ΔF/F of the voltage-dependent optical signal at 100 mV. C. Comparison of ΔF of the voltage-dependent optical signal.
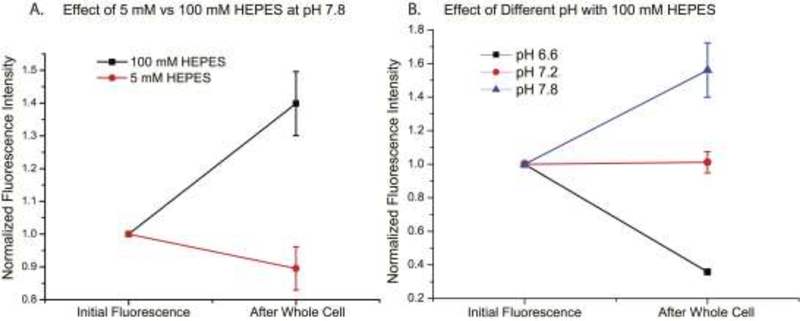
The cell has complex systems for regulating pH. In order to overcome that regulation and observe changes in the resting fluorescence of the cell, internal solutions buffered with 100 mM HEPES were required (Figure 5). Internal solutions of 5 mM HEPES did not increase the resting fluorescence of the cell after achieving whole-cell voltage clamp indicating that the buffering capacity of the cell was greater than that of the pipette solution (Figure 5A). Changes in resting light levels after achieving whole cell voltage clamp conditions were easily seen when the buffering capacity of the internal solution was higher (Figure 5B).
Figure 5. Effects of 100mM HEPES and 5mM HEPES solutions on the internal pH of the cell.
A.Fluorescence intensity measured before and after rupture of HEK cells with high and low buffers. B. Fluorescence intensity of Arclight expressing HEK cells with internal solutions of varying pH. N=4 for each pH condition.
Imaging the acidification of a neuron firing action potentials.
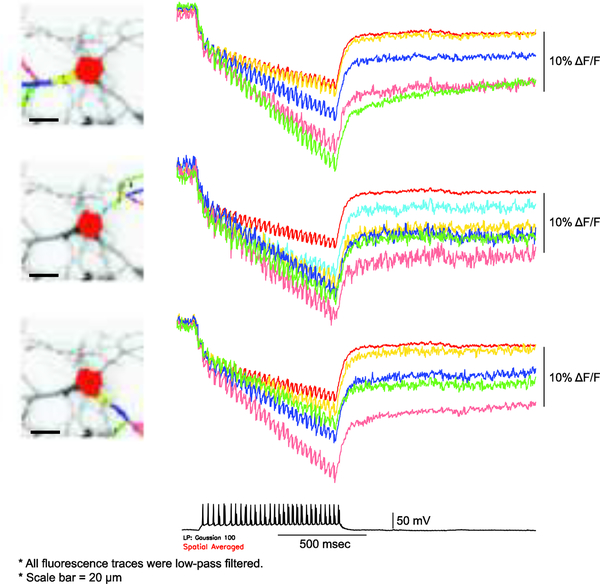
Neurons acidify upon high frequency firing of action potentials(Chesler, 2003; Raimondo, Irkle, Wefelmeyer, Newey, & Akerman, 2012; Rose & Deitmer, 1995a, 1995b; Xiong, Saggau, & Stringer, 2000). A striking result from the development of Pado was that intracellular pH changes were not uniform (see supplemental movie from Kang and Baker, 2016). Cell volume/buffering capacity contribute to the maintenance/disturbance of pHi. Smaller volumes will exhibit a larger pH change. For a neuron, the soma would therefore be more resistant to pH changes than the processes. Figure 6 shows altering acidification profiles for the soma versus the processes of a neuron. ArcLight was able to optically resolve action potentials firing at 36 Hz in cultured mouse hippocampal neuron. Comparison of the baseline change in the soma to that seen in the processes indicates that the pHi change is greater in the processes due to the larger volume/buffering capacity of the soma. The farther away from the soma, the larger the baseline change. The change in resting fluorescence was also seen in the original Bongwoori report (Piao et al., 2015) and correlates to the number of action potentials fired (Lee et al., 2017).
Figure 6. Imaging neuronal activity and acidification simultaneously. A mouse hippocampal neuron expressing ArcLight under whole cell current conditions.
Traces are color-coded to the region of interests. Soma is red. Regions farther away from the soma experience a larger shift in the baseline fluorescence while the spikes from the action potentials remain consistent. Imaging was continued for a long period of time after cessation of action potentials to demonstrate the change in baseline fluorescence is not due to bleaching.
Discussion
Here we discuss the consequences of a GEVI that utilizes a pH sensitive-FP. For ArcLight and its derivatives, the voltage signal is much larger and faster than the pH-dependent optical signal. pH has the potential to cause the fluorescence of ArcLight-type probes to change. In HEK cells, only when a GEVI utilizing an Hv VSD can a change in baseline fluorescence be observed(Kang & Baker, 2016). In neurons, upon high frequency spiking activity, a baseline change in fluorescence can also be seen(Piao et al., 2015). pH does not noticabely affect the ability of ArcLight to respond to voltage with two exceptions. At a relatively high pH of 7.8 the ΔF/F was reduced. Increasing the pHi to 7.8 increases the fluorescence of the probe both in the plasma membrane probe (voltage responsive population) and intra-cellular membranes (non-voltage responsive population). The contribution to the resting fluorescence, F, is therefore greater than the increase in ΔF resulting in a decrease in ΔF/F.
There currently does not exist a perfect GEVI. All genetically-encoded probes have strengths and weaknesses the experimenter should consider when imaging neuronal activity. The advantage of the rhodopsin-based probes is that they are fast. The GEVI, Ace2N-4aa-mNeon, only gives a 9% ΔF/F/100 mV(Lin & Schnitzer, 2016) in HEK 293 cells but is fast enough to optically resolve action potentials in vivo(Gong et al., 2015). ArcLight gives large changes in fluorescence (over 30% ΔF/F/ 100 mV(Han et al., 2014; Han et al., 2013; Lin & Schnitzer, 2016)) making it one of the easier GEVIs to image but is relatively slow limiting the resolution of subthreshold depolarizations from action potentials in population recordings. A potential weakness of some of the rhodopsin-based probes is that they have a light-induced current. ArcLight has the potential weakness of also responding to pH. Despite these weaknesses, the probes still have a number of potential applications. The weaknesses can also be diminished. The light-induced current can be negated by pre-exposure to light and the pH signal is relatively small and requires high frequency activity. Weaknesses could also be advantageous. The light-induced current of Ace2N-4aa-mNeon(Gong et al., 2015) and Archon1(Piatkevich et al., 2018) could be used to quantitate the effectiveness of trafficking to the plasma membrane. An increase in the light-induced current would reflect more probe in the plasma membrane. Alterations in the baseline fluorescence of ArcLight could indicate a change in the buffering capacity of the cell.
Materials and Methods
Cell culture
Embryonic mice (E17) (Koatech, South Korea) were euthanized for dissection of hippocampi. The dissected tissues were treated with trypsin-EDTA solution (Gibco, USA) for chemical dissociation. DNase1 (Sigma Aldrich, USA) was used shortly to prevent any clogging caused by nucleic acid from lysed cells. Autoclaved pipette tips were then used for trituration. The dissociated hippocampal neurons were seeded onto #0 coverslips that were coated with poly-D-lysine (Sigma-Aldrich, USA). The plated cells were incubated in a 5% CO2 incubator at 37°C for three hours. Then the media was replaced with neurobasal media containing 2% of B-27 supplement (Gibco, USA). At days in vitro (DIV) 5 – 7, the cultured hippocampal neurons were transfected with a lipofection reagent (Lipofectamine 2000, Invitrogen, USA) following the manufacturer’s protocol. The transfected neurons were verified for expression under an epifluorescence microscope and then experimented on DIV 12. The animal experiment was approved by the Institutional Animal Care and Use Committee at KIST (animal protocol 2014–001).
Electrophysiology
Glass capillary tubes for neuronal recording were pulled to resistance of 3–6 MΩ prior to each experiment. A neuron expressing the voltage indicator of interest was first patched under whole cell voltage clamp mode by using a patch clamp amplifier (HEKA, Germany). Holding potential of the cell was kept at −70 mV until the patch clamp setting was switched to current clamp mode. Current pulses with varying amplitude were then injected to depolarize the plasma membrane.
GEVI Expression
Glass coverslips (#0, Ted Pella Inc.) were washed (nitric acid overnight, water overnight, ethanol 3 days) and flamed before placing them into 24-well plates (Falcon,Thermo). The coverslips were coated with poly-l-lysine (Sigma). HEK293 cells, maintained in DMEM (GIBCO) +10% fetal bovine serum (GIBCO), were seeded onto the coated glass coverslips. Lipofectamine 2000 (Invitrogen) was used to transfect the cells according to the manufacturer’s instructions. Cells were patched within 24 hours of the transfection.
Fluorescence Intensity Measurements
To equilibrate the internal pH with the extracellular solution, HEK293 cells expressing ArcLight were exposed to gramicidin D (Sigma) at 50uM concentration in bath solution for 20 minutes. The gramicidin containing bath solution was then removed and fresh bath solution at desired pH values was applied and the cells were imaged for fluorescence intensity.
Patch Clamp
Patch clamp experiments were performed at 35 °C which was maintained by a flow-through heating mechanism as well as a patch chamber heating element (Warner Instruments TC-344B). The bath chamber was perfused with bath solution containing 150mM NaCl, 4mM KCl, 2mM CaCl2, 1mM MgCl2, and 5mM D-glucose, buffered with 5mM HEPES at different pH levels. High buffer capacity bath solution was also used for specific experiments and it contained 100mM NaCl, 3mM KCl, 0.5mM MgCl2, 1mM CaCl2, 3mM Glucose, with 100mM HEPES buffer.
Patch pipettes were pulled from capillary tubes (World Precision Instruments 1B150F-4) on a horizontal micropipette puller (Sutter Instruments P-97) and filled with pipette solution composed of 120mM K-aspartate, 4mM NaCl, 4mM MgCl2, 1mM CaCl2, 10mM EGTA, 3mM Na2ATP and 5mM HEPES adjusted to the desired pH with KOH. High buffer internal solution contained 75mM K Aspartate, 3mM NaCl, 3Mm MgCl2, 1mM CaCl2, 5mM EGTA, 3mM Na2ATP and 100mM HEPES.
Imaging
An inverted Olympus IX71 microscope (Olympus Korea) fitted with a 60× 1.35 numerical aperture oil-immersion lens (Olympus) was used to image both HEK293 cells and neurons. A 75 W Xenon arc lamp (Cairn) provided the excitation light through a filter cube optimized for GFP fluorescence; GFP-30LP-B (Semrock). The cube contained an excitation filter at 472nm (FF02–472/30–25), a dichroic mirror rated at 495nm (FF495 – Di03–25×36), and a long-pass emission filter starting at 496nm (FF01–496/LP-25) (Semrock). The image from the microscope was demagnified with an Optem zoom system (Qioptiq A45699) before being projected onto an 80×80 pixel e2v CCD39 chip of the NeuroCCD-SM80 camera (Red Shirt Imaging). The setup was mounted on an antivibration table (Kinetic Systems, Minus K Technology). Instruments that had moving parts such as the arclamp, amplifier, and mechanical shutter were placed on another surface to avoid motion artefacts during imaging.
Analyses
Optical signal recordings were analyzed using Neuroplex (Redshirt Imaging) and Origin8.6 (Origin Labs). Off-line low-pass filtering used to improve the signal-to-noise ratio is indicated in the figures. The Boltzmann fit, student’s t-test and ANOVA were done with Origin.
Highlights.
A pH-sensitive fluorescent protein enables a voltage dependent optical signal.
A negative charge on the fluorescent protein improves the optical signals.
Dimerization via the fluorescent protein domain is required for large signals.
Voltage induced conformational changes alter the position of the negative charge.
ArcLight is capable of optically resolving voltage and pH simultaneously.
Acknowledgements
We thank Dr. Lawrence Cohen for critical review of the manuscript. Research reported in this publication was supported by the National Institute Of Neurological Disorders And Stroke of the National Institutes of Health under Award Number U01NS099691. The content is solely the responsibility of the authors and does not necessarily represent the official views of the National Institutes of Health. This study was also funded by the Korea Institute of Science and Technology (KIST) grants 2E26190 and 2E26170. S. Lee was supported by Global Ph.D. Fellowship program (NRF-2013H1A2A1033344) of the National Research Foundation (NRF), Ministry of Education (Korea). The research was also supported by Basic Science Research Program (NRF-2015R1D1A1A01060569) through the National Research Foundation of Korea (NRF), Ministry of Education.
Footnotes
Publisher's Disclaimer: This is a PDF file of an unedited manuscript that has been accepted for publication. As a service to our customers we are providing this early version of the manuscript. The manuscript will undergo copyediting, typesetting, and review of the resulting proof before it is published in its final citable form. Please note that during the production process errors may be discovered which could affect the content, and all legal disclaimers that apply to the journal pertain.
References
- Akemann W, Mutoh H, Perron A, Park YK, Iwamoto Y, & Knopfel T (2012). Imaging neural circuit dynamics with a voltage-sensitive fluorescent protein. J Neurophysiol, 108(8), 2323–2337. doi: 10.1152/jn.00452.2012 [DOI] [PubMed] [Google Scholar]
- Baker BJ, Jin L, Han Z, Cohen LB, Popovic M, Platisa J, & Pieribone V (2012). Genetically encoded fluorescent voltage sensors using the voltage-sensing domain of Nematostella and Danio phosphatases exhibit fast kinetics. J Neurosci Methods, 208(2), 190–196. doi: 10.1016/j.jneumeth.2012.05.016 [DOI] [PMC free article] [PubMed] [Google Scholar]
- Baker BJ, Lee H, Pieribone VA, Cohen LB, Isacoff EY, Knopfel T, & Kosmidis EK (2007). Three fluorescent protein voltage sensors exhibit low plasma membrane expression in mammalian cells. J Neurosci Methods, 161(1), 32–38. doi: 10.1016/j.jneumeth.2006.10.005 [DOI] [PubMed] [Google Scholar]
- Barnett L, Platisa J, Popovic M, Pieribone VA, & Hughes T (2012). A fluorescent, geneticallyencoded voltage probe capable of resolving action potentials. PLoS One, 7(9), e43454. doi: 10.1371/journal.pone.0043454 [DOI] [PMC free article] [PubMed] [Google Scholar]
- Borden PY, Ortiz AD, Waiblinger C, Sederberg AJ, Morrissette AE, Forest CR, . . . Stanley GB (2017). Genetically expressed voltage sensor ArcLight for imaging large scale cortical activity in the anesthetized and awake mouse. Neurophotonics, 4(3), 031212. doi: 10.1117/1.NPh.4.3.031212 [DOI] [PMC free article] [PubMed] [Google Scholar]
- Cherny VV, & DeCoursey TE (1999). pH-dependent inhibition of voltage-gated H(+) currents in rat alveolar epithelial cells by Zn(2+) and other divalent cations. J Gen Physiol, 114(6), 819–838. [DOI] [PMC free article] [PubMed] [Google Scholar]
- Chesler M (2003). Regulation and modulation of pH in the brain. Physiol Rev, 83(4), 1183–1221. doi: 10.1152/physrev.00010.2003 [DOI] [PubMed] [Google Scholar]
- Decoursey TE (2012). Voltage-gated proton channels. Compr Physiol, 2(2), 1355–1385. doi: 10.1002/cphy.c100071 [DOI] [PMC free article] [PubMed] [Google Scholar]
- Dimitrov D, He Y, Mutoh H, Baker BJ, Cohen L, Akemann W, & Knopfel T (2007). Engineering and characterization of an enhanced fluorescent protein voltage sensor. PLoS One, 2(5), e440. doi: 10.1371/journal.pone.0000440 [DOI] [PMC free article] [PubMed] [Google Scholar]
- Gautam SG, Perron A, Mutoh H, & Knopfel T (2009). Exploration of fluorescent protein voltage probes based on circularly permuted fluorescent proteins. Front Neuroeng, 2, 14. doi: 10.3389/neuro.16.014.2009 [DOI] [PMC free article] [PubMed] [Google Scholar]
- Gong Y, Huang C, Li JZ, Grewe BF, Zhang Y, Eismann S, & Schnitzer MJ (2015). High-speed recording of neural spikes in awake mice and flies with a fluorescent voltage sensor. Science, 350(6266), 1361–1366. doi: 10.1126/science.aab0810 [DOI] [PMC free article] [PubMed] [Google Scholar]
- Gong Y, Wagner MJ, Zhong Li J, & Schnitzer MJ (2014). Imaging neural spiking in brain tissue using FRET-opsin protein voltage sensors. Nat Commun, 5, 3674. doi: 10.1038/ncomms4674 [DOI] [PMC free article] [PubMed] [Google Scholar]
- Han Z, Jin L, Chen F, Loturco JJ, Cohen LB, Bondar A, . . . Pieribone VA (2014). Mechanistic studies of the genetically encoded fluorescent protein voltage probe ArcLight. PLoS One, 9(11), e113873. doi: 10.1371/journal.pone.0113873 [DOI] [PMC free article] [PubMed] [Google Scholar]
- Han Z, Jin L, Platisa J, Cohen LB, Baker BJ, & Pieribone VA (2013). Fluorescent protein voltage probes derived from ArcLight that respond to membrane voltage changes with fast kinetics. PLoS One, 8(11), e81295. doi: 10.1371/journal.pone.0081295 [DOI] [PMC free article] [PubMed] [Google Scholar]
- Inagaki S, Tsutsui H, Suzuki K, Agetsuma M, Arai Y, Jinno Y, . . . Nagai T (2017). Genetically encoded bioluminescent voltage indicator for multi-purpose use in wide range of bioimaging. Sci Rep, 7, 42398. doi: 10.1038/srep42398 [DOI] [PMC free article] [PubMed] [Google Scholar]
- Jin L, Han Z, Platisa J, Wooltorton JR, Cohen LB, & Pieribone VA (2012). Single action potentials and subthreshold electrical events imaged in neurons with a fluorescent protein voltage probe. Neuron, 75(5), 779–785. doi: 10.1016/j.neuron.2012.06.040 [DOI] [PMC free article] [PubMed] [Google Scholar]
- Kang BE, & Baker BJ (2016). Pado, a fluorescent protein with proton channel activity can optically monitor membrane potential, intracellular pH, and map gap junctions. Sci Rep, 6, 23865. doi: 10.1038/srep23865 [DOI] [PMC free article] [PubMed] [Google Scholar]
- Kralj JM, Douglass AD, Hochbaum DR, Maclaurin D, & Cohen AE (2012). Optical recording of action potentials in mammalian neurons using a microbial rhodopsin. Nat Methods, 9(1), 90–95. doi: 10.1038/nmeth.1782 [DOI] [PMC free article] [PubMed] [Google Scholar]
- Lee S, Geiller T, Jung A, Nakajima R, Song Y-K, & Baker BJ (2017). Improving a genetically encoded voltage indicator by modifying the cytoplasmic charge composition. Scientific Reports, 7(1), 8286. doi: 10.1038/s41598-017-08731-2 [DOI] [PMC free article] [PubMed] [Google Scholar]
- Lin MZ, & Schnitzer MJ (2016). Genetically encoded indicators of neuronal activity. Nat Neurosci, 19(9), 1142–1153. doi: 10.1038/nn.4359 [DOI] [PMC free article] [PubMed] [Google Scholar]
- Lou S, Adam Y, Weinstein EN, Williams E, Williams K, Parot V, . . . Cohen AE (2016). Genetically Targeted All-Optical Electrophysiology with a Transgenic Cre-Dependent Optopatch Mouse. J Neurosci, 36(43), 11059–11073. doi: 10.1523/JNEUROSCI.1582-16.2016 [DOI] [PMC free article] [PubMed] [Google Scholar]
- Miesenbock G, De Angelis DA, & Rothman JE (1998). Visualizing secretion and synaptic transmission with pH-sensitive green fluorescent proteins. Nature, 394(6689), 192–195. doi: 10.1038/28190 [DOI] [PubMed] [Google Scholar]
- Murata Y, Iwasaki H, Sasaki M, Inaba K, & Okamura Y (2005). Phosphoinositide phosphatase activity coupled to an intrinsic voltage sensor. Nature, 435(7046), 1239–1243. doi: 10.1038/nature03650 [DOI] [PubMed] [Google Scholar]
- Musset B, Smith SM, Rajan S, Cherny VV, Sujai S, Morgan D, & DeCoursey TE (2010). Zinc inhibition of monomeric and dimeric proton channels suggests cooperative gating. J Physiol, 588(Pt 9), 1435–1449. doi: 10.1113/jphysiol.2010.188318 [DOI] [PMC free article] [PubMed] [Google Scholar]
- Nakajima R, Jung A, Yoon BJ, & Baker BJ (2016). Optogenetic Monitoring of Synaptic Activity with Genetically Encoded Voltage Indicators. Front Synaptic Neurosci, 8, 22. doi: 10.3389/fnsyn.2016.00022 [DOI] [PMC free article] [PubMed] [Google Scholar]
- Ng M, Roorda RD, Lima SQ, Zemelman BV, Morcillo P, & Miesenbock G (2002). Transmission of olfactory information between three populations of neurons in the antennal lobe of the fly. Neuron, 36(3), 463–474. [DOI] [PubMed] [Google Scholar]
- Piao HH, Rajakumar D, Kang BE, Kim EH, & Baker BJ (2015). Combinatorial mutagenesis of the voltage-sensing domain enables the optical resolution of action potentials firing at 60 Hz by a genetically encoded fluorescent sensor of membrane potential. J Neurosci, 35(1), 372–385. doi: 10.1523/JNEUROSCI.3008-14.2015 [DOI] [PMC free article] [PubMed] [Google Scholar]
- Piatkevich KD, Jung EE, Straub C, Linghu C, Park D, Suk HJ, . . . Boyden ES (2018). A robotic multidimensional directed evolution approach applied to fluorescent voltage reporters. Nat Chem Biol, 14(4), 352–360. doi: 10.1038/s41589-018-0004-9 [DOI] [PMC free article] [PubMed] [Google Scholar]
- Raimondo JV, Irkle A, Wefelmeyer W, Newey SE, & Akerman CJ (2012). Genetically encoded proton sensors reveal activity-dependent pH changes in neurons. Front Mol Neurosci, 5, 68. doi: 10.3389/fnmol.2012.00068 [DOI] [PMC free article] [PubMed] [Google Scholar]
- Ramsey IS, Moran MM, Chong JA, & Clapham DE (2006). A voltage-gated proton-selective channel lacking the pore domain. Nature, 440(7088), 1213–1216. doi: 10.1038/nature04700 [DOI] [PMC free article] [PubMed] [Google Scholar]
- Rose CR, & Deitmer JW (1995a). Stimulus-evoked changes of extra- and intracellular pH in the leech central nervous system. I. Bicarbonate dependence. J Neurophysiol, 73(1), 125–131. [DOI] [PubMed] [Google Scholar]
- Rose CR, & Deitmer JW (1995b). Stimulus-evoked changes of extra- and intracellular pH in the leech central nervous system. II. Mechanisms and maintenance of pH homeostasis. J Neurophysiol, 73(1), 132–140. [DOI] [PubMed] [Google Scholar]
- Sepehri Rad M, Choi Y, Cohen LB, Baker BJ, Zhong S, Storace DA, & Braubach OR (2017). Voltage and Calcium Imaging of Brain Activity. Biophys J, 113(10), 2160–2167. doi: 10.1016/j.bpj.2017.09.040 [DOI] [PMC free article] [PubMed] [Google Scholar]
- Shen Y, Rosendale M, Campbell RE, & Perrais D (2014). pHuji, a pH-sensitive red fluorescent protein for imaging of exo- and endocytosis. J Cell Biol, 207(3), 419–432. doi: 10.1083/jcb.201404107 [DOI] [PMC free article] [PubMed] [Google Scholar]
- St-Pierre F, Chavarha M, & Lin MZ (2015). Designs and sensing mechanisms of genetically encoded fluorescent voltage indicators. Curr Opin Chem Biol, 27, 31–38. doi: 10.1016/j.cbpa.2015.05.003 [DOI] [PMC free article] [PubMed] [Google Scholar]
- St-Pierre F, Marshall JD, Yang Y, Gong Y, Schnitzer MJ, & Lin MZ (2014). High-fidelity optical reporting of neuronal electrical activity with an ultrafast fluorescent voltage sensor. Nat Neurosci, 17(6), 884–889. doi: 10.1038/nn.3709 [DOI] [PMC free article] [PubMed] [Google Scholar]
- Storace D, Rad MS, Han Z, Jin L, Cohen LB, Hughes T, . . . Sung U (2015). Genetically Encoded Protein Sensors of Membrane Potential. Adv Exp Med Biol, 859, 493–509. doi: 10.1007/978-3-319-17641-3_20 [DOI] [PubMed] [Google Scholar]
- Storace D, Sepehri Rad M, Kang B, Cohen LB, Hughes T, & Baker BJ (2016). Toward Better Genetically Encoded Sensors of Membrane Potential. Trends Neurosci, 39(5), 277–289. doi: 10.1016/j.tins.2016.02.005 [DOI] [PMC free article] [PubMed] [Google Scholar]
- Storace DA, Braubach OR, Jin L, Cohen LB, & Sung U (2015). Monitoring brain activity with protein voltage and calcium sensors. Sci Rep, 5, 10212. doi: 10.1038/srep10212 [DOI] [PMC free article] [PubMed] [Google Scholar]
- Storace DA, & Cohen LB (2017). Measuring the olfactory bulb input-output transformation reveals a contribution to the perception of odorant concentration invariance. Nat Commun, 8(1), 81. doi: 10.1038/s41467-017-00036-2 [DOI] [PMC free article] [PubMed] [Google Scholar]
- Sung U, Sepehri-Rad M, Piao HH, Jin L, Hughes T, Cohen LB, & Baker BJ (2015). Developing Fast Fluorescent Protein Voltage Sensors by Optimizing FRET Interactions. PLoS One, 10(11), e0141585. doi: 10.1371/journal.pone.0141585 [DOI] [PMC free article] [PubMed] [Google Scholar]
- Xiong ZQ, Saggau P, & Stringer JL (2000). Activity-dependent intracellular acidification correlates with the duration of seizure activity. J Neurosci, 20(4), 1290–1296. [DOI] [PMC free article] [PubMed] [Google Scholar]
- Yang HH, & St-Pierre F (2016). Genetically Encoded Voltage Indicators: Opportunities and Challenges. J Neurosci, 36(39), 9977–9989. doi: 10.1523/JNEUROSCI.1095-16.2016 [DOI] [PMC free article] [PubMed] [Google Scholar]
- Yang HH, St-Pierre F, Sun X, Ding X, Lin MZ, & Clandinin TR (2016). Subcellular Imaging of Voltage and Calcium Signals Reveals Neural Processing In Vivo. Cell, 166(1), 245–257. doi: 10.1016/j.cell.2016.05.031 [DOI] [PMC free article] [PubMed] [Google Scholar]
- Zacharias DA, Violin JD, Newton AC, & Tsien RY (2002). Partitioning of lipid-modified monomeric GFPs into membrane microdomains of live cells. Science, 296(5569), 913–916. doi: 10.1126/science.1068539 [DOI] [PubMed] [Google Scholar]
- Zou P, Zhao Y, Douglass AD, Hochbaum DR, Brinks D, Werley CA, . . . Cohen AE (2014). Bright and fast multicoloured voltage reporters via electrochromic FRET. Nat Commun, 5, 4625. doi: 10.1038/ncomms5625 [DOI] [PMC free article] [PubMed] [Google Scholar]


