

Abstract
We recently conducted a large association analysis to compare the genetic profiles between patients with psoriatic arthritis (PsA) and cutaneous-only psoriasis (PsC). Despite including over 7,000 genotyped patients, only the MHC achieved genome-wide significance. In this study, we hypothesized that appropriate epigenomic elements (H3K27ac marks for active enhancers) can guide us to reveal valuable information about the loci with suggestive evidence of association. Our aim is to investigate these loci and explore how they may lead to the development of PsA. We evaluated this potential by investigating the genes connected with these loci from the perspective of pharmacogenomics and gene expression. We illustrated that markers with suggestive evidence of association outside the MHC region are enriched in H3K27ac marks for osteoblast and chondrogenic differentiated cells; using pharmacogenomics resources, we showed that genes near these markers are targeted by existing drugs used to treat psoriatic arthritis. Significantly, six of the ten suggestive significant loci overlapping the regulatory elements encompass genes differentially expressed (FDR < 5%) in differentiated osteoblasts, including genes participating in the Wnt signaling such as RUNX1, FUT8, and CTNNAL1. Our approach shows that epigenomic information can be used as cost-effective approach to enhance the inferences for GWAS results, especially in situations when few genome-wide significant loci are available. Our results also point the way to more directed investigations comparing the genetics of PsA and PsC.
Keywords: psoriatic arthritis, gene candidates, systems biology, epigenomics, GWAS
Introduction
Genome-wide association studies (GWAS) are a well-developed hypothesis-free approach for identifying susceptibility loci of complex diseases, and have been applied to study different skin conditions (Tsoi et al., 2018). For instance, many distinct genome-wide significant loci have been revealed for psoriasis among Caucasian patients (Tsoi et al., 2017; Patrick et al., 2018), and the information gained from these studies can be used to improve our understanding of disease pathogenesis as well as to guide further experiments. Nevertheless, there are two main limitations: first, disease-associated loci are often positioned in non-coding regions, and it is not trivial to reveal their cell-type specific gene targets; second, many loci remain undetected, due to their subtle effect sizes (Boyle et al., 2017). Increasing the sample size does help to enhance statistical power and reveal more loci (Jansen et al., 2018; Mahajan et al., 2018), but this can be difficult (and expensive) to achieve for diseases with relatively low prevalence, such as psoriatic arthritis [<0.5% (Alamanos et al., 2008)]. Therefore, integrative approaches are necessary to decipher the biological implications of GWAS results when genome-wide significant loci are unavailable.
Typical GWAS approaches ignore potentially valuable information by only reporting markers showing genome-wide significant association. We and others have illustrated that epigenetic and pharmacological data can be used to provide biological inference for GWAS (Okada et al., 2014; Farh et al., 2015; Tsoi et al., 2017; Patrick et al., 2018). Recently, we performed a GWAS meta-analysis of psoriatic arthritis (PsA) vs. cutaneous-only psoriasis (PsC), using over 7,000 psoriatic patients across 6 cohorts (Patrick et al., 2018). Even though PsA has been estimated as having over 80% heritability (Greb et al., 2016), no markers outside the major histocompatibility complex (MHC) were genome-wide significant; however, we showed that markers outside the MHC are also informative to provide PsA assessment among psoriatic patients. In this study, we utilize an integrated approach to analyze the biological mechanisms involving suggestive significant loci. By leveraging additional independent information, we identify potential disease-relevant genes from the suggestive significant loci outside the MHC and provide enhanced interpretation of further pathological mechanisms for psoriatic arthritis. Our work illustrates that valuable information is embedded in association results for loci which fall shy of genome-wide significance, and our integrated approach can be used to extract that information from GWAS results.
Methods
PsA vs. PsC Meta-Analysis
The overview of our workflow is illustrated in Figure 1A. We utilized previous meta-analysis results (Patrick et al., 2018), consisting of 3,566 dermatologist-diagnosed PsC and 3,674 rheumatologist-diagnosed PsA patients of Caucasian descent from 5 GWAS datasets: CASP (Nair et al., 2009), Exomechip (Tsoi et al., 2017), Genizon (Ellinghaus et al., 2010), Kiel (Ellinghaus et al., 2010), and PsA GWAS (Stuart et al., 2015) and one Immunochip dataset PAGE (Tsoi et al., 2012). We defined PsC patients as having psoriasis for ≥10 years without a PsA diagnosis. Informed consent was received from all patients in accordance with the Declaration of Helsinki and the protocols approved by each institutional review board. Quality control, phasing/imputation (using HRC/G1K reference panels) and association analysis were performed as described previously (Patrick et al., 2018). Meta-analysis (Willer et al., 2010) was performed separately for PsA vs. control and PsC vs. control, and we compared the summary statistics results with a chi-square statistic for indirect meta-analysis (Stuart et al., 2015).
FIGURE 1.
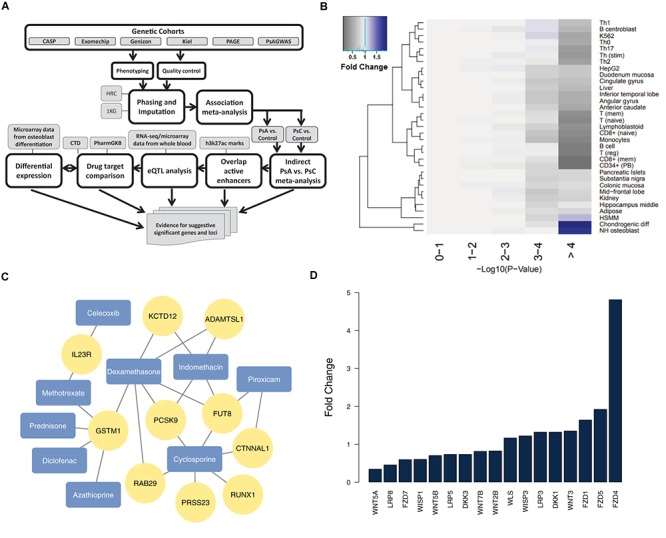
Analysis of suggestive significant PsA vs. PsC loci outside the MHC (A) our pipeline for identifying and analyzing non-MHC suggestive significant loci; (B) H3K27ac marks for active enhancers reveal chondrogenic and osteoblast cell type enrichment (negative logarithmic p-value shown) among suggestive significant (p < 1 × 10⁻⁴) markers – fold change is determined by comparing the proportion of markers that overlap active enhancers for a particular cell type in each –log10 p-value with that of the 0–1 reference bin; (C) genes from suggestive association loci are targets of drugs for PsA (arthritis drugs from DrugBank are colored in blue, and their drug targets from CTD/PharmGKB in yellow); (D) Wnt signaling genes are differentially expressed (FDR < = 5%) in differentiated osteoblasts.
Prioritization of Candidate Cell Types and Genes
Our previous study illustrated that the most significant markers in the PsA vs. PsC association (mostly in the MHC) were enriched in regulatory elements in immune cells (Patrick et al., 2018). Here, our study focused on association results outside the MHC (26–34 Mb of chromosome 6), and we overlapped the suggestive significant (p < 1 × 10⁻⁴) markers identified by indirect PsA vs. PsC meta-analysis against active regulatory elements, measured by H3K27ac marks (Farh et al., 2015). The enrichment of cell types with active enhancer overlap was evaluated at different levels of significance in PsA vs. PsC meta-analysis, compared to markers which overlap active enhancers available for any cell/tissue type. Arthritis drugs were identified from DrugBank (Wishart et al., 2018) and their gene targets extracted from the Comparative Toxicogenomics Database (CTD) (Davis et al., 2015) and PharmGKB (Thorn et al., 2013), which were merged together in our previous work (Raja et al., 2017). We identified the most significant eQTL targets, for the markers overlapping the regulatory elements, from a study with whole blood from 31,684 individuals (Võsa et al., 2018), to identify the most probable genes for each locus. Differential expression analysis was conducted using moderated t-statistics from a linear model fitted by limma (Ritchie et al., 2015) in GEO2R (Barrett et al., 2013) on a previous study (van de Peppel et al., 2017) which characterized the gene expression of human osteoblast cells differentiation from mesenchymal stromal cells: we compared pre-differentiation versus 3-day post-differentiation from three replicated samples, used the most significant probeset when multiple were available, and defined significant differentially expressed genes (DEGs) as yielding False Discovery Rate (FDR) <5%.
Results
Enrichment of Suggestive Significant Markers Among Active Enhancers for Normal Human (NH) Osteoblasts and Chondrogenic Differentiated Cells
We overlapped all 165 suggestive significant (p < 1 × 10⁻⁴) PsA vs. PsC markers (Supplementary Table 1) from 49 distinct loci outside the MHC (loci being defined as contiguous regions encompassing multiple markers, with <500 kb genomic distance between any two suggestive significant markers) against H3K27ac chromatin marks. There are 53 markers (18 loci) which overlapped active enhancers for any cell type; we used these in Fisher’s exact test as the baseline reference for enrichment of specific cell types: we compared the number of suggestive significant/non-significant markers which overlap active enhancers for a specific cell type, with those that overlap active enhancers for any other cell type (Supplementary Table 2). Chondrogenic differentiated cells (p = 3.99 × 10⁻⁵, OR = 3.1, Fold Change (FC) = 1.9; 30 markers from 10 loci) and osteoblasts (p = 3.33 × 10⁻⁴, OR = 2.7, FC = 1.8; 29 markers from 7 loci) are the only cell types showing significant enrichment (after Bonferroni correction). Indeed, the suggestive significant markers tend to have context-specific overlap with chondrogenic cells and osteoblasts (with 1.91 and 1.75 times more overlap compared to baseline significance, respectively), as they show decreased overlap for most other cell types (Figure 1B).
Genes Near the Suggestive Significant Loci Which Overlap Active Enhancers for Osteoblast and Chondrogenic Cells Are Targeted by Drugs Used to Treat Psoriatic Arthritis
Cartilage and bone destruction/growth is known to play a significant role in the development of PsA, and potential biomarkers have been identified that are involved in their regulation (Chandran et al., 2010). By focusing on the suggestive significant markers that overlap active enhancers for the enriched cell types, we aimed to identify associated gene targets by utilizing drug-gene interactions (Okada et al., 2014; Tsoi et al., 2017). We used our compiled drug-target database to identify target genes nearby for each of the 10 loci that overlap active enhancers for osteoblast or chondrogenic cells (Table 1 and Figure 1C), and found the diseases these drugs are used to treat. The genes were identified using eQTLs or distance to each locus; the drugs that target these genes were identified using the CTD/PharmGKB database, from which we selected drugs used to treat arthritis according to DrugBank. We included the most plausible gene from every locus (using eQTL or distance) as well as the drugs that target these genes. Significantly, all 10 loci encompass genes targeted by at least one PsA drug. Four of the drugs (celecoxib, diclofenac, indomethacin, and piroxicam) are non-steroidal anti-inflammatory drugs (NSAIDs), but there are also three immunosuppressive drugs (azathioprine, cyclosporine, and methotrexate) and two corticosteroids (dexamethasone and prednisone), used to treat psoriasis in general. Furthermore, three of the most significant loci (encompassing RUNX1 p = 2.95 × 10⁻⁵, FUT8 p = 4.44 × 10⁻⁵ and CTNNAL1 p = 1.02 × 10⁻⁵, respectively) are thought to be involved in Wnt signaling (a key regulator of bone formation) (Merdek et al., 2004; Kurimoto et al., 2014; Chimge et al., 2016).
Table 1.
Suggestive significant (p < 1 × 10⁻⁴) loci overlapping active enhancers for osteoblast or chondrogenic cells, ranked by GWAS p-value of most significant marker (min p-value) overlapping regulatory elements for either cell type.
| Locus | Osteoblast min p-value | Chondrogenic min p-value | Notable nearby gene | Drug with target in the locus |
|---|---|---|---|---|
| 11q14.2 (85993121–87015072) | 2.27 × 10⁻⁵ (rs7123349) | 1.52 × 10⁻⁵ (rs7940637) | PRSS23 (eQTL: p = 1.21 × 10⁻⁷; rs1939110) | Cyclosporine |
| 21q22.1 (36472001–37559234) | 4.91 × 10⁻⁵ (rs2835060) | 2.95 × 10⁻⁵ (rs2242761) | RUNX1 (proximity: intron; rs2242761) | Cyclosporine |
| 14q23.3(65202594–66220065) | 4.44 × 10⁻⁵ (rs7146907) | 4.44 × 10⁻⁵ (rs7146907) | FUT8 (eQTL: p = 1.30 × 10⁻¹⁹; rs7146907) | Cyclosporine, Dexamethasone, Indomethacin, Piroxicam |
| 9q31.2(110560196–111560196) | 4.95 × 10⁻⁵ (rs77922938) | 4.95 × 10⁻⁵ (rs77922938) | CTNNAL1(eQTL: p = 1.02 × 10⁻⁵; rs77922938) | Cyclosporine, Piroxicam |
| 9p22.2 (17928324–18941918) | 5.08 × 10⁻⁵ (rs9406750) | 8.91 × 10⁻⁵ (rs7043305) | ADAMTSL1 (proximity: 32 kb; rs7043305) | Dexamethasone, Indomethacin |
| 1p31.3 (67103343–68144173) | NA | 5.92 × 10⁻⁵ (rs7539795) | IL23R (eQTL: p = 1.03 × 10⁻²⁴; rs7539795) | Celecoxib, Methotrexate |
| 1p13.3 (109829214–110833792) | 8.64 × 10⁻⁵ (rs139201738) | 7.54 × 10⁻⁵ (rs6698967) | GSTM1 (eQTL: p = 1.29 × 10⁻⁵; rs6698967) | Azathioprine, Dexamethasone, Diclofenac, Methotrexate, Prednisone |
| 13q22.3 (76955805–77955805) | 7.63 × 10⁻⁵ (rs373098847) | 7.63 × 10⁻⁵ (rs373098847) | KCTD12 (proximity: 3’ UTR; rs373098847) | Dexamethasone, Indomethacin |
| 1q32.1 (205107153–206107153) | NA | 7.70 × 10⁻⁵ (rs77244682) | RAB29 (eQTL: p = 3.14 × 10⁻¹¹; rs77244682) | Cyclosporine, Dexamethasone |
| 1p32.3 (55018752–56018752) | NA | 8.05 × 10⁻⁵ (rs7552841) | PCSK9 (proximity: intron; rs7552841) | Cyclosporine, Dexamethasone, Indomethacin |
For the markers we include in the eQTL column, we first selected from the suggestive significant (PsA vs. PsC) markers that are eQTLs in the database, and overlapped them with the regulatory elements. If multiple markers satisfy the criteria, we selected the most significant marker-gene association for presentation and, where no markers satisfy the criteria, we provide the proximity to the nearest gene, along with the drug targets for each gene. For example, while rs1939110 is not the most significant marker overlapping active enhancers for osteoblast (rs7123349: r2 = 0.72) or chondrogenic cells (rs7940637: r2 = 0.60) in the first locus, it is suggestive significant for PsA vs. PsC (6.47 × 10⁻⁵) and it is the most significant eQTL (p = 1.21 × 10⁻⁷).
Differential Expression
We then investigated their differential expression following osteoblast differentiation. Interestingly, 6 of the top 10 loci shown in Table 1 encompass genes significantly differentially expressed (FDR < 5%) in differentiated cells: PRSS23 (FC = 1.29, p = 4.89 × 10⁻³, 11q14.2), RUNX1 (FC = 0.658, p = 1.30 × 10⁻³, 21q22.12), FUT8 (FC = 0.706, p = 3.70 × 10⁻³, 14q23.3), CTNNAL1 (FC = 0.633, p = 1.34 × 10⁻⁵, 9q31.2), ADAMTSL1 (FC = 0.757, p = 3.35 × 10⁻⁶, 9p22.2), GSTM1 (FC = 1.49, p = 1.56 × 10⁻⁴, 1p13.3); from loci with suggestive evidence of association that do not overlap with osteoblasts/chondrogenic differentiated cells, we also observed differentially expressed genes that participate in the Wnt signaling pathway: WNT5A (FC = 0.344, p = 3.24 × 10⁻⁶, 3p14.3), DKK1 (FC = 1.32, p = 2.06 × 10⁻⁶, 10q21.1) and FZD4 (FC = 4.81, p = 7.11 × 10⁻¹⁰, 11q14.2) (Figure 1D). Differential regulation of genes during differentiation, as well as genes involved in the same pathway (e.g., Wnt signaling) provide further evidence of genuine signals among the suggestive significant loci identified by GWAS.
Discussion
When working with suggestive significant loci, there is always a danger of false positives. Independent epigenomic information allows us to focus on loci that have an effect on cells and tissues relevant to the disease, and thus are more likely to represent genuine signals. Focusing on suggestive significant loci that overlap active enhancers for NH osteoblasts and chondrogenic differentiated cells, we were able to identify genes that are targets of PsA drugs and differentially expressed following osteoblast differentiation. A suggestive significance threshold of p < 1 × 10⁻⁴ was chosen, as it is sufficiently stringent to reveal differential cell type enrichment (Figure 1B) while still allowing 165 markers to meet this threshold. The results when taken together implicate the potential Wnt signaling involvement in PsA development (Goldring and Goldring, 2007; Gudjonsson et al., 2010). Our approach makes it possible to go beyond the information available from genome-wide significant loci to identify testable mechanisms by which suggestive significant loci may impact the development of disease.
Dividing genetic markers into distinct loci, from which to identify gene candidates, can be challenging due to their overlapping genetic position. To address this, we performed cell type enrichment analysis on the marker rather than locus level (Figure 1B), then divided markers into loci according to their genetic distance. To evaluate the impact linkage disequilibrium (LD) might have on these results, we clustered the 165 suggestive significant markers according to their LD, estimated using PLINK 1.9 (Chang et al., 2015) on samples of European ancestry from the 1000 Genomes Project (The 1000 Genomes Project Consortium, Auton et al., 2015) by applying Ward’s criteria (Murtagh and Legendre, 2014) for hierarchical clustering (ward.D2 in R’s hclust package) with an r2 threshold of 0.9. Comparing the enrichment of cell types in these clusters against randomly sampled loci, chondrogenic cells (p = 5.0 × 10⁻⁴) and osteoblasts (p = 3.6 × 10⁻²) again indicated enrichment.
Existing functional annotations provide further information for candidate gene prioritization: genes from the top loci (RUNX1, FUT8, and CTNNAL1) are known to be involved in Wnt signaling; and in 11q14.2, PRSS23 is a target of a cis-eQTL (p = 1.22 × 10⁻⁷) in whole blood (Võsa et al., 2018), and another gene in this locus (FZD4) was the most significantly upregulated gene (FC = 4.81) in osteoblast differentiated cells. An eQTL for FZD4 is available for a marker in LD with the locus (r2 = 0.76) in T-cells from umbilical cord (Dimas et al., 2009), but there is no direct cis-eQTL in whole blood. Among arthritis drugs, PRSS23 is only targeted by cyclosporine, whereas FZD4 is also targeted by dexamethasone, diclofenac, and indomethacin. However, a recent study using crisprQTL mapping (Gasperini et al., 2018) found the median distance between enhancers and their target gene to be 34.3 kb (PRSS23 is 5 kb away, whereas FZD4 is 160 kb away), so further work would be needed to assess the true causal gene in this case.
Another gene in the same locus as CTNNAL1 is KLF4, which has been found to interact with TNF-α in rheumatoid arthritis (Choi et al., 2018). However, unlike CTNNAL1 (FC = 0.633), KLF4 is not significantly differentially expressed in osteoblasts, and the suggestive significant markers in this locus do not overlap any active enhancer marks for T-cells (in which TNF-α is produced). Similarly, AMPD2 is in the same locus as GSTM1 (157 kb vs. 80 kb from the lead marker) and it is a gene target for the biologic drug tofacitinib, yet it is not differentially expressed in differentiated osteoblasts. When identifying genes from (genome-wide or suggestive significant) loci to design follow-up experiments to understand the potential biological mechanisms, it is important to consider all the information available.
Biologic drugs are increasingly being prescribed for psoriatic arthritis and it is worth mentioning that (with possible exception of tofacitinib for AMPD2) none of the drugs targeting the genes we identify are biologics. The loci (and hence the genes) we present were selected according to their overlap of H3K27ac marks for osteoblasts/chondrocytes, due to their enrichment among suggestive significant markers, and biologics (e.g., anti-TNF/IL23) target the immune system with high precision. It is important to note drugs mentioned in this paper are not necessarily more effective for PsA and further (preferably in vitro) studies would be necessary to evaluate the differential effect for drugs in skin and joints. Instead, we identified the drugs that target each gene as an independent means to verify the plausibility of those genes acting in mechanisms which differentiate PsA from PsC.
Epigenomic information has previously been used to suggest causal variants for autoimmune diseases (Farh et al., 2015) and cancer (Han et al., 2015). Recently, an approach was proposed to identify pairs of potentially interacting variants, in active enhancers and gene promoters, respectively (Manduchi et al., 2018). These approaches make it possible to prioritize genetic markers and genes, but it can be difficult (in the absence of further experiments) to know whether the suggested markers and genes are correct. Our study goes further by investigating available pharmacogenomic and expression data to provide independent information available through epigenomics and suggest potential ways in which the loci identified may be involved together in biological mechanisms for pathogenesis.
Links for Databases
DrugBank: https://www.drugbank.ca/ (March 2019).
Comparative Toxicogenomics Database: http://ctdbase.org/.
PharmGKB: https://www.pharmgkb.org/ (the March 2016 version was used in this paper).
eQTL database: http://eqtlgen.org/.
Data on osteoblast differentiation: https://www.ncbi.nlm.nih.gov/geo/query/acc.cgi?acc=GSE80614.
Author Contributions
LT designed the study and directed the analysis. JE coordinated and led the psoriasis genetic cohorts. MP conducted the analysis, and LT, KR, SC, and ZH provided bioinformatics or statistical analysis support. JV, TT, JG, JK, VC, PR, DG, RN, LT, and JE provided biological inferences or interpretation of the results, or contributed to the collection/data coordination of the samples in the cohorts. MP and LT wrote the first draft of the manuscript, and every author has reviewed the work.
Conflict of Interest Statement
JG serves as Advisory Board for Novartis, AbbVie and MiRagen, and has received research support from AbbVie, SunPharma, and Genentech. JK serves on an advisory board for AstraZeneca. The remaining authors declare that the research was conducted in the absence of any commercial or financial relationships that could be construed as a potential conflict of interest.
Acknowledgments
We thank the reviewers for their valuable and insightful comments and suggestions which have improved the manuscript.
Footnotes
Funding. This work was supported by the Arthritis National Research Foundation and the National Psoriasis Foundation (LT), and awards from the National Institutes of Health (R01AR042742, R01AR050511, R01AR054966, R01AR063611, R01AR065183 to JE; K01AR072129 to LT). LT was also supported by the Dermatology Foundation. LT, PS, TT, JG, JV, RN, and JE were supported by the Dawn and Dudley Holmes Foundation and the Babcock Memorial Trust. DG and VC were supported by the Krembil Foundation. JG was supported by the National Institute of Health (AR069071 and AR060802) and the Taubman Medical Research Institute. JE was supported by the Ann Arbor Veterans Affairs Hospital. JK was supported by the National Institutes of Health R01AR071384, the Doris Duke Charitable Foundation Clinician Scientist Development Award, the Rheumatology Research Foundation and the Taubman Medical Research Institute Parfet Emerging Scholar Award.
Supplementary Material
The Supplementary Material for this article can be found online at: https://www.frontiersin.org/articles/10.3389/fgene.2019.00304/full#supplementary-material
References
- Alamanos Y., Voulgari P. V., Drosos A. A. (2008). Incidence and prevalence of psoriatic arthritis: a systematic review. J. Rheumatol. 35 1354–1358. [PubMed] [Google Scholar]
- Barrett T., Wilhite S. E., Ledoux P., Evangelista C., Kim I. F., Tomashevsky M., et al. (2013). NCBI GEO: archive for functional genomics data sets–update. Nucleic Acids Res. 41 D991–D995. 10.1093/nar/gks1193 [DOI] [PMC free article] [PubMed] [Google Scholar]
- Boyle E. A., Li Y. I., Pritchard J. K. (2017). An expanded view of complex traits: from polygenic to omnigenic. Cell 169 1177–1186. 10.1016/j.cell.2017.05.038 [DOI] [PMC free article] [PubMed] [Google Scholar]
- Chandran V., Cook R. J., Edwin J., Shen H., Pellett F. J., Shanmugarajah S., et al. (2010). Soluble biomarkers differentiate patients with psoriatic arthritis from those with psoriasis without arthritis. Rheumatology 49 1399–1405. 10.1093/rheumatology/keq105 [DOI] [PubMed] [Google Scholar]
- Chang C., Chow C., Tellier L., Vattikuti S., Purcell S., Lee J. (2015). Second-generation PLINK: rising to the challenge of larger and richer datasets. Gigascience 4:7. 10.1186/s13742-015-0047-8 [DOI] [PMC free article] [PubMed] [Google Scholar]
- Chimge N. O., Little G. H., Baniwal S. K., Adisetiyo H., Xie Y., Zhang T., et al. (2016). RUNX1 prevents oestrogen-mediated AXIN1 suppression and beta-catenin activation in ER-positive breast cancer. Nat. Commun. 7:10751. 10.1038/ncomms10751 [DOI] [PMC free article] [PubMed] [Google Scholar]
- Choi S., Lee K., Jung H., Park N., Kang J., Nam K. H., et al. (2018). Kruppel-like factor 4 positively regulates autoimmune arthritis in mouse models and rheumatoid arthritis in patients via modulating cell survival and inflammation factors of fibroblast-like synoviocyte. Front. Immunol. 9:1339. 10.3389/fimmu.2018.01339 [DOI] [PMC free article] [PubMed] [Google Scholar]
- Davis A. P., Grondin C. J., Lennon-Hopkins K., Saraceni-Richards C., Sciaky D., King B. L., et al. (2015). The comparative toxicogenomics database’s 10th year anniversary: update 2015. Nucleic Acids Res. 43 D914–D920. 10.1093/nar/gku935 [DOI] [PMC free article] [PubMed] [Google Scholar]
- Dimas A. S., Deutsch S., Stranger B. E., Montgomery S. B., Borel C., Attar-Cohen H., et al. (2009). Common regulatory variation impacts gene expression in a cell type-dependent manner. Science 325 1246–1250. 10.1126/science.1174148 [DOI] [PMC free article] [PubMed] [Google Scholar]
- Ellinghaus E., Ellinghaus D., Stuart P. E., Nair R. P., Debrus S., Raelson J. V., et al. (2010). Genome-wide association study identifies a psoriasis susceptibility locus at TRAF3IP2. Nat. Genet. 42 991–995. 10.1038/ng.689 [DOI] [PMC free article] [PubMed] [Google Scholar]
- Farh K. K., Marson A., Zhu J., Kleinewietfeld M., Housley W. J., Beik S., et al. (2015). Genetic and epigenetic fine mapping of causal autoimmune disease variants. Nature 518 337–343. 10.1038/nature13835 [DOI] [PMC free article] [PubMed] [Google Scholar]
- Gasperini M., Hill A., McFaline-Figueroa J. L., Martin B., Trapnell C., Ahituv N., et al. (2018). CrisprQTL mapping as a genome-wide association framework for cellular genetic screens. bioRXiv [Preprint]. 10.1101/314344 [DOI] [Google Scholar]
- Goldring S. R., Goldring M. B. (2007). Eating bone or adding it: the Wnt pathway decides. Nat. Med. 13 133–134. 10.1038/nm0207-133 [DOI] [PubMed] [Google Scholar]
- Greb J. E., Goldminz A. M., Elder J. T., Lebwohl M. G., Gladman D. D., Wu J. J., et al. (2016). Psoriasis. Nat. Rev. Dis. Primers 2:16082. 10.1038/nrdp.2016.82 [DOI] [PubMed] [Google Scholar]
- Gudjonsson J. E., Johnston A., Stoll S. W., Riblett M. B., Xing X., Kochkodan J. J., et al. (2010). Evidence for altered Wnt signaling in psoriatic skin. J. Invest. Dermatol. 130 1849–1859. 10.1038/jid.2010.67 [DOI] [PMC free article] [PubMed] [Google Scholar]
- Han Y., Hazelett D. J., Wiklund F., Schumacher F. R., Stram D. O., Berndt S. I., et al. (2015). Integration of multiethnic fine-mapping and genomic annotation to prioritize candidate functional SNPs at prostate cancer susceptibility regions. Hum. Mol. Genet. 24 5603–5618. 10.1093/hmg/ddv269 [DOI] [PMC free article] [PubMed] [Google Scholar]
- Jansen P. R., Watanabe K., Stringer S., Skene N., Bryois J., Hammerschlag A. R., et al. (2018). Genome-wide analysis of insomnia (N = 1,331,010) identifies novel loci and functional pathways. bioRXiv [Preprint]. 10.1101/214973 [DOI] [PubMed] [Google Scholar]
- Kurimoto A., Kitazume S., Kizuka Y., Nakajima K., Oka R., Fujinawa R., et al. (2014). The absence of core fucose up-regulates GnT-III and Wnt target genes: a possible mechanism for an adaptive response in terms of glycan function. J. Biol. Chem. 289 11704–11714. 10.1074/jbc.M113.502542 [DOI] [PMC free article] [PubMed] [Google Scholar]
- Mahajan A., Taliun D., Thurner M., Robertson N. R., Torres J. M., Rayner N. W., et al. (2018). Fine-mapping type 2 diabetes loci to single-variant resolution using high-density imputation and islet-specific epigenome maps. Nat. Genet. 50 1505–1513. 10.1038/s41588-018-0241-6 [DOI] [PMC free article] [PubMed] [Google Scholar]
- Manduchi E., Williams S. M., Chesi A., Johnson M. E., Wells A. D., Grant S. F. A., et al. (2018). Leveraging epigenomics and contactomics data to investigate SNP pairs in GWAS. Hum. Genet. 137 413–425. 10.1007/s00439-018-1893-0 [DOI] [PMC free article] [PubMed] [Google Scholar]
- Merdek K. D., Nguyen N. T., Toksoz D. (2004). Distinct activities of the alpha-catenin family, alpha-catulin and alpha-catenin, on beta-catenin-mediated signaling. Mol. Cell. Biol. 24 2410–2422. 10.1128/mcb.24.6.2410-2422.2004 [DOI] [PMC free article] [PubMed] [Google Scholar]
- Murtagh F., Legendre P. (2014). Ward’s hierarchical agglomerative clustering method: which algorithms implement ward’s criterion? J. Classif. 31 274–295. 10.1007/s00357-014-9161-z [DOI] [Google Scholar]
- Nair R. P., Duffin K. C., Helms C., Ding J., Stuart P. E., Goldgar D., et al. (2009). Genome-wide scan reveals association of psoriasis with IL-23 and NF-kappaB pathways. Nat. Genet. 41 199–204. 10.1038/ng.311 [DOI] [PMC free article] [PubMed] [Google Scholar]
- Okada Y., Wu D., Trynka G., Raj T., Terao C., Ikari K., et al. (2014). Genetics of rheumatoid arthritis contributes to biology and drug discovery. Nature 506 376–381. 10.1038/nature12873 [DOI] [PMC free article] [PubMed] [Google Scholar]
- Patrick M. T., Stuart P. E., Raja K., Gudjonsson J. E., Tejasvi T., Yang J., et al. (2018). Genetic signature to provide robust risk assessment of psoriatic arthritis development in psoriasis patients. Nat. Commun. 9:4178. 10.1038/s41467-018-06672-6 [DOI] [PMC free article] [PubMed] [Google Scholar]
- Raja K., Patrick M., Elder J. T., Tsoi L. C. (2017). Machine learning workflow to enhance predictions of Adverse Drug Reactions (ADRs) through drug-gene interactions: application to drugs for cutaneous diseases. Sci. Rep. 7:3690. 10.1038/s41598-017-03914-3 [DOI] [PMC free article] [PubMed] [Google Scholar]
- Ritchie M. E., Phipson B., Wu D., Hu Y., Law C. W., Shi W., et al. (2015). limma powers differential expression analyses for RNA-sequencing and microarray studies. Nucleic Acids Res. 43:e47. 10.1093/nar/gkv007 [DOI] [PMC free article] [PubMed] [Google Scholar]
- Stuart P. E., Nair R. P., Tsoi L. C., Tejasvi T., Das S., Kang H. M., et al. (2015). Genome-wide association analysis of psoriatic arthritis and cutaneous psoriasis reveals differences in their genetic architecture. Am. J. Hum. Genet. 97 816–836. 10.1016/j.ajhg.2015.10.019 [DOI] [PMC free article] [PubMed] [Google Scholar]
- The 1000 Genomes Project Consortium. Auton A., Brooks L. D., Durbin R. M., Garrison E. P., Kang H. M. (2015). A global reference for human genetic variation. Nature 526 68–74. 10.1038/nature15393 [DOI] [PMC free article] [PubMed] [Google Scholar]
- Thorn C. F., Klein T. E., Altman R. B. (2013). “PharmGKB: the pharmacogenomics knowledge base,” in Pharmacogenomics: Methods and Protocols, eds Innocenti F., van Schaik R. H. N. (Totowa, NJ: Humana Press; ), 311–320. 10.1007/978-1-62703-435-7_20 [DOI] [PMC free article] [PubMed] [Google Scholar]
- Tsoi L. C., Patrick M. T., Elder J. T. (2018). Research techniques made simple: using genome-wide association studies to understand complex cutaneous disorders. J. Invest. Dermatol. 138 e23–e29. 10.1016/j.jid.2018.01.004 [DOI] [PMC free article] [PubMed] [Google Scholar]
- Tsoi L. C., Spain S. L., Knight J., Ellinghaus E., Stuart P. E., Capon F., et al. (2012). Identification of 15 new psoriasis susceptibility loci highlights the role of innate immunity. Nat. Genet. 44 1341–1348. 10.1038/ng.2467 [DOI] [PMC free article] [PubMed] [Google Scholar]
- Tsoi L. C., Stuart P. E., Tian C., Gudjonsson J. E., Das S., Zawistowski M., et al. (2017). Large scale meta-analysis characterizes genetic architecture for common psoriasis-associated variants. Nat. Commun. 8:15382. 10.1038/ncomms15382 [DOI] [PMC free article] [PubMed] [Google Scholar]
- van de Peppel J., Strini T., Tilburg J., Westerhoff H., van Wijnen A. J., van Leeuwen J. P. (2017). Identification of three early phases of cell-fate determination during osteogenic and adipogenic differentiation by transcription factor dynamics. Stem Cell Rep. 8 947–960. 10.1016/j.stemcr.2017.02.018 [DOI] [PMC free article] [PubMed] [Google Scholar]
- Võsa U., Claringbould A., Westra H.-J., Bonder M. J., Deelen P., Zeng B., et al. (2018). Unraveling the polygenic architecture of complex traits using blood eQTL meta-analysis. bioRXiv [Preprint]. 10.1101/447367 [DOI] [Google Scholar]
- Willer C. J., Li Y., Abecasis G. R. (2010). METAL: fast and efficient meta-analysis of genomewide association scans. Bioinformatics 26 2190–2191. 10.1093/bioinformatics/btq340 [DOI] [PMC free article] [PubMed] [Google Scholar]
- Wishart D. S., Feunang Y. D., Guo A. C., Lo E. J., Marcu A., Grant J. R., et al. (2018). DrugBank 5.0: a major update to the DrugBank database for 2018. Nucleic Acids Res. 46 D1074–D1082. 10.1093/nar/gkx1037 [DOI] [PMC free article] [PubMed] [Google Scholar]
Associated Data
This section collects any data citations, data availability statements, or supplementary materials included in this article.