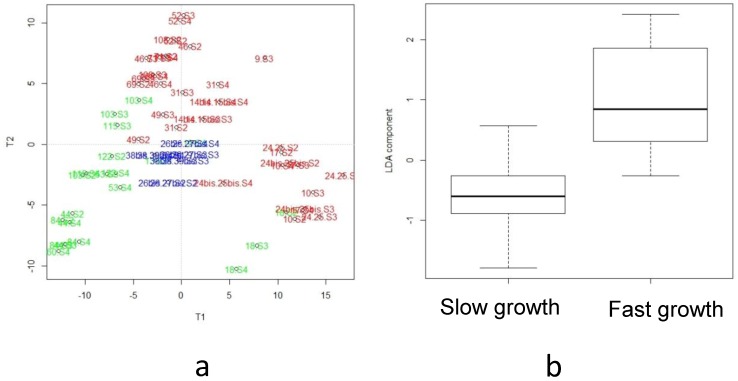
Figure 2.
Analysis of Variance (AoV)-PLS and linear discriminant analysis (LDA) models based on the LC-ESI+-HRMS metabolomics profiles of human preterm milk on the factor weight Z-score (discharge-birth): AoV-PLS score plot with 56% of variance (R2Y = 34%) on components 1–2 (a) and LDA (built on components of AoV-PLS) with a p-value = 0) (b). Breast milk provided to preterm infants who experienced “faster” (green) or “slower” (red) growth and to twin infants with discordant growth rate, one twin with high growth rate and the other one with low growth rate, (blue).

