Abstract
The prevalence of mental health disorders such as depression is high. Depression is a multifactorial disorder and its underlying mechanisms remain unclear. Competing endogenous RNA (ceRNA) regulation has been reported to serve important roles in human disease. In the present study, ceRNA networks for depression and the corresponding normal physiological states were constructed. Further analysis of the ceRNA networks revealed that ceRNA regulation may be important for depression. Hub ceRNAs including high mobility group nucleosomal binding domain 3, peroxisome proliferator-activated receptor-γ coactivator 1β and leukemia inhibitory factor receptor-α were associated with depression. A common core ceRNA network was identified by comparison analysis. Functional analysis suggested that these ceRNAs may be implicated in depression. Differential expression analysis revealed that ceRNAs in the obtained ceRNA interaction networks were significantly enriched with significantly differentially expressed genes. A total of 8 key functional modules for depression were identified, and small target molecules were screened. ceRNA protocadherin-α subfamily C2 in module 1 and ceRNA Cyclin-dependent kinase 6 in module 3 were reported to be implicated in the occurrence and development of depressive disorders. Thus, the present analysis may provide insight into the pathogenesis of depression and improve its treatment.
Keywords: depression, competing endogenous RNA, network
Introduction
Depression has become one of the most disabling psychiatric conditions (1,2). It is a multifactorial disorder that may involve changes in gene expression and regulation. Previous studies have focused on the role of genetic factors in the development of depression, and several genetically altered loci have been identified (3,4). However, the pathogenesis of depression remains unclear.
Salmena et al (5) proposed a novel RNA regulation mechanism involving competitive endogenous RNA (ceRNA) regulation, whereby RNA transcripts crosstalk with one another via decreasing targeting concentrations of microRNAs (miRNAs), which suppresses other RNAs that share common miRNA response elements (5). Currently, several studies have demonstrated that ceRNA regulation serves critical roles in human disease, including cancer and rheumatoid arthritis (6–8). For example, phosphatase and tensin homolog (PTEN), which is a tumor suppressor gene, may be regulated by ceRNA activity in multiple tumors (9,10). RNA-Sequencing (Seq) technology has allowed for the identification of long non-coding RNAs (lncRNAs); lncRNAs may act as ceRNAs in human diseases. For example, high mobility group AT-hook 1 (HMGA1) pseudogenes may act as ceRNA decoys. H19 affects HMGA1 expression by attenuating the suppression of let-7, thereby promoting pancreatic cancer metastasis (11). Small nucleolar RNA host gene 6-003 may act as a ceRNA to promote the progression of hepatocellular carcinoma (12). Zhou et al (13) constructed a breast cancer-specific ceRNA network based on the mRNA expression profile. Furthermore, the integrative analyses of Du et al (14) uncovered a lncRNA-mediated sponge regulatory network in prostate cancer. Previous studies have focused on investigating the ceRNA regulation in cancer. Jiang et al (15) revealed functional lncRNAs in rheumatoid arthritis based on the ceRNA theory. Lai et al (16) demonstrated that HOX transcript antisense RNA acts as a ceRNA and may regulate PTEN expression by inhibiting miR-19 in cardiac hypertrophy. Recently, a previous study revealed that have revealed that noncoding RNAs serve important roles in depression (17). However, a systematical dissection of the ceRNA network in depression has not been performed.
In the present study, a ceRNA network was constructed using samples obtained from non-psychiatric individuals and patients with major depression. Further analysis identified critical ceRNA modules in depression. Such systematic construction and dissection of the ceRNA regulatory network in depression may aid to elucidate the underlying pathogenic mechanisms involved in depression.
Materials and methods
RNA-seq expression data
RNA-Seq data were downloaded from the Gene Expression Omnibus (GEO) database (18). The accession number was GSE42546 (2), which refers to a study on the transcriptome profiling of human hippocampus dentate gyrus granule cells in mental illness. The expression profile contains 79 samples of patients with mental illness including 17 patients with schizophrenia, 16 patients with bipolar disorder, 17 patients with major depression and 29 non-psychiatric controls. The focus of the present study was on depression, therefore the data on 17 patients with major depression and 29 non-psychiatric control samples were used for further analysis. RNAs (mRNAs and lncRNAs) involved the expression profile were unified as genes.
Construction of the ceRNA regulation network
The ceRNA network was constructed based on the gene-miRNA interactions and the RNA expression data. Firstly, the lncRNA-miRNA and gene-miRNA interaction data were downloaded from starBase V2.0 database (starbase.sysu.edu.cn/) (19). A total of 10,212 interactions from 1,065 lncRNA genes and 277 miRNAs, and 606,408 interactions from 13,801 mRNA genes and 386 miRNAs were obtained. These lncRNA-miRNA and gene-miRNA interactions were combined and 616,620 interactions between 386 miRNAs and 14,816 genes were obtained. Candidate ceRNA pairs were constructed by screening all possible RNA-RNA pairs. RNA pairs that had at least 3 common miRNAs and a Jacquard coefficient of shared miRNAs between two RNAs of >0.2 were identified as candidate ceRNA pairs. In addition, the ceRNA regulatory pair was identified based on the expression data obtained from 29 non-psychiatric controls and 17 patients with major depression. To ensure the volatility of expression data and to obtain reliable associations, genes with zero expression values were removed in >50% samples. Finally, a total of 14,443 genes were retained in the expression profile. At least 9 samples could lead to statistically significant results. A total of 2 ceRNAs were required to exhibit positively correlated expression using a Pearson correlation coefficient of >0.4 and an adjusted significance P-value of <0.05. Correlation analysis was evaluated using the Fisher's method in the Weighted Correlation Network Analysis package (horvath.genetics.ucla.edu/html/CoexpressionNetwork/Rpackages/WGCNA/) (20). The identified ceRNA pairs were combined and the ceRNA regulatory networks were then constructed.
Differential expression analysis
To ensure the accuracy of differential gene recognition, a t-test was conducted and fold-change values were used (t-test, P-value <0.05; fold-change values >1.5 or <0.667). The t-test was conducted and the fold-change value for each gene was calculated using R 2.15.3 (cran.r-project.org). P<0.05 was considered to indicate a statistically significant difference.
Functional enrichment analysis
The enrichment analysis was performed to investigate the function of genes specific for the ceRNA networks in the normal and depression states. In this process, the Database for Annotation, Visualization and Integrated Discovery (DAVID v6.8) tool (david.ncifcrf.gov) (21) was used; briefly, genes specific for the ceRNA networks in the normal and depression states were inputted as gene lists. From the results page, the Kyoto Encyclopedia of Genes and Genomes (KEGG) pathways (www.genome.jp/kegg/) (22) chart was downloaded for further analysis.
Identifying ceRNA modules
The MCODE v1.4.2 plugin in Cytoscape v3.4.0 (cytoscape.org) (23) was used to examine the closely associated ceRNA modules for normal- and depression-associated networks. The default selection for MCODE was used.
Identifying key modules
Modules that were significantly enriched with differentially expressed genes were identified as key modules using the Gene Set Enrichment Analysis (GSEA) method (24) and hypergeometric test. The GSEA method was performed using the GSEA 1.0 R script (24).
Screening of drug-like small molecules
The CMAP (build 02) database (www.cmap-software.com) (25) collects genome-wide transcriptional expression data from cultured human cells treated with bioactive small molecules. A total of >6,000 gene expression profiles representing 1,309 compounds were downloaded. For each compound, the treatment group was compared with the control group in order to identify genes associated with the compound intervention under different thresholds (fold-change values >1.5 or fold-change values <0.667 fold-change values >2 or fold-change values <0.5). Genes with fold-change values of >1.5 or <0.667 were considered to be genes associated with the compound intervention according to the fold-change method. In addition, a more stringent threshold (fold-change values of >2 or <0.5) was also used to explore the reproducibility of the detection results.
Results and Discussion
Properties of the ceRNA network in depression
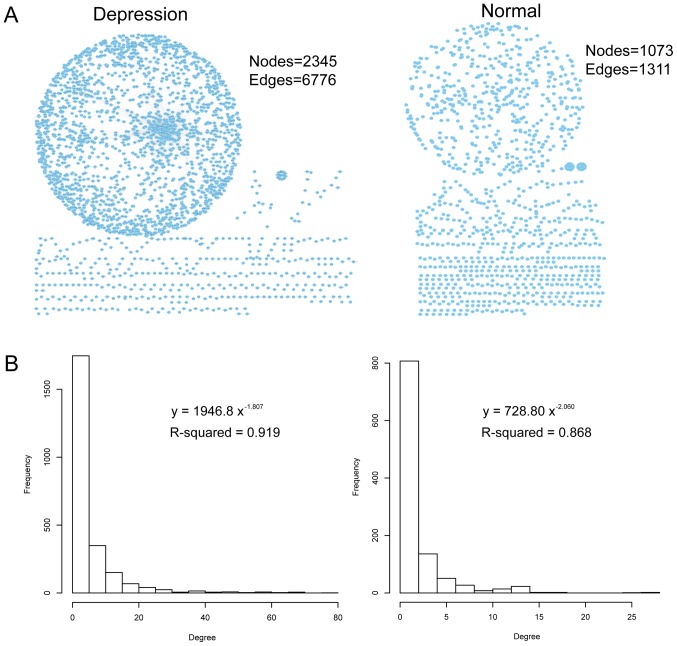
The ceRNA regulatory network was constructed using data obtained from the GEO database from 17 patients with major depression and 29 non-psychiatric control samples. A total of 1,311 ceRNA associations between 1,073 genes, and 6,776 ceRNA associations between 2,345 genes were identified under normal control and disease states, respectively (Fig. 1A). Then, the degree distribution of the ceRNA networks was examined (with degree defined as the number of edges connected to a certain node; Fig. 1B). The majority of ceRNAs exhibited a low connectivity, whereas a few ceRNAs exhibited a relatively high connectivity. Further examination of the degree distribution of the ceRNA networks demonstrated that the degree of these two ceRNA networks was subjected to a power-law distribution with a slope of −2.06 and R2=0.868 for the ceRNA control network, and a slope of −1.807 and R2=0.919 for the ceRNA network of depression (Fig. 1B). This suggests that ceRNA networks in depression are similar to the majority of biological networks. However there are a number of core nodes that maintain the ceRNA network organizational structure and distinguish it from random networks.
Figure 1.
ceRNA network analysis. (A) ceRNA networks in depression (left-hand panel) and normal (right-hand panel) states. Nodes represent genes and two genes that were competitively regulated with each other were connected with an edge. (B) The degree distribution for depression (left-hand panel) and normal (right-hand panel) ceRNA networks. ceRNA, competitive endogenous RNA.
Next, the core nodes of the ceRNA networks were examined. Firstly, the hub nodes (defined as the nodes with a degree of >5 and as the top 5%) for each ceRNA network were identified. A total of 53 hub nodes in the ceRNA control network and 121 hub nodes in the disease-associated ceRNA network were identified. Table I presents the top 30 hub nodes with regard to degree number in the normal and disease networks. Further exploration of these hub nodes demonstrated that a number of these have been reported to be associated with depression. For example, the amount of mitochondrial DNA (mtDNA) has been implicated in stress-associated diseases, including major depressive disorder (26). Cyclin-dependent kinase (CDK)-6, a hub gene in the normal ceRNA network, has been identified as a novel molecule involved in the control of mtDNA (26). High mobility group nucleosomal binding domain 3 (HMGN3), peroxisome proliferator-activated receptor-γ coactivator 1β (PPARGC1B) and leukemia inhibitory factor receptor-α (LIFR) were revealed to be hub ceRNAs in the depression-associated ceRNA network in this study. The Hmgn3 gene exhibits differential expression between anxiety-associated behavior and control mouse models (27). Kripke et al (28) suggested that PPARGC1B polymorphisms may be associated with bipolar disorder. Furthermore, Kripke et al also weakly replicated the association between depression and PPARGC1B rs7732671 in another study (29). Additionally, previous research has indicated that plasma tryptophan levels are decreased during pregnancy and puerperium, as well as in patients with major depression and inflammation (30). According to a study by Maes et al (30) LIFR is significantly associated with the changes in the tryptophan/competing amino acid ratio. Therefore, these hub ceRNAs, including HMGN3, PPARGC1B and LIFR, are likely associated with depression, and their regulation may serve important roles in the initiation and progression of depression.
Table I.
Top 30 hub nodes in the normal and depression competitive endogenous RNA networks.
| A, Normal network | |
|---|---|
| Node name | Degree |
| ATMIN | 27 |
| RBM12B | 27 |
| RAB11FIP2 | 25 |
| FOXJ2 | 17 |
| LOC374443 | 17 |
| KLF3 | 16 |
| ARMC8 | 15 |
| C2orf69 | 14 |
| PCDHGB7 | 13 |
| PCDHGA5 | 13 |
| PCDHGA12 | 13 |
| PCDHGB4 | 13 |
| PCDHGB6 | 13 |
| PCDHGA10 | 13 |
| PCDHGA9 | 13 |
| PCDHGB5 | 13 |
| PCDHGA8 | 13 |
| PCDHGB2 | 13 |
| PCDHGA6 | 13 |
| PCDHGB3 | 13 |
| PCDHGA7 | 13 |
| PCDHGA11 | 13 |
| PCDHA7 | 13 |
| PCDHA6 | 13 |
| PCDHA5 | 13 |
| PCDHA8 | 13 |
| TTC32 | 13 |
| C3orf58 | 13 |
| PNRC1 | 13 |
| SATB1 | 13 |
| B, Depression network | |
| Node name | Degree |
| GOLGA7 | 78 |
| MED8 | 70 |
| C3orf23 | 70 |
| 8-Sep | 69 |
| MTF2 | 68 |
| CPOX | 66 |
| HMGN3 | 66 |
| FAM199X | 65 |
| CTPS | 64 |
| GPR180 | 62 |
| ADSS | 59 |
| TNKS2 | 57 |
| MSL1 | 57 |
| ZMYM1 | 57 |
| KLF3 | 57 |
| C18orf25 | 56 |
| TXNRD1 | 56 |
| C14orf28 | 55 |
| CAND1 | 55 |
| TNFAIP1 | 51 |
| COG3 | 50 |
| IL15 | 50 |
| CHD7 | 50 |
| ZNF236 | 49 |
| RAB14 | 49 |
| ZBTB41 | 48 |
| RBM24 | 47 |
| CLDND1 | 46 |
| TAOK3 | 45 |
| ZDHHC9 | 44 |
Comparison of the ceRNA regulation network under normal physiological and disease states
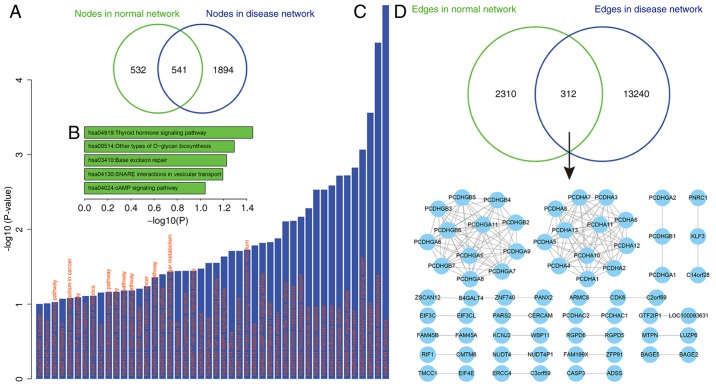
In order to further understand ceRNA regulation in depression, the ceRNA networks under normal physiological and disease states were compared. Firstly, the nodes between the ceRNA networks were compared, and it was revealed that half of the ceRNAs (50.4%) in the normal ceRNA network were also involved in the disease-associated ceRNA network, whereas 532 ceRNA nodes (49.6%) and up to 1,894 ceRNAs (77.7%) were specifically involved in the normal and disease networks, respectively (Fig. 2A). This suggests that the initiation of depression may be associated with these ceRNA activities. Next, the function of these specific ceRNAs in the normal and depression states was investigated. Functional enrichment analysis for these ceRNA sets (P<0.05) was performed to identify significantly enriched KEGG pathways (22) using the DAVID tool (21). A total of 532 ceRNA nodes that were specifically involved in the normal ceRNA network were significantly enriched for the ‘thyroid hormone signaling pathway’ (P<0.05; Fig. 2B). Furthermore, four pathways were enriched with a significant (P<0.01), including ‘other types of O-glycan biosynthesis’ (P=0.051), ‘base excision repair’ (P=0.059), ‘soluble N-ethylmaleimide-sensitive fusion protein-attachment protein receptors interactions in vesicular transport’ (P=0.064) and ‘cyclic adenosine monophosphate signaling pathway’ (P=0.091). These 1,894 ceRNAs, which were specific for the depression network, were enriched in up to 31 pathways (P<0.05; Fig. 2C). These results indicate that these ceRNAs may regulate a wide variety of biological functions. In addition, a number of these pathways may be associated with depression, including ‘circadian rhythm’ (31,32) and ‘insulin resistance’ (33).
Figure 2.
Comparison of the ceRNA networks. (A) Comparison of the genes (ceRNAs) involved in the normal and depression networks. (B and C) Functional analysis of the ceRNAs. The x-axis represents the -log10 (P-value): (B) 5 pathways were annotated by ceRNAs specifically presented in the normal ceRNA network, and (C) 46 pathways (31 of which were significant) were annotated by ceRNAs specifically presented in the depression-associated ceRNA network. (D) Comparison of the edges (regulations) involved in the normal and depression networks (upper panel) and the core subnetwork shared by the two ceRNA networks (bottom panel). ceRNA, competitive endogenous RNA.
According to the results of the present study, only a small fraction of ceRNA pairs (11.9%) were shared between the normal and disease networks. This indicates that the differential regulation of ceRNAs may be implicated in depression. Firstly, common ceRNA pairs were examined and it was revealed that these 312 shared ceRNA pairs of the ceRNA networks may form a core subnetwork (Fig. 2D), which mainly contains protocadherin (PCDH) family members. Chen et al (34) revealed that conditional deletion of the mouse Pcdh-α (PCDHA) gene cluster was associated with depression-like behaviors, indicating that these ceRNA regulations may serve critical roles in depression. In the present study, ceRNA regulation pairs that were specific for depression were assessed. It was demonstrated that maternally expressed 8 (MEG8; a lncRNA) competitively regulated four genes including integrin subunit β-like 1 (ITGBL1), SSU72 homolog RNA polymerase II C-terminal domain phosphatase, potassium voltage-gated channel modifier subfamily G member 3 (KCNG3) and Acyl-coenzyme A synthetase short chain family member 2 (ACSS2) in depression; MEG8 was not present in the normal ceRNA network. Additionally, it was revealed that miR-16 participates in three of these ceRNA regulations, namely MEG8-ITGBL1, MEG8-KCNG3 and MEG8-ACSS2. miR-16 expression is associated with major depression (35–37) and has therefore been used as a serum biomarker for depression (38). This indicates that the lncRNA MEG8 may be a novel molecule implicated in the pathogenesis of depression. However, further investigation is required.
Expression analysis of ceRNAs
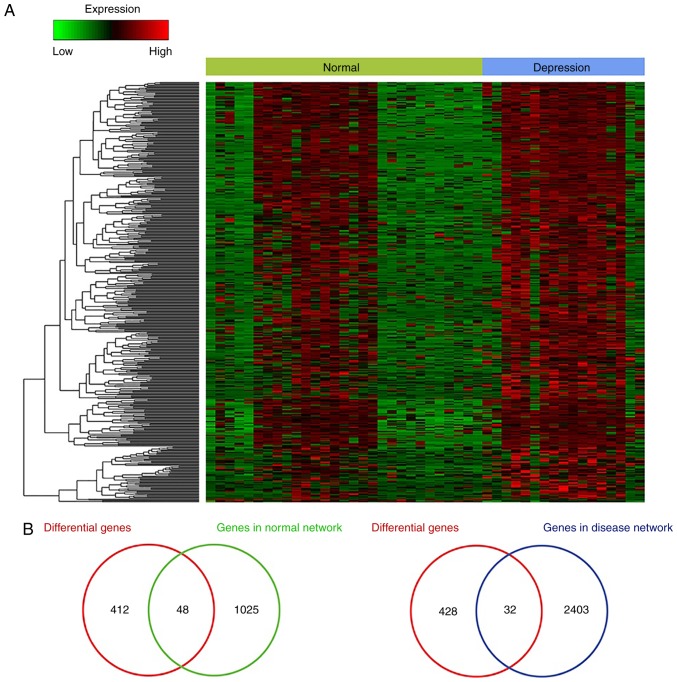
The expression of ceRNAs in the normal and depression-associated networks was examined. Comparing samples from non-psychiatric individuals and patients with major depression identified a total of 460 genes (data not shown). Cluster analysis of these genes was also performed (Fig. 3A). There were 48 and 32 differentially expressed ceRNAs in the normal and depression-associated networks, respectively (Fig. 3B). The fold-change value was >1.5 or <0.667 and the P-value was <0.05. A hypergeometric test was conducted to identify overlapping ceRNAs and it was revealed that the overlap between the differential genes and ceRNAs in the normal networks was significant (P<0.05) (data not shown). This suggests that these differentially expressed ceRNAs may lead to ceRNA dysregulation and thus be involved in the occurrence of depression.
Figure 3.
Heatmap analysis. (A) Expression of the differentially expressed genes. (B) Overlapping genes that were differentially expressed and were involved in the ceRNA normal (left-hand panel) and depression (right-hand panel) associated ceRNA networks. ceRNA, competitive endogenous RNA.
Dissecting ceRNA modules in depression
Compared with the global ceRNA regulatory networks, subnetwork modules may provide key insights into ceRNA regulation. In the present study, ceRNA regulation modules were examined. The MCODE v1.4.2 plugin (23) in Cytoscape v3.4.0 was used to identify ceRNA modules for normal and depression-associated networks. The default selection for MCODE was used. A total of 22 and 62 ceRNA modules were identified for the normal and depression-associated networks, respectively. At least 3 ceRNAs (that were closely associated with each other in the network) were involved in each module.
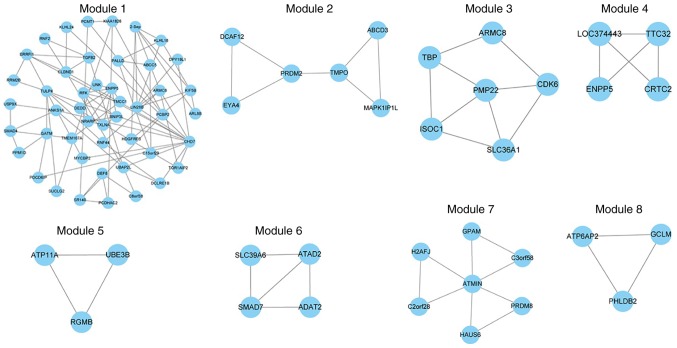
Next, key modules, defined as modules that were significantly enriched with differentially expressed genes, were examined. GSEA (24) and a hypergeometric test were used to assess dysfunctional modules. A total of 4 differential modules were identified using GSEA and 4 were identified via the hypergeometric test (P<0.05; Fig. 4). These modules were dysfunctional in the disease state and several of these ceRNAs, including PCDHA subfamily C2 (PCDHAC2; module 1) and CDK6 (module 3), may be implicated in the occurrence and development of depression. For example, mtDNA is implicated in stress-associated diseases, including major depressive disorder (22). Cai et al (26) reported that CDK6 may regulate mtDNA. Among these 8 key modules, module 1 contained the largest number of ceRNAs and notable complex interactions. Functional analysis of these modules revealed an association with the following pathways: ‘Role of Tob in T-cell activation’, ‘transforming growth factor (TGF)-β signaling pathway’, ‘First Multivalent Nuclear Factor’, ‘Cell Cycle (G1/S Check Point)’ and ‘anaplastic lymphoma kinase’ in cardiac myocytes. Some of these functions have been reported to be associated with depression, such as Mihailova et al who observed low TGF-β1 expression in patients with depression (39). This indicates that other mechanisms may be involved in the pathophysiology of depression.
Figure 4.
GSEA and hypergeometric testing. A total of 8 key dysfunctional modules of depression were identified based on the hypergeometric test (modules 1–4) and the GSEA method (modules 5–8). GSEA, Gene Set Enrichment Analysis.
Potential relevance drug screening for key ceRNA modules
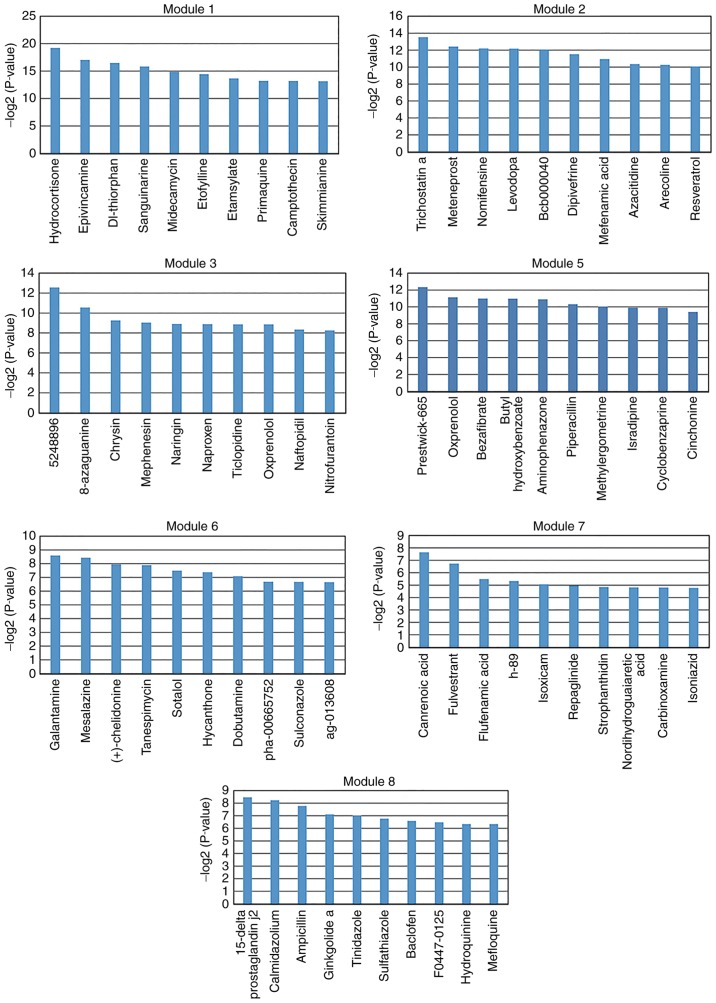
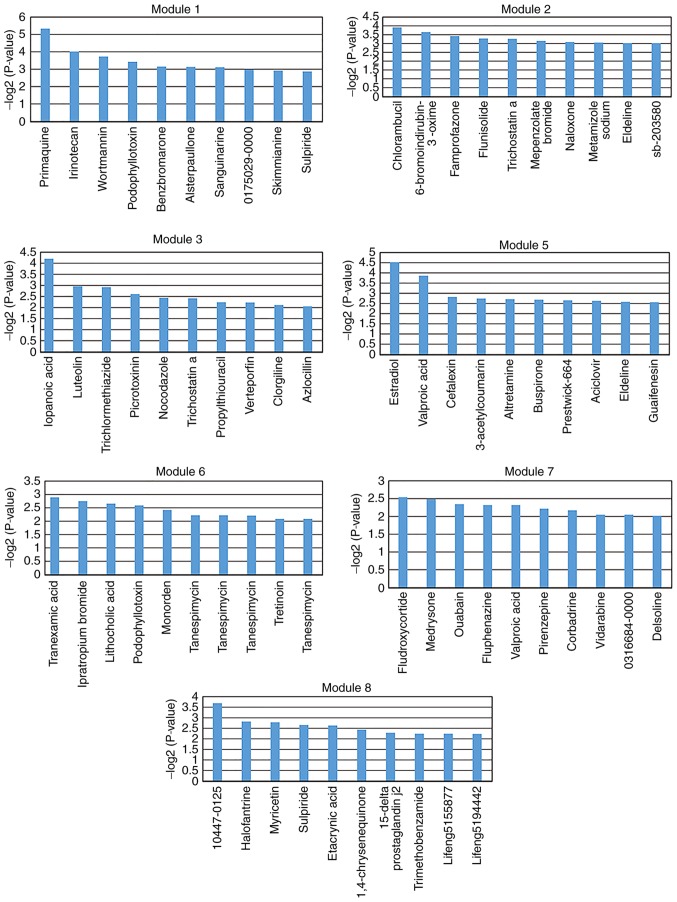
Small molecules may affect the expression of genes and improve disease prognosis. In the present study, small molecules that may regulate dysfunctional key modules in depression were screened. A total of 1,309 small molecules were analyzed and screened using a hypergeometric test. The following thresholds were used for the analysis: Fold-change values >1.5 or <0.667; fold-change values >2 or <0.5. Significantly associated small molecules (P<0.05) were identified for each key module. The top 10 significantly associated small molecules were selected for each key module (except module 4; Figs. 5 and 6). There were no small molecules significantly associated with module 4. These selected small molecules may be associated with improved disease outcomes or lead to side effects. For example, isradipine was screened for module 5 (Fig. 5). A preliminary study by Ostacher et al (40) suggested that isradipine may be safely administrated to patients with bipolar depression. However, further investigation is required.
Figure 5.
Top 10 potentially relevant small molecules with fold-change values >1.5 or <0.667. The top 10 potentially relevant small molecules were screened for each key module (except module 4) based on the threshold of differential genes with a fold-change values >1.5 or <0.667. The y-axis represents the log transformed significant P-value, which was calculated via the hypergeometric test.
Figure 6.
Top 10 potentially relevant small molecules for fold-change values >2 or <0.5. The top 10 potentially relevant small molecules were screened for each key module (except module 4) based on the threshold of differential genes with fold-change values >2 or <0.5. The y-axis represents the log transformed significant P-value, which was calculated via the hypergeometric test.
In conclusion, in the present study a depression-associated ceRNA network was constructed and a systematical analysis of ceRNA regulation in depression was performed. The results of the present study may provide novel perspectives on understanding the pathogenesis and treatment mechanisms of depression.
Acknowledgements
Not applicable.
Funding
No funding was received.
Availability of data and materials
The datasets used and/or analyzed during the current study are available from the corresponding author on reasonable request.
Authors' contributions
JZ and ZY conducted the analyses and interpreted the data. YL was a major contributor in designing the study and writing the manuscript. All authors read and approved the final manuscript.
Ethics approval and consent to participate
Not applicable.
Patient consent for publication
Not applicable.
Competing interests
The authors declare that they have no competing interests.
References
- 1.Sullivan PF, Neale MC, Kendler KS. Genetic epidemiology of major depression: Review and meta-analysis. Am J Psychiatry. 2000;157:1552–1562. doi: 10.1176/appi.ajp.157.10.1552. [DOI] [PubMed] [Google Scholar]
- 2.Kohen R, Dobra A, Tracy JH, Haugen E. Transcriptome profiling of human hippocampus dentate gyrus granule cells in mental illness. Transl Psychiatry. 2014;4:e366. doi: 10.1038/tp.2014.9. [DOI] [PMC free article] [PubMed] [Google Scholar]
- 3.Lacerda-Pinheiro SF, Pinheiro Junior RF, Pereira de Lima MA, Lima da Silva CG, Vieira dos Santos Mdo S, Teixeira Júnior AG, Lima de Oliveira PN, Ribeiro KD, Rolim-Neto ML, Bianco BA. Are there depression and anxiety genetic markers and mutations? A systematic review. J Affect Disord. 2014;168:387–398. doi: 10.1016/j.jad.2014.07.016. [DOI] [PubMed] [Google Scholar]
- 4.Heiman GA, Kamberakis K, Gill R, Kalachikov S, Pedley TA, Hauser WA, Ottman R. Evaluation of depression risk in LGI1 mutation carriers. Epilepsia. 2010;51:1685–1690. doi: 10.1111/j.1528-1167.2010.02677.x. [DOI] [PMC free article] [PubMed] [Google Scholar]
- 5.Salmena L, Poliseno L, Tay Y, Kats L, Pandolfi PP. A ceRNA hypothesis: The Rosetta Stone of a hidden RNA language? Cell. 2011;146:353–358. doi: 10.1016/j.cell.2011.07.014. [DOI] [PMC free article] [PubMed] [Google Scholar]
- 6.Ergun S, Oztuzcu S. Oncocers: ceRNA-mediated cross-talk by sponging miRNAs in oncogenic pathways. Tumour Biol. 2015;36:3129–3136. doi: 10.1007/s13277-015-3346-x. [DOI] [PubMed] [Google Scholar]
- 7.Xia T, Liao Q, Jiang X, Shao Y, Xiao B, Xi Y, Guo J. Long noncoding RNA associated-competing endogenous RNAs in gastric cancer. Sci Rep. 2014;4:6088. doi: 10.1038/srep06088. [DOI] [PMC free article] [PubMed] [Google Scholar]
- 8.Sumazin P, Yang X, Chiu HS, Chung WJ, Iyer A, Llobet-Navas D, Rajbhandari P, Bansal M, Guarnieri P, Silva J, Califano A. An extensive microRNA-mediated network of RNA-RNA interactions regulates established oncogenic pathways in glioblastoma. Cell. 2011;147:370–381. doi: 10.1016/j.cell.2011.09.041. [DOI] [PMC free article] [PubMed] [Google Scholar]
- 9.Karreth FA, Tay Y, Perna D, Ala U, Tan SM, Rust AG, DeNicola G, Webster KA, Weiss D, Perez-Mancera PA, et al. In vivo identification of tumor-suppressive PTEN ceRNAs in an oncogenic BRAF-induced mouse model of melanoma. Cell. 2011;147:382–395. doi: 10.1016/j.cell.2011.10.032. [DOI] [PMC free article] [PubMed] [Google Scholar]
- 10.Tay Y, Kats L, Salmena L, Weiss D, Tan SM, Ala U, Karreth F, Poliseno L, Provero P, Di Cunto F, et al. Coding-independent regulation of the tumor suppressor PTEN by competing endogenous mRNAs. Cell. 2011;147:344–357. doi: 10.1016/j.cell.2011.09.029. [DOI] [PMC free article] [PubMed] [Google Scholar]
- 11.Ma C, Nong K, Zhu H, Wang W, Huang X, Yuan Z, Ai K. H19 promotes pancreatic cancer metastasis by derepressing let-7's suppression on its target HMGA2-mediated EMT. Tumour Biol. 2014;35:9163–9169. doi: 10.1007/s13277-014-2185-5. [DOI] [PubMed] [Google Scholar]
- 12.Cao C, Zhang T, Zhang D, Xie L, Zou X, Lei L, Wu D, Liu L. The long non-coding RNA, SNHG6-003, functions as a competing endogenous RNA to promote the progression of hepatocellular carcinoma. Oncogene. 2017;36:1112–1122. doi: 10.1038/onc.2016.278. [DOI] [PubMed] [Google Scholar]
- 13.Zhou X, Liu J, Wang W. Construction and investigation of breast-cancer-specific ceRNA network based on the mRNA and miRNA expression data. IET Syst Biol. 2014;8:96–103. doi: 10.1049/iet-syb.2013.0025. [DOI] [PMC free article] [PubMed] [Google Scholar]
- 14.Du Z, Sun T, Hacisuleyman E, Fei T, Wang X, Brown M, Rinn JL, Lee MG, Chen Y, Kantoff PW, Liu XS. Integrative analyses reveal a long noncoding RNA-mediated sponge regulatory network in prostate cancer. Nat Commun. 2016;7:10982. doi: 10.1038/ncomms10982. [DOI] [PMC free article] [PubMed] [Google Scholar]
- 15.Jiang H, Ma R, Zou S, Wang Y, Li Z, Li W. Reconstruction and analysis of the lncRNA-miRNA-mRNA network based on competitive endogenous RNA reveal functional lncRNAs in rheumatoid arthritis. Mol Biosyst. 2017;13:1182–1192. doi: 10.1039/C7MB00094D. [DOI] [PubMed] [Google Scholar]
- 16.Lai Y, He S, Ma L, Lin H, Ren B, Ma J, Zhu X, Zhuang S. HOTAIR functions as a competing endogenous RNA to regulate PTEN expression by inhibiting miR-19 in cardiac hypertrophy. Mol Cell Biochem. 2017;432:179–187. doi: 10.1007/s11010-017-3008-y. [DOI] [PubMed] [Google Scholar]
- 17.Lin R, Turecki G. Noncoding RNAs in depression. Adv Exp Med Biol. 2017;978:197–210. doi: 10.1007/978-3-319-53889-1_11. [DOI] [PubMed] [Google Scholar]
- 18.Barrett T, Wilhite SE, Ledoux P, Evangelista C, Kim IF, Tomashevsky M, Marshall KA, Phillippy KH, Sherman PM, Holko M, et al. NCBI GEO: Archive for functional genomics data sets-update. Nucleic Acids Res. 2013;41:D991–D995. doi: 10.1093/nar/gks1193. [DOI] [PMC free article] [PubMed] [Google Scholar]
- 19.Li JH, Liu S, Zhou H, Qu LH, Yang JH. starBase v2.0: Decoding miRNA-ceRNA, miRNA-ncRNA and protein-RNA interaction networks from large-scale CLIP-Seq data. Nucleic Acids Res. 2014;42:D92–D97. doi: 10.1093/nar/gkt1248. [DOI] [PMC free article] [PubMed] [Google Scholar]
- 20.Langfelder P, Horvath S. WGCNA: An R package for weighted correlation network analysis. BMC Bioinformatics. 2008;9:559. doi: 10.1186/1471-2105-9-559. [DOI] [PMC free article] [PubMed] [Google Scholar]
- 21.Huang da W, Sherman BT, Lempicki RA. Systematic and integrative analysis of large gene lists using DAVID bioinformatics resources. Nat Protoc. 2009;4:44–57. doi: 10.1038/nprot.2008.211. [DOI] [PubMed] [Google Scholar]
- 22.Kanehisa M, Furumichi M, Tanabe M, Sato Y, Morishima K. KEGG: New perspectives on genomes, pathways, diseases and drugs. Nucleic Acids Res. 2017;45:D353–D361. doi: 10.1093/nar/gkw1092. [DOI] [PMC free article] [PubMed] [Google Scholar]
- 23.Bader GD, Hogue CW. An automated method for finding molecular complexes in large protein interaction networks. BMC Bioinformatics. 2003;4:2. doi: 10.1186/1471-2105-4-2. [DOI] [PMC free article] [PubMed] [Google Scholar]
- 24.Subramanian A, Tamayo P, Mootha VK, Mukherjee S, Ebert BL, Gillette MA, Paulovich A, Pomeroy SL, Golub TR, Lander ES, Mesirov JP. Gene set enrichment analysis: A knowledge-based approach for interpreting genome-wide expression profiles. Proc Natl Acad Sci USA. 2005;102:15545–15550. doi: 10.1073/pnas.0506580102. [DOI] [PMC free article] [PubMed] [Google Scholar]
- 25.Lamb J, Crawford ED, Peck D, Modell JW, Blat IC, Wrobel MJ, Lerner J, Brunet JP, Subramanian A, Ross KN, et al. The connectivity map: Using gene-expression signatures to connect small molecules, genes, and disease. Science. 2006;313:1929–1935. doi: 10.1126/science.1132939. [DOI] [PubMed] [Google Scholar]
- 26.Cai N, Li Y, Chang S, Liang J, Lin C, Zhang X, Liang L, Hu J, Chan W, Kendler KS, et al. Genetic control over mtDNA and Its relationship to major depressive disorder. Curr Biol. 2015;25:3170–3177. doi: 10.1016/j.cub.2015.10.065. [DOI] [PMC free article] [PubMed] [Google Scholar]
- 27.Czibere L, Baur LA, Wittmann A, Gemmeke K, Steiner A, Weber P, Pütz B, Ahmad N, Bunck M, Graf C, et al. Profiling trait anxiety: Transcriptome analysis reveals cathepsin B (Ctsb) as a novel candidate gene for emotionality in mice. PLoS One. 2011;6:e23604. doi: 10.1371/journal.pone.0023604. [DOI] [PMC free article] [PubMed] [Google Scholar]
- 28.Kripke DF, Nievergelt CM, Joo E, Shekhtman T, Kelsoe JR. Circadian polymorphisms associated with affective disorders. J Circadian Rhythms. 2009;7:2. doi: 10.1186/1740-3391-7-2. [DOI] [PMC free article] [PubMed] [Google Scholar]
- 29.Kripke DF, Nievergelt CM, Tranah GJ, Murray SS, Rex KM, Grizas AP, Hahn EK, Lee HJ, Kelsoe JR, Kline LE. FMR1, circadian genes and depression: Suggestive associations or false discovery? J Circadian Rhythms. 2013;11:3. doi: 10.1186/1740-3391-11-3. [DOI] [PMC free article] [PubMed] [Google Scholar]
- 30.Maes M, Ombelet W, Verkerk R, Bosmans E, Scharpé S. Effects of pregnancy and delivery on the availability of plasma tryptophan to the brain: Relationships to delivery-induced immune activation and early post-partum anxiety and depression. Psychol Med. 2001;31:847–858. doi: 10.1017/S0033291701004007. [DOI] [PubMed] [Google Scholar]
- 31.Murray JM, Sletten TL, Magee M, Gordon C, Lovato N, Bartlett DJ, Kennaway DJ, Lack LC, Grunstein RR, Lockley SW, et al. Prevalence of circadian misalignment and its association with depressive symptoms in delayed sleep phase disorder. Sleep. 2017:40. doi: 10.1093/sleep/zsw002. doi: 10.1093/sleep/zsw002. [DOI] [PubMed] [Google Scholar]
- 32.Takaesu Y, Inoue Y, Ono K, Murakoshi A, Futenma K, Komada Y, Inoue T. Circadian rhythm sleep-wake disorders as predictors for bipolar disorder in patients with remitted mood disorders. J Affect Disord. 2017;220:57–61. doi: 10.1016/j.jad.2017.05.041. [DOI] [PubMed] [Google Scholar]
- 33.Lee JH, Park SK, Ryoo JH, Oh CM, Mansur RB, Alfonsi JE, Cha DS, Lee Y, McIntyre RS, Jung JY. The association between insulin resistance and depression in the Korean general population. J Affect Disord. 2017;208:553–559. doi: 10.1016/j.jad.2016.10.027. [DOI] [PubMed] [Google Scholar]
- 34.Chen WV, Nwakeze CL, Denny CA, O'Keeffe S, Rieger MA, Mountoufaris G, Kirner A, Dougherty JD, Hen R, Wu Q, Maniatis T. Pcdhalphac2 is required for axonal tiling and assembly of serotonergic circuitries in mice. Science. 2017;356:406–411. doi: 10.1126/science.aal3231. [DOI] [PMC free article] [PubMed] [Google Scholar]
- 35.Bai M, Zhu X, Zhang Y, Zhang S, Zhang L, Xue L, Yi J, Yao S, Zhang X. Abnormal hippocampal BDNF and miR-16 expression is associated with depression-like behaviors induced by stress during early life. PLoS One. 2012;7:e46921. doi: 10.1371/journal.pone.0046921. [DOI] [PMC free article] [PubMed] [Google Scholar]
- 36.Baudry A, Mouillet-Richard S, Schneider B, Launay JM, Kellermann O. miR-16 targets the serotonin transporter: A new facet for adaptive responses to antidepressants. Science. 2010;329:1537–1541. doi: 10.1126/science.1193692. [DOI] [PubMed] [Google Scholar]
- 37.Shao QY, You F, Zhang YH, Hu LL, Liu WJ, Liu Y, Li J, Wang SD, Song MF. CSF miR-16 expression and its association with miR-16 and serotonin transporter in the raphe of a rat model of depression. J Affect Disord. 2018;238:609–614. doi: 10.1016/j.jad.2018.06.034. [DOI] [PubMed] [Google Scholar]
- 38.Gheysarzadeh A, Sadeghifard N, Afraidooni L, Pooyan F, Mofid MR, Valadbeigi H, Bakhtiari H, Keikhavani S. Serum-based microRNA biomarkers for major depression: MiR-16, miR-135a, and miR-1202. J Res Med Sci. 2018;23:69. doi: 10.4103/jrms.JRMS_879_17. [DOI] [PMC free article] [PubMed] [Google Scholar]
- 39.Mihailova S, Ivanova-Genova E, Lukanov T, Stoyanova V, Milanova V, Naumova E. A study of TNF-α, TGF-β, IL-10, IL-6, and IFN-γ gene polymorphisms in patients with depression. J Neuroimmunol. 2016;293:123–128. doi: 10.1016/j.jneuroim.2016.03.005. [DOI] [PubMed] [Google Scholar]
- 40.Ostacher MJ, Iosifescu DV, Hay A, Blumenthal SR, Sklar P, Perlis RH. Pilot investigation of isradipine in the treatment of bipolar depression motivated by genome-wide association. Bipolar Disord. 2014;16:199–203. doi: 10.1111/bdi.12143. [DOI] [PubMed] [Google Scholar]
Associated Data
This section collects any data citations, data availability statements, or supplementary materials included in this article.
Data Availability Statement
The datasets used and/or analyzed during the current study are available from the corresponding author on reasonable request.


