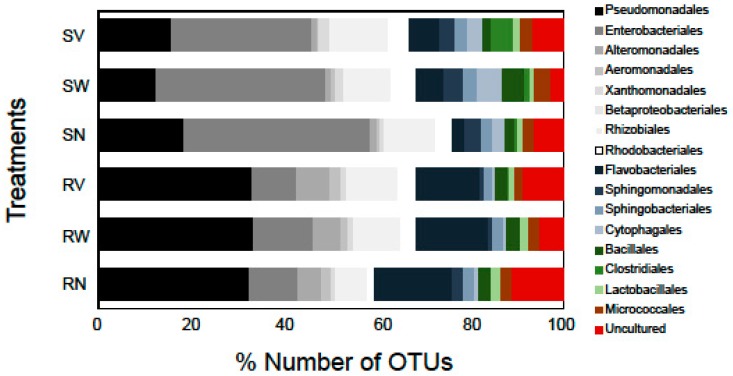
Figure 3.
Number of OTUs (%) of high-level bacterial taxonomic groups (order level) detected in RTE salad samples. The labels SN, SW, SV represent samples from RTE spinach salad without any treatment and with water and vinegar treatment, respectively. The labels RN, RW, RV represent samples from RTE rocket salad without any treatment and with water and vinegar treatment, respectively. Shades of grey represent Proteobacteria, shades of blue represent Bacteroidetes, and shades of green represent Firmicutes. Bacterial orders with OTU richness < 1% in all data sets are not shown.

